
The Maldives–Poster Child for rising Sea Levels
The three most mentioned evils of rising CO2 are Rising Temperatures, Declining Sea Ice and Rising Sea Levels. Plateaus presently appearing in the first two have been discussed a lot here and elsewhere. This post gives what you need to know about Sea Level alarms.
Sea level rise (according to NASA)
Global sea level rose about 17 centimeters (6.7 inches) in the last century. The rate in the last decade, however, is nearly double that of the last century.
Dave Burton takes us underneath the hype and exposes the facts. Below is his post originally at Tom Fuller’s website. David Burton puts it all in perspective from his location on the coast of North Carolina. Much more info on sea levels is available at Dave’s own website linked below.
Sea-level rise is not accelerating, and has not accelerated since the 1920s.
There are about sixty good-quality, 100+ year records of sea-level around the world, and they all show the same thing: there has been no statistically significant acceleration (increase) in the rate of sea-level rise in the last 85 years or more. That means anthropogenic CO2 emissions do not measurably affect sea-level rise, and predictions of wildly accelerated sea-level rise are based on superstition, not science.
Here are two very high quality sea-level measurement records, one from the Pacific and one from the Atlantic:


With atmospheric CO2 at 0.040% by volume, globally averaged sea-level rise at the coasts is just under +1.5 mm/year.
When atmospheric CO2 was at 0.031% by volume, globally averaged sea-level rise at the coasts was just under +1.5 mm/year.
The difference is that climate alarmists think the current +1.5 mm/year is catastrophic and caused by human release of CO2, and the +1.5 mm/year 85 years ago was natural and inconsequential.
However, the similarity between the two numbers — the catastrophic 1.5 mm/yr and the inconsequential 1.5 mm/yr — has confused even some liberals into backing away from the One True Climate Faith. Even President Obama’s former Undersecretary for Science, Steven Koonin, has written that:
“Even though the human influence on climate was much smaller in the past, the models do not account for the fact that the rate of global sea-level rise 70 years ago was as large as what we observe today.”
Sea-level didn’t actually rise 3.39 mm last year, at the coasts.
That 3.39 mm number is from satellite altimetry measurements of the open ocean, inflated by the addition of model-derived GIA estimates. It has little relation to anything that matters.
Most fundamentally, satellite altimeters measure the wrong thing. Their measurements are distorted by “sea-level rise” caused by thermal expansion when the upper layer of the ocean warms. But that is a strictly local effect, which doesn’t affect the quantity of water in the oceans, and doesn’t affect sea-level elsewhere (e.g., at the coasts).
Sea-level rise only matters at the coasts, but satellite altimeters are incapable of measuring sea-level at the coasts. Tide gauges measure sea-level at the coasts, where it matters, and their data is of much higher quality.
The best tide-gauge records of sea-level measurements are nearly ten times as long as the combined satellite measurement record, and twenty times as long as any single satellite measurement record, and the tide-gauge records are trustworthy.
The satellite measurements of sea-level are not. They are subject to a long list of potential distortions, and vary considerably from one satellite to another.
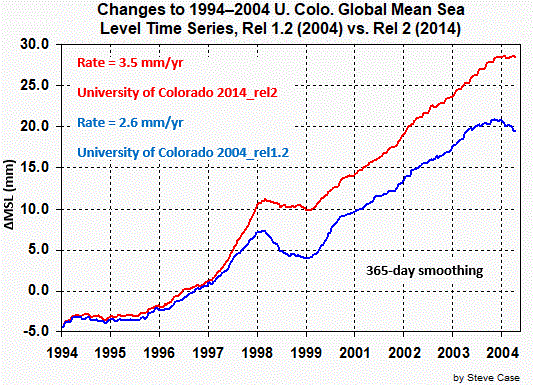
Steve Case has documented how U.Col. has revised their satellite “measurements” of sea-level over the years:
The Envisat numbers were revised even more dramatically. Subsequent revisions to data up to ten years after it was recorded approximately tripled the rate of sea-level rise “measured” by Envisat.

NASA is aware of the problems with satellite measurements, and they’ve proposed a new mission called the Geodetic Reference Antenna in SPace (GRASP) to try to improve matters. However, that mission has not been funded.
References and additional information is here: http://www.sealevel.info/
Footnote February 23, 2016
Dave Burton warned us above about superstitious sea level rises to come. Prime example comes in Scientific American article gone viral in mass media. The abstract of the study:
We present the first, to our knowledge, estimate of global sea-level (GSL) change over the last ∼3,000 years that is based upon statistical synthesis of a global database of regional sea-level reconstructions. GSL varied by ∼±8 cm over the pre-Industrial Common Era, with a notable decline over 1000–1400 CE coinciding with ∼0.2 °C of global cooling. The 20th century rise was extremely likely faster than during any of the 27 previous centuries. Semiempirical modeling indicates that, without global warming, GSL in the 20th century very likely would have risen by between −3 cm and +7 cm, rather than the ∼14 cm observed. Semiempirical 21st century projections largely reconcile differences between Intergovernmental Panel on Climate Change projections and semiempirical models.
My bolding is to draw attention to the basis in models not observations. Further they say half the projected rise is due to thermal expansion which is a local effect not appearing at the coastline or on tidal gauges.
In ancient times people built idols in their own images and worshiped them to ensure more favorable weather and prosperity. Today those icons take the form of computer models whose prophecies are sure to scare the bejesus out of us.

Reblogged this on Climate Collections and commented:
Ron Clutz provides an excellent discussion on sea levels.
“Sea-level rise is not accelerating, and has not accelerated since the 1920s.”
That is, the rate of sea level rise has been constant. AGW has not added to that rate. Ergo, no crisis.
LikeLiked by 1 person
Reblogged this on WeatherAction News.
LikeLiked by 1 person
Reblogged this on TheFlippinTruth.
LikeLiked by 1 person
Great post. Nice summary. For other SLR games warmunists tried but failed to play in pal reviewed literature, see essay PseudoPrecision.
LikeLiked by 1 person
Thanks to all those reading this. Be clear that the content above is the work of Dave Burton, whose explanation was so clear and convincing that I wanted more people to see it. The depth of Dave’s knowledge in on display at his website devoted to Sea Level Rise. There you can even check out the dataset for tidal guages near your home.
http://www.sealevel.info/
LikeLiked by 1 person
Thank you, Ron. You are very kind.
LikeLike
BTW, the caption on Steve Case’s graph (“Changes to Global Mean Sea Level Time Series, 2004 – 2014”) might be confusing. The “2004 – 2014” refers to the change from the rel. 1.2 (2004) version data to the rel. 2 (2014) version data. An alternate caption could be:
Changes to 1994–2004 U. Colo. Global Mean Sea Level Time Series, Rel 1.2 (2004) vs. Rel 2 (2014)
Here it is re-captioned:

LikeLike
Thanks, Dave. Fixed
LikeLiked by 1 person
How does this jibe with the recent article in Scientific American http://www.scientificamerican.com/article/new-data-reveal-stunning-acceleration-of-sea-level-rise/
LikeLike
Just look at the abstract:
We present the first, to our knowledge, estimate of global sea-level (GSL) change over the last ∼3,000 years that is based upon statistical synthesis of a global database of regional sea-level reconstructions. GSL varied by ∼±8 cm over the pre-Industrial Common Era, with a notable decline over 1000–1400 CE coinciding with ∼0.2 °C of global cooling. The 20th century rise was extremely likely faster than during any of the 27 previous centuries. Semiempirical modeling indicates that, without global warming, GSL in the 20th century very likely would have risen by between −3 cm and +7 cm, rather than the ∼14 cm observed. Semiempirical 21st century projections largely reconcile differences between Intergovernmental Panel on Climate Change projections and semiempirical models.
Note: “reconstructions”, “semiempirical modelling”. This is not observations at the coastlines, but projections by models containing modelers’ assumptions. And they say half the rise is due to thermal expansion, which is a local effect.
This is exactly modern superstition that Dave Burton warned about
LikeLiked by 1 person
Sorry for the tardy reply, Pete.
Did you read that SciAm article? Did you read what they called “stunning?”
“…at least half of more than 5 inches of sea level rise they detected during the 20th century…”
In other words, about 3 inches, in a century.
They seem to be very easily stunned.
LikeLike
Thanks for sharing this Ron. Regarding satellite data, you may wish to research the “Palmdale Bulge” regarding early satellite data on an area near Palmdale California. The level of the bulge was, for at least a decade, and maybe still is, debated, and we are talking about several hundred millimeters of controversy on relatively stationary land in a desert, relatively unaffected by lunar cycles, storms waves etc.
I have yet to hear of any land movement analysis done on the tide gauges which compose the tide gauge record. This is surprising, and if such an analysis supported the satellites, I think it would have been done.
LikeLike
Outstanding post. Another clear, concise fact based splash of cold water on the alarmist’s claptrap.
LikeLiked by 1 person
I stumbled in here looking for Dave Burtan’s take on Sea Level Rise due to Thermal Expansion. I was surprised to see my little graph show up here. Thanks for the credit.
I thought that Dave said that Sea Level Rise due to Thermal Expansion was local. I’ve been trying to wrap my mind around that one for some time now. I thought I’d do a search before I bothered him with an email.
LikeLike
Steve, I have this impression. Thermal expansion happens when water is heated, which depends on situational conditions. However, modelers may project a generalized effect, calculating a larger rise in sea levels (due to expected warming) than what is actually observed at the coastlines.
LikeLike
Hi Steve,
Sea-level rise due to thermal expansion in the upper layer of the ocean (where most thermal expansion occurs) is strictly local, because gravity balances mass, not volume. That’s also why ships’ displacements are given in units of mass, rather than volume.
Such sea-level rise occurs only where the water warms. Such localized sea-level rise affects the satellite altimetry measurements, but it does not affect sea-level elsewhere, because it causes no net lateral flows of water.
(Caveat: if the density of the water at the sea floor were to change, that would affect sea-level everywhere, much like raising or lowering the sea floor, itself, would do. However, in practice, there’s hardly any of that. Most ocean warming is surface warming.)
Suppose, for example, that (somehow) the upper layer of a region in the middle of the Indian Ocean were to warm substantially, and expand accordingly. You might think that the raised water would “run downhill” and affect sea-level, but what would actually happen is a roughly circular flow at the boundaries, with surface water flowing “downhill” away from the elevated area of reduced density, and exactly the same mass of higher-density water flowing into the area of reduced density, at depth. The net effect is a gradual spreading of the area of reduced density, but no effect on sea-level beyond where that spreading occurs.
For example, if an area of ocean surface water warms by about 3°C, its density will be reduced by about 0.1%, and it will bulge up proportionately. If there were a barrier to prevent flow between the two areas, it would be perfectly stable with the low-density liquid’s surface higher than the high-density liquid’s surface, as in this demonstration:
Alternately, if the low-density water is frozen, that will also prevent flow between the two areas, just as effectively.
OTOH, if there’s no barrier, and the water is liquid, then along the boundaries of the warm (low-density) section there will be a slight more-or-less rotational flow, a mixing action between the warm and cold waters. The warmer water flows away from the warm section at the surface, and the cooler, denser return flow is toward the warm section farther down. That slight rotational flow works to gradually spread the warm spot (as does normal ocean wind and wave action), but the flows to and from the warm section are balanced, so there’s still no net flow of water away from the warm spot, and no effect on sea-level at distant harbors. Sea-level is affected only where the water is warmer.
The spreading action is very gradual, though. If your warm spot is 1/3 the size of the Indian Ocean, the temperature-driven flows at its boundary have negligible effect on the size of the warm spot, over a reasonable amount of time.
If you somehow had a transient condition in which warm water was side-by-side with cold water, yet their surfaces were at the same height, what do you think would happen? The answer is that the force of gravity would be greater on the denser cold water, than on the less-dense warm water. That would cause the cold water surface to sink, and the warm water surface to rise, until the force of gravity was equalized between them, thus creating the warm bulge.
So if you warm a section of the ocean, it will rise up, in place, just as happens if you freeze a section of it. The lower the density is the higher the sea-level will be, but only where the water warms. The water doesn’t affect sea-level far away, because there is no net lateral flow of water away from the “bump.”
It’s not hard to calculate the surface height differences. The difference in depths is proportional to the difference in density.
For example, suppose that an few million square-mile section of surface water in the Indian Ocean, 100 meters deep, were heated until its average density was 0.1% lower than the density of the surrounding ocean water. (It would need to be about 3°C warmer, on average, than the surrounding water.) All other factors being equal, that warmer water would rise up 100 meters / 0.1% = 10 cm.
Gravity balances mass, not volume, so the force of gravity on the warm water would be exactly the same as on surrounding denser water, so there would be no net lateral flow as a result of the expansion of the warm water, and the surface height in the warm patch would remain ≈10 cm higher than the surrounding ocean as long as the top 100 meters of water remained ≈3°C warmer than the surrounding cooler part of the ocean.
At the boundaries, there would be a slight rotational flow working to gradually spread the warm spot, but the sea surface heights would not equalize before the temperatures equalized.
LikeLike
Dave, Thanks for the reply. The concept is difficult to wrap your mind around. Sea level varies around the world for a variety of reasons, and it looks like thermal expansion is just another one of those reasons.
LikeLike