October 3, 2016
In this overheated political season, this post may be a useful reminder of the facts as protection against lots of unproven claims flying around.

The captions and most comments below come from Mike van Biezen in his recent essay published at the Daily Wire (here). To illustrate his points, I added images collected from various internet addresses. Michael van Biezen teaches physics and earth sciences at Loyola Marymount University, Los Angeles, and his many lectures are available on Youtube at his website (here).
Temperature records from around the world do not support the assumption that today’s temperatures are unusual.

Many people experience the range of temperatures on this scale on a daily and seasonal basis.
Satellite temperature data do not support the assumption that temperatures are rising rapidly.

The world experienced a significant cooling trend between 1940 and 1980. CO2 levels do not correlate consistently with temperatures.

Urban heat island effect skews the temperature data of a significant number of weather stations.

There is a natural inverse relationship between global temperatures and atmospheric CO2 levels.

On the graph above, the past is on the right side, time goes to the left. You can see that the Antarctic temperature starts to change first, and CO₂ responds with a 800-year lag. The explanation is obvious: oceans are large and it simply takes centuries for them to warm up or cool down before they release or absorb gases.
Higher temperatures increase atmospheric CO2 levels and lower temperatures decrease atmospheric CO2 levels, not the other way around.
The CO2 cannot, from a scientific perspective, be the cause of significant global temperature changes

The H2O molecule which is much more prevalent in the Earth’s atmosphere, and which is a bend molecule, has many more vibrational modes, and absorbs many more frequencies emitted by the Earth, including to some extent the radiation absorbed by CO2. It turns out that between water vapor and CO2, nearly all of the radiation that can be absorbed by CO2 is already being absorbed.
Many periods during our recent history show that a warmer climate was prevalent long before the industrial revolution.

Glaciers have been melting for more than 150 years.

“Data adjustment” is used to continue the perception of global warming.

The Moral of The Climate Story:
Global warming alarm is not supported by temperature data.
We all have a choice: Listen to the facts, or listen to the fears:

Michael Crichton (2002)
Like a bearded nut in robes on the sidewalk proclaiming the end of the world is near, the media is just doing what makes it feel good, not reporting hard facts. We need to start seeing the media as a bearded nut on the sidewalk, shouting out false fears. It’s not sensible to listen to it.
Reblogged this on Climate Collections.
LikeLike
Reblogged this on Climatism and commented:
“Global Warming” aka “Climate Change” aka “Climate Disruption” aka “Global Weirding” is the virtue-signalling religion of our time.
With the decline of religion, some people need a moral signal to show that they’re good.
“Global warming” is particularly good because they don’t actually have to do anything. They don’t have to cure leppers, or feed the hungry. All they have to do is yell that the planet is warming up.
Until they find another way of signalling virtue, we’re stuck with this one!
LikeLike
Only recently discovered your site and have re-posted this article. It is very helpful to have articles like this to explain the state of the climate as all we seem to get from the main media are claim after claim of apocalypse and… as you say, the data just does not suggest it… Cheers Dave.
LikeLike
Welcome Dave, and thanks for commenting. In addition to the overview pages (top left corner menu), this post can also serve as an introduction to this site:
https://rclutz.wordpress.com/2016/07/28/climate-whack-a-mole/
LikeLike
https://climate.nasa.gov/evidence/
LikeLike
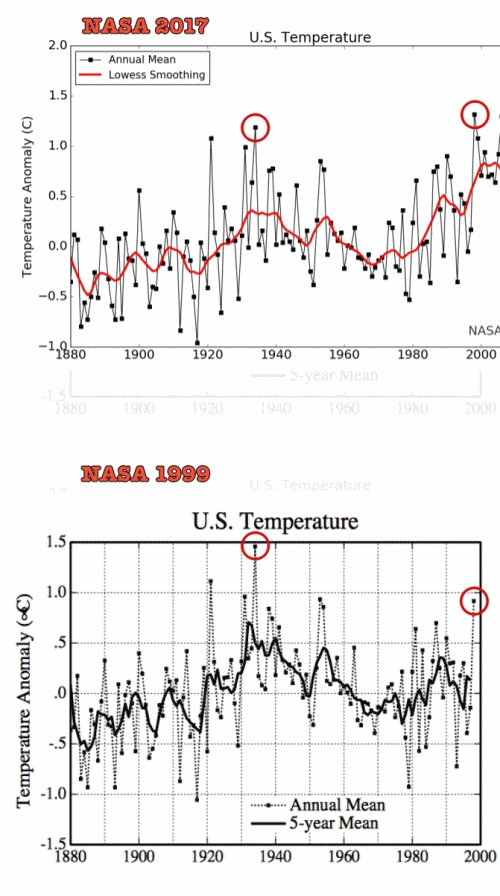
The link goes to NASA website where a graph is posted to show a sharp increase in global temperature, almost a whole degree since 1930s. But this is a different story from the past. As recently as 1999, they were showing this:

“There is little doubt that we are living in a warm period. However, there is also little doubt that current climate change is not abnormal and not outside the range of natural variations that might be expected.”
“Based on the above it is not possible to conclude which of the above five databases represents the best estimate on global temperature variations. The answer to this question remains elusive. All five databases are the result of much painstaking work, and they all represent admirable attempts towards establishing an estimate of recent global temperature changes. At the same time it should however be noted, that a temperature record which keeps on changing the past hardly can qualify as being correct.”
Dr. Ole Humlum, Professor of Physical Geography at the University Centre in Svalbard (Norway).
Full 2017 report from GWPF is at https://www.thegwpf.org/content/uploads/2018/03/State-of-the-Climate2017.pdf
In this last report, Dr. Humlum adds this observation:
“It is instructive to consider the variation of the annual change rate of atmospheric CO2 together with the annual change rates for the global air temperature and global sea surface temperature (Figure 16). All three change rates clearly vary in concert, but with sea surface temperature rates leading the global temperature rates by a few months and atmospheric CO2 rates lagging 11–12 months behind the sea surface temperature rates.”
LikeLiked by 1 person