June Sea Surface Temperatures (SSTs) are now available, and we can see ocean temps dropping further after a short pause and resuming the downward trajectory from the previous 12 months.
HadSST is generally regarded as the best of the global SST data sets, and so the temperature story here comes from that source, the latest version being HadSST3.
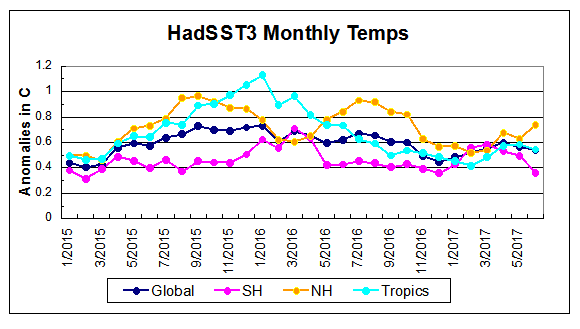
The chart below shows the last two years of SST monthly anomalies as reported in HadSST3 including June 2017.

In May despite a slight rise in the Tropics, declines in both hemispheres and globally caused SST cooling to resume after an upward bump in April. Now in June a large spike upward in NH was overcome by an even larger drop in SH, now three months into a cooling phase. The Tropics also cooled off so the Global anomaly continued to decline. Presently NH and SH are both changing strongly but in opposite directions.
Note that higher temps in 2015 and 2016 were first of all due to a sharp rise in Tropical SST, beginning in March 2015, peaking in January 2016, and steadily declining back to its beginning level. Secondly, the Northern Hemisphere added two bumps on the shoulders of Tropical warming, with peaks in August of each year. Also, note that the global release of heat was not dramatic, due to the Southern Hemisphere offsetting the Northern one. Note that June 2017 matches closely to June 2015, with almost the same anomalies for NH, SH and Global. The Tropics are lower now and trending down compared to an upward trend in 2015.
June satellite measures of air over the land and oceans also shows a sharp drop. The graph below provides UAH vs.6 TLT (lower troposphere temps) confirming the general impression from SSTs.
In contrast with SST measurements, air temps in the TLT upticked in May with all areas participating in the rise of almost 0.2C. Then in June SH dropped 0.4C, NH down 0.2C while the Tropics declined slightly. The end result has all areas back to March values except for the Tropics. June 2017 compares closely with July 2015 but with no signs of an impending El Nino.
We have seen lots of claims about the temperature records for 2016 and 2015 proving dangerous man made warming. At least one senator stated that in a confirmation hearing. Yet HadSST3 data for the last two years show how obvious is the ocean’s governing of global average temperatures.

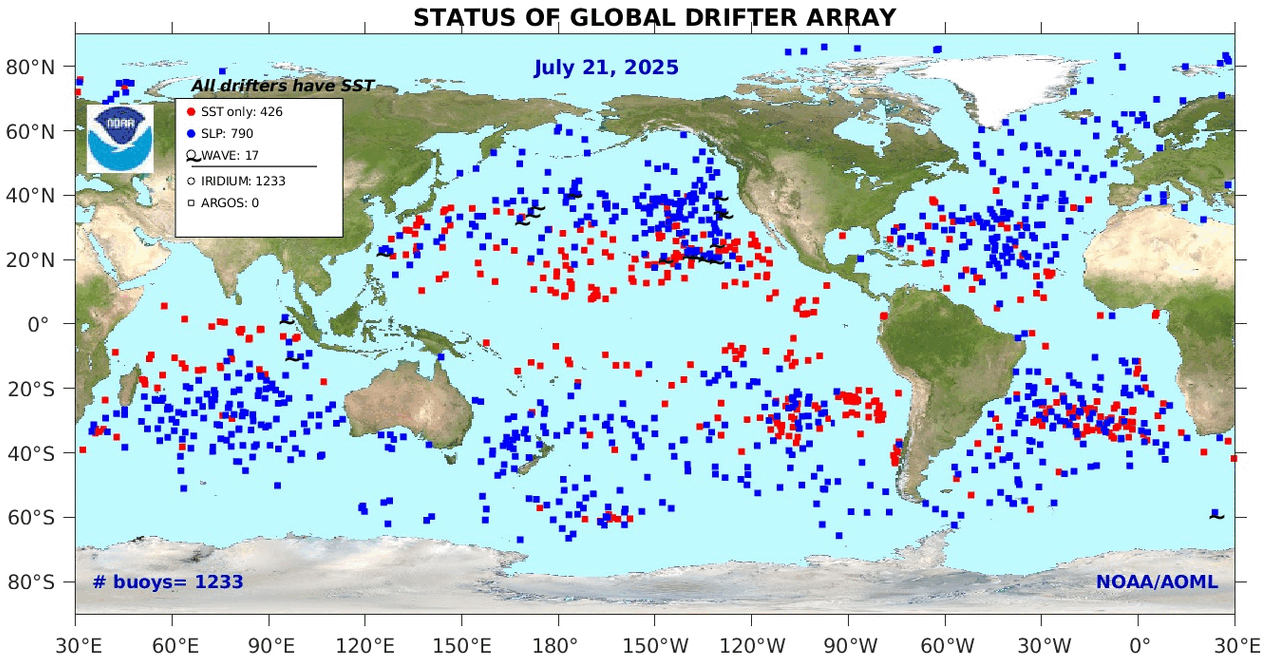
USS Pearl Harbor deploys Global Drifter Buoys in Pacific Ocean
The best context for understanding these two years comes from the world’s sea surface temperatures (SST), for several reasons:
- The ocean covers 71% of the globe and drives average temperatures;
- SSTs have a constant water content, (unlike air temperatures), so give a better reading of heat content variations;
- A major El Nino was the dominant climate feature these years.

Solar energy accumulates massively in the ocean and is variably released during circulation events.
Your well written clear, calm and concise analysis contrasts so sharply against the hysteria of the apocalypse promoters. Thank you for performing this service so consistently.
If I may be so bold to ask, have you considered offering your columns for republishing at WUWT?
LikeLike
Thanks Hunter. I had two posts at WUWT before starting this blog. Sometimes my articles get picked up by others such as No Tricks Zone, GWPF, and occasionally SPPI. I like the freedom to write and publish without requesting anyone’s approval, though I would value and benefit from collaborating with other folks.
LikeLiked by 1 person
From what I understand of the mainstream position, it’s been well-known since at least the 1950s that ocean surface temperatures play an outsized role in short-term temperature fluctuations. The entire science behind El Nino / La Nina oscillation is basically a monument to that; it explains how the oceans cause natural variability in the 2-15 year timeframe.
Under La Nina or neutral conditions, equatorial surface water is warmed by the Sun. Westward winds push this water across the Pacific to build up in the Pacific Warm Pool. When this builds up enough, the winds and currents reverse, suppressing coldwater upwelling in the eastern Pacific, and the warm water spreads out over the oceans of the Earth. The atmosphere gets warmer for about a year.
This oscillation is colder, then warmer, back and forth. The colder phases charge up warm water; the warmer phases release it. But while this has a large influence on short-term surface temperatures, there’s no evidence that it can drive longer-term trends. You need both the cold and warm phases of ENSO for it to work. So I think that many scientists would agree with you that the oceans drive surface temperatures — on short time scales. But only for short timescales. In the long run, they follow the atmospheric temperatures.
LikeLike
Thanks for the comment. I think you are limiting the ocean fluctuations to ENSO, important to be sure, but only one of more than a dozen that have been identified and under study. For example, the AMOC (Atlantic Multidecadal Overturning Oscillation) is thought to drive the quasi-60 year cycle pattern appearing in the temperature records. Since water has about 1000 times the heat capacity of the air, I would look in the oceans which are doing the heavy lifting.
LikeLike
Sure, yah.
If I recall correctly, ENSO provides the largest source of variability as measured in degrees of variability per year. PDO might have a greater max and min, but over much longer time periods, so the annual variability is less.
I definitely agree that we need to study and understand these patterns and other sources of natural variability. I just don’t see much evidence that the ocean current can force long-term temperatures very much; not to a degree comparable with greenhouse gases. I mean, we had a negative PDO phase on top of unusually quiet solar activity, and all it did was slow surface warming for 15 years. Temperatures didn’t even go down. Then we get one decent El Nino, and we demolish previous temperature records.
It’s not that scientists haven’t looked at these issues, at AMOC and PDO. They have. After looking at the evidence, they’ve come to the conclusion that these are not major drivers of the climate. (Minor drivers, yes. Just not major drivers).
LikeLike
So what caused the cooling from 1944 to 1976 while CO2 was rising?
LikeLike
I think this is the answer to the question.

h/t Dan Pangburn
LikeLike
left off some notations: AGT means Average Global Temperatures. N34 refers to the El Nino zone in the Pacific. PDO has to be shown as an integral since its effect is cumulative.
LikeLike
And let’s not leave out the AMO, since it was already mentioned.

The high coefficients of determination in Table 1 and the comparisons in Figures 2 and 3 corroborate the assumption that the saw-tooth profile with a period of 64 years provides adequate approximation of the net effect of all named and unnamed ocean cycles in the calculated AGT anomalies.
LikeLike
Windchaser is wrong about oceans causing multidecadal fluctuations in air temperatures, as I have shown above. He is right that the positive and negative phases offset each other every 30 years or so. A secular (long term) monotonic rise of about 0.5C per century operates in the background with this quasi-60-year oceanic cycle on top. But that 0.5C rise goes back to the end of the Little Ice Age (1850). We do not know definitively what started the LIA or what ended it. But we do know for certain it was not our burning of fossil fuels.
LikeLike
I thought we agreed that oceans cause multidecadal fluctuations in surface temperatures.
My assertion is that there’s no evidence that the oceans can cause sustained long-term trends. There’s neither a mechanism for how they’d do it, nor is there evidence that they have.
Please don’t just regress one metric against temperature and then claim on this basis that this metric governs temperature. That’s a very bad statistical practice; it ignores confounding variables. You have to look at all the metrics.
Equivalently: I’d be careful about looking to just GHG or just oceans or just whatever as an explanation for what the temperatures have done since the Little Ice Age. These all affect the climate. To tease out the effects of one effect versus the other, you need solid data… which we mostly don’t have before ~1950, and which we really don’t have before ~1920. Our temperature data is okay, but our data on solar and aerosols / volcanic activity are too weak to draw strong conclusions. Without that data, we can’t say what caused what.
Actually, I’m checking the trend on surface temperatures, and there’s no statistically significant cooling from 1944 to 1976. (https://www.skepticalscience.com/trend.php). Temperatures were pretty flat. Look for yourself.
As I understand it, current understanding is that this was caused by a combination of aerosols, which have a strong cooling effect on the atmosphere, plus negative phases of PDO, plus natural variation in the form of ENSO. Atmospheric CO2 was rising slowly then, so its effects were easier to counteract.
LikeLike
Your last paragraph. No it wasn’t and assumptions have no value.
LikeLike
Reblogged this on Climate Collections.
LikeLike
Surely any combination of ocean temperatures and air temperatures is fraudulent anyway. This has been undertaken to support the lack of warming over the last 2 decades.
Water evaporates continually and the quantities of heat absorbed are incalculable. The radiant energy that heats land surfaces to up to 70.7°C rarely heat the ocean surfaces above the low 30’s.
Besides that ocean currents distribute “heat” around he globe and this is incalculable.
And if this isn’t enough doubt how is it possible to apply a “law” – the Stefan-Boltzmann equation – derived from data based on the observation of cavity radiation which emits a continuous spectrum to gases which we all should know emit line spectra !
All of the so called “physics 101” of the greenhouse effect based on the models shown all over the Internet and taught at Universities as basic “greenhouse science” is simply absurd beyond belief !
The Stefan-Boltzmann equation simply cannot apply to gases !
LikeLike