
September Sea Surface Temperatures (SSTs) are now available, and we see downward spikes in ocean temps everywhere, led by sharp decreases in the Tropics and SH, reversing the bump upward last month. The Tropical cooling in particular factors into forecasters favoring an unusually late La Nina appearance in coming months.
HadSST is generally regarded as the best of the global SST data sets, and so the temperature story here comes from that source, the latest version being HadSST3.
The chart below shows SST monthly anomalies as reported in HadSST3 starting in 2015 through September 2017.
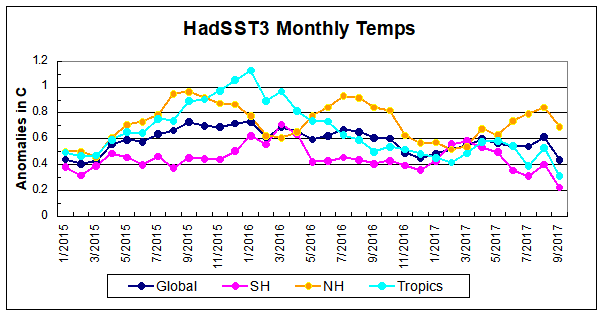
The August bump upward was overcome with the Global average matching the lowest level in the chart at February 2015. September NH temps almost erased a three-month climb; even so 9/2017 is well below the previous two years. Meanwhile SH and the Tropics are setting new lows for this period. With current reports from the El Nino 3.4 grid sector, it seems likely October will go even lower, with downward moves across all oceans.
Note that higher temps in 2015 and 2016 were first of all due to a sharp rise in Tropical SST, beginning in March 2015, peaking in January 2016, and steadily declining back to its beginning level. Secondly, the Northern Hemisphere added two bumps on the shoulders of Tropical warming, with peaks in August of each year. Also, note that the global release of heat was not dramatic, due to the Southern Hemisphere offsetting the Northern one.
Note: Last month someone asked about HadSST calculations, especially as the Global appeared to be a simple average of NH and SH, which would be misleading. My queries to Met Office received these clarifying responses:
My colleague in the Climate Monitoring and Research team has advised the following:
For HadSST3, we take an area-weighted average of all the grid boxes with data in to calculate the global average. We don’t calculate the two hemispheric series and then average them. In the case of SST, this wouldn’t work because the southern hemisphere ocean area is larger than the northern hemisphere.
The uncertainty that arises from incomplete sampling is estimated and incorporated into the global average SST files. Coverage varies throughout the record with the northern hemisphere being generally better observed, but at other times, coverage is concentrated other places, dictated by where shipping happened to be at those times. Since the mid 2000s drifting buoys have provided a more uniform sampling of the world’s oceans. When we compare to other data sets, we typically compare where both data sets have data which minimizes the coverage problems.
Kind regards, Misha, Weather Desk Climate Advisor
Summary
We have seen lots of claims about the temperature records for 2016 and 2015 proving dangerous man made warming. At least one senator stated that in a confirmation hearing. Yet HadSST3 data for the last two years show how obvious is the ocean’s governing of global average temperatures.

USS Pearl Harbor deploys Global Drifter Buoys in Pacific Ocean
The best context for understanding these two years comes from the world’s sea surface temperatures (SST), for several reasons:
- The ocean covers 71% of the globe and drives average temperatures;
- SSTs have a constant water content, (unlike air temperatures), so give a better reading of heat content variations;
- A major El Nino was the dominant climate feature these years.

Solar energy accumulates massively in the ocean and is variably released during circulation events.

Good to see that the oceans get more and more in focus:
__From the Summary above: Yet HadSST3 data for the last two years show how obvious is the ocean’s governing of global average temperatures.
__From ‘wattsupwiththat’ also yesterday (26 Oct): A team of EPFL and European researchers has discovered a flaw in the way past ocean temperatures have been estimated up to now. Their findings could mean that the current period of climate change is unparalleled over the last 100 million years.
LikeLike
That paper from EPFL is misleading. Bill Illis has a library of ocean temperature proxies and notes the the flaw “discovered” by these authors is well-known to other researchers. His comments on the WUWT thread explain, For example
Bill Illis October 26, 2017 at 11:34 am
This was already known about and is adjusted for in all serious temperature reconstructions.
The oxygen-18 isotopes change through time due to diagenesis. We don’t know why it happens but it certainly happens. As the dates of the cores goes further back in time, the diagenesis becomes more and more acute. The data predicts something like +60C temperatures at 500 million years ago while this study only went back 100 million years ago.
Typically, the trend in the oxygen-18 isotopes is removed and then a pretty realistic temperature trend consistent with what we know about historical temperatures in the ancient past emerges. It is a fairly simple correction. Not all climate scientists take this into account – Hansen knows about the problem but doesn’t adjust for it in his material for example.
There is some discussion of this in Sheilds Veizer 2002 and Royer Berner 2004.
Click to access 43794_Shields%2520and%2520Veizer_2002.pdf
Click to access i1052-5173-14-3-4.pdf
If you don’t adjust for the diagenesis, you end up with a temperature line like the blue one here. +15C to +20C at 100 million years ago, but it was really more like +9.0C or +10C.
If the study would have gone back even farther than 100 million years, they would have discovered the rest of the puzzle, which I am afraid, they missed completely.
LikeLike
Thanks!
LikeLike
Reblogged this on Climate Collections.
LikeLike
The oceans are the engine of man-made climate change, so we are told, as they absorb 90% of the heat ‘trapped’ by GHGs in the atmosphere. Global ocean heat content is continuously increasing, so we are told, and this is as a direct result of the top of the atmosphere energy imbalance, so we are told. Problem is, we cannot measure the latter with anything like an acceptable degree of scientific accuracy and the scientific accuracy of the former – equivalent to dipping a thermometer into the world’s oceans and taking the temperature at all depths and in all places to within a hundredth of a degree – is debatable, to say the least.
But here we are, with the oceans cooling across the globe, but GHGs supposedly still filling them with ‘excess’ energy, which we must suppose is being squirreled away in the depths to contribute to surface global warming at some later date.
LikeLike
Jaime, thanks for commenting. There is also the matter that empirical measurements show the ocean heating the air, and not the other way around.
https://rclutz.wordpress.com/2015/05/10/empirical-evidence-oceans-make-climate/
LikeLike
Thanks Ron. There is no doubting that, since the LIA ended, OHC has increased and that OHC has increased during the modern era of supposed ‘man-made global warming’. Exactly by how much is difficult to assess accurately but it would appear that it is not as much as required by models predicting increasing TOA radiative energy imbalance – hence the ‘missing heat’.
The ONLY way that energy gets into the oceans is via short wave solar energy, especially in the tropics. GHGs cannot directly warm the oceans, just slow down the rate at which heat escapes, long term. This naturally invites speculation re. variability in global cloud cover.
We know that during the Mediaeval Warm Period, ocean heat content increased by an order of magnitude more than it has increased in the last several decades. Scientists argue the rate of increase recently is unprecedented but they cannot know this for sure because instruments were not around to record any similar rapid fluctuations during the overall rise in OHC which occurred during the MWP.
Furthermore, there is a lack of evidence that the large increase in OHC during the MWP was forced by radiative anomalies due to GHGs – assumed to be the primary driver of the relatively modest increase in OHC since 1950. So overall, the evidence for GHGs being responsible for OHC increases – and surface climate change – is remarkably weak, whilst the evidence mounts for natural variability playing a key role in both decadal and multi-decadal increases in OHC.
LikeLike
How can “climate sensitivity to raised CO2 levels” calculations be made with this understanding? The “Climate Clown Alarmists” keep throwing around the 2.5C to 4.5C per doubling mantra. Also, how do we get this message through to the media dupes like Vox, Mashable, Business Insider, AP, CNN, MSNBC, ABC, NBC, CBS, PBS, etc… who keep the BIG CITY populations on edge?
LikeLike
Jaime, thanks for expanding on your POV. I will only add that research into variable solar energy due to cloud cover is maturing and adding substance to what was previously speculated. A global network of land-based sites records incident solar radiation and an history of fluctuations is building. For example these recent findings:

Figure 2. Changes in surface solar radiation observed in regions with good station coverage during three periods.(left column) The 1950s–1980s show predominant declines (“dimming”), (middle column) the 1980s–2000 indicate partial recoveries (“brightening”) at many locations, except India, and (right column) recent developments after 2000 show mixed tendencies. Numbers denote typical literature estimates for the specified region and period in W m–2 per decade. Based on various sources as referenced in Wild (2009).
More at https://rclutz.wordpress.com/2017/07/17/natures-sunscreen/
LikeLike
I am a lay person (commercial salmon fishermen The hystericala media is constantly telling us the North Pacific is warming so that it will become unliveable for salmon. What is the real temperature changes in the North Pacific ?
LikeLike
Eric, I can refer you to Cliff Mass, an objective expert on weather and climate, and he is based in Seattle.
http://cliffmass.blogspot.in
I also like to check out the set of SST and ENSO indices at Golden Gate website:
http://ggweather.com/enso.htm
LikeLike
I started swimming in the oceans around 1952 in Florida. I’ve entered the water up and down both coasts of North America, Hawaii, the Caribbean, and southern Italy. I’m pretty good at noticing when the water coming out of my tap changes temperature. I haven’t done tests to determine how acute my abilities are in that regard, but I’m guessing I can notice a degree or two change, no problem. My point is that I haven’t noticed the oceans getting hotter or colder in my lifetime. I don’t see people swimming around in the waters off Alaska nowadays or off Washington or Oregon or northern California because it’s warmer than it used to be. Have scuba divers reported they don’t need wet suits, etc. as much as they used to?
I know; not scientific. But in my lifetime I have also witnessed science make thousands and thousands of “scientifically proven” claims that later proved to be premature at best and outright wrong at worst. The bulk of the evil “climate deniers” are actually just people like me who hesitate to make such earthshaking judgments as we have seen regularly in books, films, and speeches like “the Earth will die in 10 years if we don’t turn off the machines immediately”. We have seen enough to be wary of trying to do things like correct the Earth’s spin or reverse gravity because “the majority of scientists say we must do so NOW”. I think we should proceed with caution as we investigate honestly so we can arrive at a consensus if we really need to take drastic, life-changing measures.
PS: I would love to see pollution addressed at the very least. It kills me to see photos of man-made garbage floating on the beautiful oceans covering miles and miles. Where are the water tests showing the exact content of sea water from all over the world? I’d like to know how the ocean water is being affected by the waste we pump into it.
LikeLike
Thanks B, a lot of common sense in what you say, unfortunately objectivity seems to be more uncommon these days.
The problem of waste going into the oceans is recognized and needs more direct attention rather then blaming ocean dead zones on fossil fuels.
https://rclutz.wordpress.com/2017/02/19/ocean-oxygen-misdirection/
LikeLike
Can man really control temperature change? Is it possible? Is possible that this is just part of the agenda of the environmental “activists” or some say ” bullies” to control the private economy and our private property and to surrender the sovereignty of the USA to others in Europe? Is it possible that their purpose is to decentralize the USA? We should not agree to surrendering our National Sovereignty to international organizations.
Let’s reflect on what some have written such as the following:
“Childbearing should be a punishable crime against society, unless the parents hold a government license. All potential parents should be required to use contraceptive chemicals, the government issuing antidotes to citizens chosen for childbearing.”
– David Brower, first Executive Director of the Sierra Club
“In searching for a new enemy to unite us, we came up with the idea that pollution, the threat of global warming, water shortages, famine and the like would fit the bill.”
“We must make this an insecure and inhospitable place for capitalists and their projects. We must reclaim the roads and plowed land, halt dam construction, tear down existing dams, free shackled rivers and return to wilderness millions of acres of presently settled land.”
– David Foreman, co-founder of Earth First! http://theunsolicitedopinion.com/2013/12/30/quote-isnt-hope-planet-industrialized-civilizations-collapse-maurice-strong/
LikeLike
Government thrives on crisis. It provides the rational on which the expansion of government depends. It is the excuse for taking money from the productive private sector, feeding government with it and making gestures toward an often created problem. The Democrats attempted a controlled disaster in the ACA, but it got out of hand and consumed them – as predicted. Note that Congress resisted being subject to the ACA from its inception.. Note the politicians that leave office as multi millionaires after spending millions of OPM to gain office. Note the sworn dedication to issues that got the Republicans elected – and what has happened since. Is AGW just one more Globalist promoting gigantic ballyhoo? Charlatans have been claiming the ability to control weather as far back as we have history. One aspect of a cooler ocean/warmer land that will bring glee to the AGW cabal: When the ocean is cooler than the land, it tends to bring storms onshore because air tends to move in the direction of the lower barometric pressure.
LikeLike
I implore each and every one of you to research subjects like Climate Engineering, Solar Radiation Management, as well as Stratospheric Aerosol Geoengineering.
LikeLike
i find it interesting that global warming scientists, keep going back a million yrs or more. prove the earth existed in the same form one million years ago or at all. not possible unless you were there. and you certainly could have no idea what the weather was like if it did exist. so right off the bat these theories are flawed
LikeLike
They can use info like dissolved gases in deep-core samples of ice from glaciers to get some idea of prehistoric conditions, but I agree that interpretation of that data gets more and more difficult the further removed we are from those increasingly distant eras.
LikeLike
I have read this article and many other similar articles and all off the comments and and I have come to the conclution that no one on earth has any idea what is realy going on regarding how the earth operates.
Only God knows and He will not allow any wrong doing.
LikeLike
You have attracted the attention of Tamino.
Well done.
Good news always excites him.
Hate to see what will happen if the trend continues…
LikeLike
Good to hear from you angech. I don’t take affront against that crew since it is the facts and data that offend them.
LikeLike
David Dilley has two very interesting YouTube videos. Part 2 is here
Well worth watching.
LikeLike
Thanks Vanessa for that. I did a couple of posts on David Dilley’s global weather oscillations theory, and especailly that warm Atlatnic pulses into the Arctic. See
https://rclutz.wordpress.com/2017/02/07/global-weather-oscillations/
LikeLike