
The best context for understanding these three years comes from the world’s sea surface temperatures (SST), for several reasons:
- The ocean covers 71% of the globe and drives average temperatures;
- SSTs have a constant water content, (unlike air temperatures), so give a better reading of heat content variations;
- A major El Nino was the dominant climate feature these years.
HadSST is generally regarded as the best of the global SST data sets, and so the temperature story here comes from that source, the latest version being HadSST3.
The chart below shows SST monthly anomalies as reported in HadSST3 starting in 2015 through December 2017.

After a bump in October the downward temperature trend has strengthened. As will be shown in the analysis below, 0.4C has been the average global anomaly since 1995 and December has now gone lower to 0.325C. NH dropped sharply along with the Tropics. SH held steady erasing the Oct. bump. All parts of the ocean are clearly lower than at any time in the past 3 years.
For Reference:
Global SSTs are the lowest since 3/2013
NH SSTs are the lowest since 3/3014
SH SSTs are the lowest since 1/2012
Tropics SSTs are the lowest since 3/3012
A longer view of SSTs
The graph below is noisy, but the density is needed to see the seasonal patterns in the oceanic fluctuations. Previous posts focused on the rise and fall of the last El Nino starting in 2015. This post adds a longer view, encompassing the significant 1998 El Nino and since. The color schemes are retained for Global, Tropics, NH and SH anomalies. Despite the longer time frame, I have kept the monthly data (rather than yearly averages) because of interesting shifts between January and July.

Open image in new tab for sharper detail.
1995 is a reasonable starting point prior to the first El Nino. The sharp Tropical rise peaking in 1998 is dominant in the record, starting Jan. ’97 to pull up SSTs uniformly before returning to the same level Jan. ’99. For the next 2 years, the Tropics stayed down, and the world’s oceans held steady around 0.2C above 1961 to 1990 average.
Then comes a steady rise over two years to a lesser peak Jan. 2003, but again uniformly pulling all oceans up around 0.4C. Something changes at this point, with more hemispheric divergence than before. Over the 4 years until Jan 2007, the Tropics go through ups and downs, NH a series of ups and SH mostly downs. As a result the Global average fluctuates around that same 0.4C, which also turns out to be the average for the entire record since 1995.
2007 stands out with a sharp drop in temperatures so that Jan.08 matches the low in Jan. ’99, but starting from a lower high. The oceans all decline as well, until temps build peaking in 2010.
Now again a different pattern appears. The Tropics cool sharply to Jan 11, then rise steadily for 4 years to Jan 15, at which point the most recent major El Nino takes off. But this time in contrast to ’97-’99, the Northern Hemisphere produces peaks every summer pulling up the Global average. In fact, these NH peaks appear every July starting in 2003, growing stronger to produce 3 massive highs in 2014, 15 and 16, with July 2017 only slightly lower. Note also that starting in 2014 SH plays a moderating role, offsetting the NH warming pulses. (Note: these are high anomalies on top of the highest absolute temps in the NH.)
What to make of all this? The patterns suggest that in addition to El Ninos in the Pacific driving the Tropic SSTs, something else is going on in the NH. The obvious culprit is the North Atlantic, since I have seen this sort of pulsing before. After reading some papers by David Dilley, I confirmed his observation of Atlantic pulses into the Arctic every 8 to 10 years as shown by this graph:
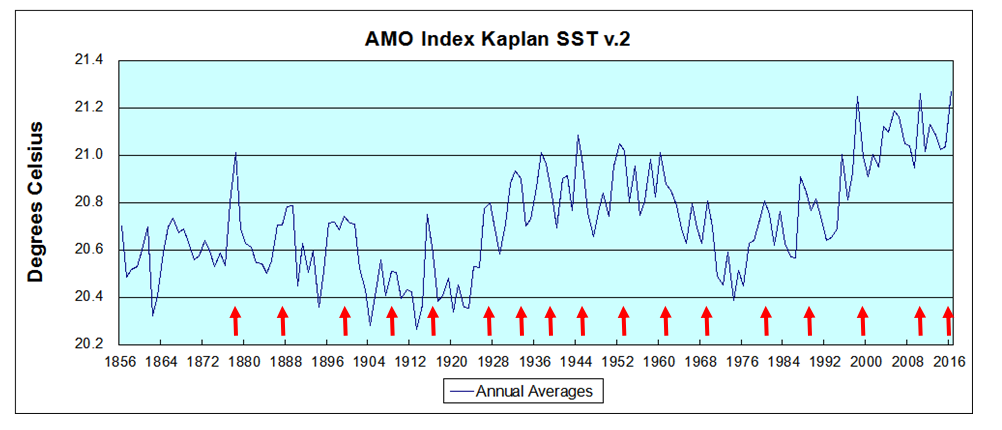 The data is annual averages of absolute SSTs measured in the North Atlantic. The significance of the pulses for weather forecasting is discussed in AMO: Atlantic Climate Pulse
But the peaks coming nearly every July in HadSST require a different picture. Let’s look at August, the hottest month in the North Atlantic from the Kaplan dataset. Now the regime shift appears clearly. Starting with 2003, seven times the August average has exceeded 23.6C, a level that prior to ’98 registered only once before, in 1937. And other recent years were all greater than 23.4C.
Summary
The oceans are driving the warming this century. SSTs took a step up with the 1998 El Nino and have stayed there with help from the North Atlantic, and more recently the Pacific northern “Blob.” The ocean surfaces are releasing a lot of energy, warming the air, but eventually will have a cooling effect. The decline after 1937 was rapid by comparison, so one wonders: How long can the oceans keep this up?

USS Pearl Harbor deploys Global Drifter Buoys in Pacific Ocean

Reblogged this on Climate Collections.
LikeLike
Would be happier if the global temperature showed more signs of dropping consistent with these lowering ocean temperatures
LikeLike
angech, it is true that UAH temps are lagging behind, especially when land is included. However, UAH oceans only shows a similar dropoff in the last quarter:

LikeLike
LikeLike
Hi – do you have a link to David Dilley’s papers that you referenced please? Thanks.
LikeLike
Hi Brandon, an overview and link to his free ebook is https://rclutz.wordpress.com/2017/02/07/global-weather-oscillations/
LikeLike
Much appreciated.
LikeLike
I covered this ground long ago (2008):
http://www.newclimatemodel.com/the-real-link-between-solar-energy-ocean-cycles-and-global-temperature/
LikeLike
Good for you
LikeLike
The CO2 obsession has come at the cost of a lot of well established, evidence backed understanding.
I appreciate that you preserve and reintroduce this “missing” knowledge.
LikeLiked by 1 person
Ron,
I came across this today. Can you comment as your studies seem to show the reverse!
Regards,
Graeme Weber
https://www.carbonbrief.org/category/science/temperature/global-temperature
LikeLike
Graeme, thanks for the question. I am thinking about how to answer concisely while respecting the complexities involved. Stay tuned.
LikeLike
Graeme, my response is posted at https://rclutz.wordpress.com/2018/01/28/what-is-global-temperature-is-it-warming-or-cooling/
LikeLike
I think there is a confusion here. The heat capacities of dry air and of air containing water vapour are very similar*. However, to make warm moist air from cold dry air does require more energy than to make warm dry air from cold dry air, as that energy has to be applied to liquid water (or ice) to evaporate it. That extra energy becomes LATENT heat in the atmosphere, not SENSIBLE heat. When and if the water vapour in the air condenses that heat is released to the surroundings as sensible heat – and a further increase in the temperature of the air then takes place.
Of course the matter is complicated by the fact that moistened air is lighter than dry air and tends to rise and cool whereupon the moisture condenses – but this happens because the water vapour is cooled not because the other gases have lost some metaphorical sponge-like qualities. This natural convection process is the real reason for the large transfer of sensible heat, from the sea to the atmosphere, that always shows up in the earth’s heat budget.
I do not like phrases such as “colder air holds less water vapour” because they are actually meaningless. The various gases act independently except to the extent that they mix and influence each others’ temperatures. You might just as well say “cold nitrogen holds less oxygen!” This is Dalton’s Law.
* If you take a kilogram of dry air in the lab at STP and increase the temperature by 1 K the measured amount of heat you use will be almost the same (just 3% greater) as when you take one kilogram of moist air (97% nitrogen and oxygen and argon, and 3% water vapour) and increase the temperature by 1 K since the heat capacity of water vapour is almost exactly twice that of dry air.
LikeLike
“just 3% greater”
I mean that the moist air requires the 3% extra.
LikeLike
Dave, from the Engineering Toolbox:
Enthalpy is the measure of the total thermal energy in air (often called specific heat capacity.)
Energy content is expressed as energy per unit weight of air (Btu/lbair, J/kgair).
Air with the same amount of energy may either be drier hotter air (higher sensible heat) or cooler moister air (higher latent heat).
Moist air is a mixture of dry air and water vapor. In atmospheric air water vapor content varies from 0 to 3% by mass. The enthalpy of moist and humid air includes:
The enthalpy of the dry air – the sensible heat – and
The enthalpy of the evaporated water – the latent heat
Specific Enthalpy of Dry Air – Sensible Heat
Assuming constant pressure conditions the specific enthalpy of dry air can be expressed as:
ha = cpa where
cpa = specific heat capacity of air at constant pressure (kJ/kgC, kWs/kgK, Btu/lbF)
t = air temperature (C)
For air temperature between -100C and 100C the specific heat capacity can be set to
cpa = 1.006 (kJ/kgC)
Enthalpy of Moist Air
The enthalpy of humid air at 25C with specific moisture content x = 0.0203 kg/kg (saturation), can be calculated as:
h = (1.006 kJ/kgC) (25C) + (0.0203 kg/kg) [(1.84 kJ/kgC) (25C) + (2501 kJ/kg)]
= (25.15 kJ/kg) + [(0.93 kJ/kg) + (50.77 kJ/kg)]
= 76.9 (kJ/kg)
http://www.engineeringtoolbox.com/enthalpy-moist-air-d_683.html
The same calculation for moist air at 20C gives a heat capacity of 58.2, so the 5C increase requires 18.7 kj/kg for moist air vs. 5.0 kj/kg for dry air, or a ratio of 1:3.7. Similar ratios apply at all air temperatures above 0C. Subzero air, like that in the Arctic most of the year, shows little difference in heat content between dry or saturated, since cold air doesn’t hold much water vapor.
LikeLike
As regards the summary question of what may cause a certain “amplification” of temperature trends in the Arctic it seems to me – looking at it qualitatively – that
(a) The mass of atmosphere in the troposphere that is involved in a cooling or heating episode in the region is only HALF as great per square kilometer of area as further south – as the tropopause is so much lower. A certain amount of heat will go further therefore in raising temperatures in the lower atmosphere.
(b) The phenomenon of ‘cold waves’ whereby dry, cold air spills southwards and is replaced by (slightly) warmer, moister air involves a transfer of additional latent heat into the region which eventually manifests itself as sensible heat, so that the temperature does not immediately decline all the way back to “normal.”
Compare what is happening this year so far:
http://ocean.dmi.dk/arctic/meant80n.uk.php
LikeLike
Your source is indeed talking about making warm moist air from cold dry air, and getting in a muddle.
“Enthalpy is the measure of the total thermal [sic] energy in the air (often called specific [sic] heat capacity).”
is wrong.
“Enthalpy is the measure of the total internal [sic] energy in the air (often called total [sic] heat capacity).”
is right.
Thermal energy is the same as sensible heat.
Internal energy is the same as sensible heat + latent heat.
Specific heat capacity (at constant volume) is the amount of sensible heat input required to raise unit mass by unit temperature of a specific substance in a specific form.
Your source is calculating the amount of sensible heat that is absorbed while changing both the substance and the form (presumably there is some liquid water around which is imagined to be evaporated into the dry air) !
That is fine so long as he says and understands exactly what he is doing. It is not fine otherwise.
It still is a fact that to raise the temperature of a kilogram of already moist (defined as 3% water vapour) air from, say, 310 K to 311 K degree requires only about 3% more heat input than to raise a kilogram of dry air from 310 to 311 K. If one thinks that it takes 270% more heat input, then one is wrong.
LikeLike
Thanks Dave for clarifying. Point taken.
LikeLike
Somebody has “taken my point” ? Gosh, that has never happened before.
LikeLike