
H/T graeme for asking a good question.
This blog features a monthly update on ocean SST averages from HadSST3 (latest is Oceans Cool Off Previous 3 Years). Graeme added this comment:
I came across this today. Can you comment as your studies seem to show the reverse! Regards, Graeme Weber
https://www.carbonbrief.org/category/science/temperature/global-temperature
While thinking about a concise, yet complete response, I put together this post. This is how I see it, to the best of my knowledge.
The question could be paraphrased in these words: Why are there differences between various graphs that report changes in global temperatures?
The short answer is: The differences arise both from what is measured and how the measurements are processed.
For example, consider HadSST3 as one example and GISTEMP as another. All climate temperature products divide the earth surface into grid cells for analysis. This is necessary because a global average can be biased by some regions being much more heavily sampled, eg. North America or North Atlantic. HadSST takes in measurements only from cells containing ocean, while GISTEMP uses data files from NOAA GHCN v3 (meteorological stations), ERSST v5 (ocean areas), and SCAR (Antarctic stations).
Beyond this, HadSST3 is properly termed a temperature data product, while GISTEMP is a temperature reconstruction product. The distinction goes to how the product team deals with missing data. HadSST3 calculates averages each month from grid cells with sufficient samples of observations, and excludes cells with inadequate samples for the month.
GISTEMP estimates temperature values for cells lacking data by referring to cells that are observed sufficiently. The estimates are a best guess as to what temperatures would have been recorded had there been fully functional sensors operating. This process is called interpolation, resulting in a product combining observations with estimates, ie an admixture of data and guesses.
I rely on HadSST3 because I know their results are based upon observational data. I am doubtful of GISTEMP results because many studies, including some of my own, show that interpolation produces strange and unconvincing results which come to light when you look at changes in the local records themselves.
One disturbing thing is that GISTEMP keeps on changing the past, and always in the direction of adding warming. What you see today differs from yesterday, and tomorrow who knows?

Roger Andrews does a thorough job analyzing the effects of adjustments upon Surface Air Temperature (SAT) datasets. His article at Energy Matters is Adjusting Measurements to Match the Models – Part 1: Surface Air Temperatures.
Another thing is that temperature patterns are altered so that places that show cooling trends on their own are converted to warming after processing.

Figure 3: Warming vs. cooling at 86 South American stations before and after BEST homogeneity adjustments This shows results from BEST, another reconstruction product demonstrating how an entire continent is presented differently by means of processing.
Then there is the problem that more and more places are showing estimates rather than observations. Years ago, Dr. McKitrick noticed that the decreasing number of stations reporting coincided with the rising GMT reports last century. Below is his graph showing the correlation between Global Mean Temperature (Average T) and the number of stations included in the global database. Source: Ross McKitrick, U of Guelph

Currently it is clear that a great many places are estimated, and it is even the case that active station records are ignored in favor of estimates.
For these reasons I am skeptical of these land+ocean temperature reconstructions. HadSST3 deals with the ocean in a reasonable way, without inventing data.
When it comes to land surface stations, it is much more reasonable to compute the change derivative for each station (i.e. slope) and average the slopes as an indication of regional, national or global temperature change. This form of Temperature Trend Analysis deals with missing data in the most direct way: by putting unobserved months at a specific station on the trendline of the months that are observed at that station–no infilling, no homogenization.
Several of my studies using this approach are on this blog under the category Temperature Trend Analysis. A guideline to these resources is at Climate Compilation Part I Temperatures
The method of analysis is demonstrated by a post as Temperature Data Review Project-My Submission.which also confirms the problems noted above.
A peer-reviewed example of this way of analyzing climate temperature change is the paper Arctic temperature trends from the early nineteenth century to the present W. A. van Wijngaarden, Theoretical & Applied Climatology (2015) here
Is the globe warming or cooling?
Despite the difficulties depicting temperature changes noted above, we do observe periods of warming and cooling at different times and places. Interpreting those fluctuations is a matter of context. For example, consider GISTEMP estimated global warming in the context of the American experience of temperature change during a typical year.

Reblogged this on Climate Collections and commented:
Excellent post describing the credibility of temperature reconstructions.
LikeLike
Superb and clear explanation of the homogenisation (or fiddling), that goes on.the final graph should be news headlines, don’t panic!
LikeLike
Here’s another question for you: Why do we always see plots of temperature “anomalies”? An “anomaly” is a deviation from an accepted standard, norm, or ideal value. What is the Earth’s “ideal” temperature, and who got to decide on it?
LikeLike
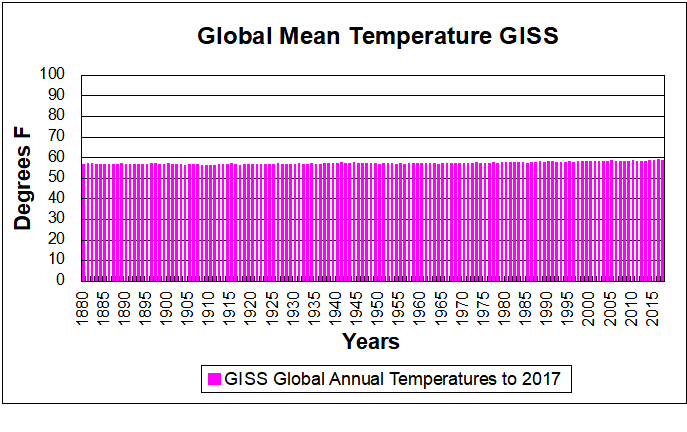
James, it is true that anomalies can be used to deceive or exaggerate. The GISS chart above was produced by taking GISS baseine 1950 to 1981 average 57.2F and adding it back to the anomalies, resulting in absolute temperatures.
These global analyses require consolidating changes in temperatures in various places where the absolute values differ with latitude and altitude, so simply averaging them won’t work. As I said in the article climatologists hit on anomalies as the way to deal with it, but consolidating trends would be more accurate IMO. After all, the objective is not to get an average planetary temperature (a fiction) but rather to understand the changes.
LikeLike
It does not take a conspiracy to systematically mess up data, and it does not take conspiratorial ideation to look at GISS and notice that puzzling things have been to the data. Nor is it conspiratorial to be dubious about the explanations offered by GISS explaining what was done to the data.
The interesting thing to me is what triggered the suspension of normal critical thinking skills by the climate faithful, as well as why the faithful are so unwilling (unable?) to discuss the concerns of skeptics in a mature rational fashion.
LikeLike
Reblogged this on WeatherAction News and commented:
A good primer on global temperature…which despite the sophistication is still very much back of the envelope.
LikeLike
Ron, many thanks for your efforts, they are both thought provoking and constructive.
I have also been watching trends, trying to hound down the surface and trop lag, enough later maybe. At present have you seen the latest BOM Enso Sub Surface anomolies? They are quite remarkable, so much so that at present I favour cock up, only time will tell! But if the whole of the Pacific at 150m has cooled that much in a month and a day then yikes!
http://www.bom.gov.au/oceanography/oceantemp/pastanal.shtml
Once again thanks
LikeLike
Thanks green sand for the kind words, and for linking to a resource new to me. I think I see how the images work, and they are interesting. Do you know if there is an associated dataset (numbers)?
LikeLike