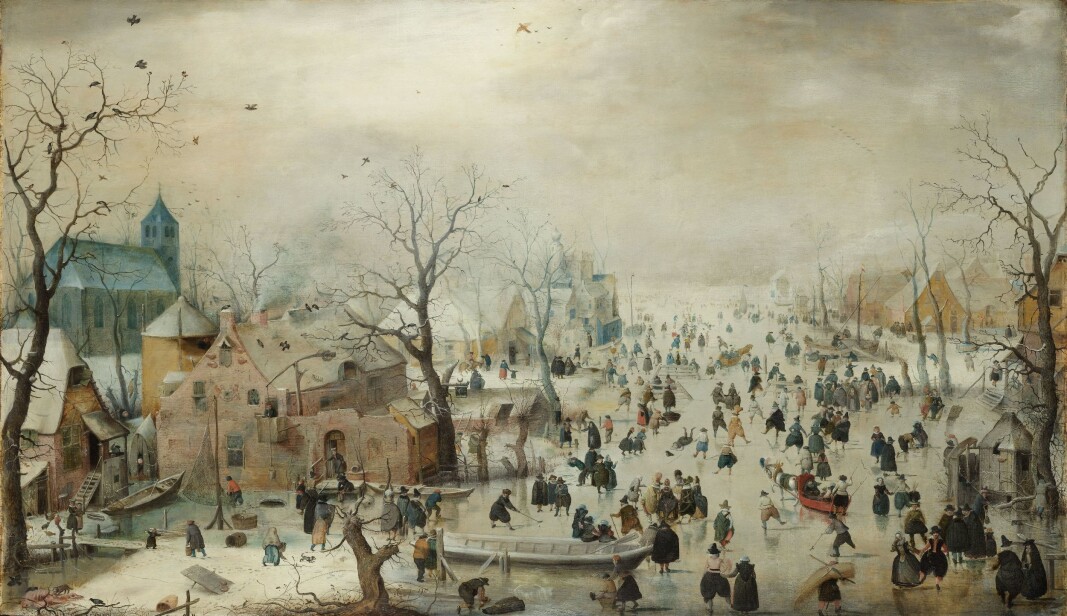
The Dutch artist Hendrick Avercamp painted winter activity on the ice during the first half of the 17th century, when it was quite cold in Central and Northern Europe. (Image: Henrik Avercamp / Wikimedia Commons)
Elise Kjørstad writes at Science Norway What actually started the Little Ice Age? Excerpts in italics with my bolds.
It all may have started with sea ice, and the changes may have happened all by themselves without the influence of volcanoes or the Sun, researchers behind a new study say.
The ninth century seems to have experienced a warmer climate, which has been called the Medieval Warm Period.
But from the 14th century things were different. It rained “without stopping” in 1315, and grain didn’t ripen. The situation was much the same the following year. Later in the 14th century there were several episodes of wild weather and cold periods.
The Little Ice Age can be divided into two phases, according to an article in The New Yorker. It began with a cooling period in 1300 – 1400. The coldest period was from the end of the 1500s to 1850.
This cooling caused glaciers to expand in Scandinavia, the Alps, in Iceland, Alaska, China, in the southern Andes and in New Zealand.
Generally speaking, the Little Ice Age is said to have begun because of an increase in volcanism and reduced activity of the Sun.
“The timing agrees quite well with the great eruptions from the 13th century. So there is good empirical evidence that this could be true,” said Martin Miles, a researcher at NORCE Norwegian Research Centre, and the Bjerknes Centre for Climate Research in Bergen, and at the University of Colorado at Boulder in the USA.
But in a new study, Miles and his colleagues have looked at another possibility.
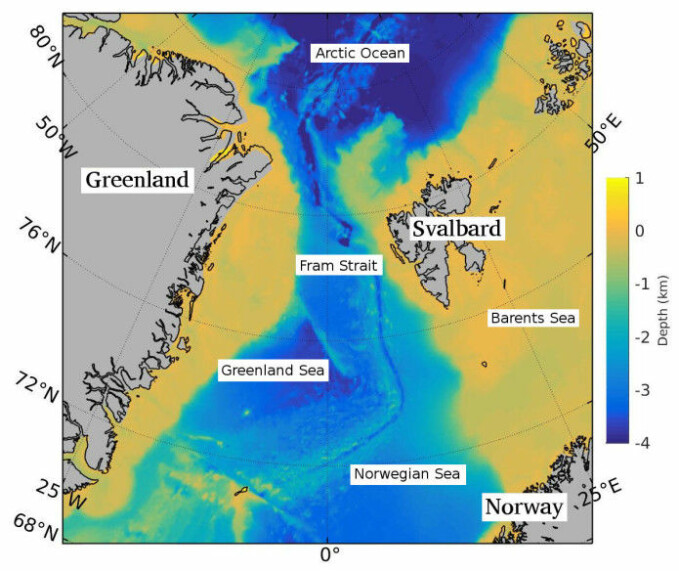
The strait between Greenland and Svalbard is the only deep connection between the Arctic Ocean and the world’s oceans. (Image: Bdushaw / CC BY-SA 3.0 / Wikimedia Commons)
Lots of ice on the go
In their new study, Miles and his colleagues looked at the transport of sea ice from the Arctic over a 1400 year period.
They compiled data from seabed samples from areas outside Greenland, the eastern part of the Fram Strait, the Greenland Sea and off Iceland. The samples contained small fossils that give researchers information about sea temperatures and loose material that sea ice had carried with it.
In several of these areas, ice will only be found if there is an especially large amount flowing out of the Arctic Ocean. This is particularly true during cold periods and when there is also a lot of sea ice formation.
“We discovered that an unusually large amount of sea ice flowed out of the Arctic Ocean from the beginning of the 14th century. It is very interesting, and the biggest event we found during the last 1400 years,” says Miles.

Fig. 2 Arctic sea ice and polar waters from Fram Strait to the Greenland Sea. Sea-ice and ocean reconstructions from marine sediment cores. (A) Eastern Fram Strait, based on IP25 (21). (B) Eastern Fram Strait, based on IRD (22). (C) Northeast Greenland shelf, based on IP25 (21). (D) Northeast Greenland shelf, based on benthic foraminifera (23). (E) Central Greenland Sea, based on IRD (24). Blue shading represents the period of increased sea ice spanning the 1300s CE.
Can’t explain everything
Miles says sea ice may have affected the climate in Europe in the 14th century in this way.
The ice that melts and turns into fresh water can affect ocean currents, which in turn affect the atmosphere and climate, he says.
“Ocean currents are very important for transporting heat to Europe. If the currents weaken a little, it will be much colder than usual,” he said.
Sea ice is not only a reaction to climate change, but can also trigger climate change, Miles says.
The paper is Evidence for extreme export of Arctic sea ice leading the abrupt onset of the Little Ice Age Martin W. Miles et. al. (2020).
Abstract
Arctic sea ice affects climate on seasonal to decadal time scales, and models suggest that sea ice is essential for longer anomalies such as the Little Ice Age. However, empirical evidence is fragmentary. Here, we reconstruct sea ice exported from the Arctic Ocean over the past 1400 years, using a spatial network of proxy records. We find robust evidence for extreme export of sea ice commencing abruptly around 1300 CE and terminating in the late 1300s. The exceptional magnitude and duration of this “Great Sea-Ice Anomaly” was previously unknown. The pulse of ice along East Greenland resulted in downstream increases in polar waters and ocean stratification, culminating ~1400 CE and sustained during subsequent centuries. While consistent with external forcing theories, the onset and development are notably similar to modeled spontaneous abrupt cooling enhanced by sea-ice feedbacks. These results provide evidence that marked climate changes may not require an external trigger.

Fig. 3 Arctic sea ice and polar waters downstream in the subarctic North Atlantic. Sea-ice and ocean reconstructions from marine sediment cores: (A) Nansen Fjord, East Greenland, based on foraminifera (25), inverted scale. (B) North Iceland shelf, sea ice based on IP25 (13). (C) North Iceland shelf sea surface temperatures (SSTs) based on alkenones (29), inverted scale. (D) South Greenland Fjord, based on diatoms (31). (E) West Greenland shelf, based on diatoms, five-point running average (33). Blue shading represents the period of increased polar waters and sea ice spanning the 1300s CE.
Background Post with Supporting Information
The Climate System is Self-Oscillating: Sea Ice Proves It.
Scientists have studied the Arctic for a long time at the prestigious AARI: Arctic and Antarctic Research Institute St. Petersburg, Russia. V. F. Zakharov has published a complete description supported by research findings under this title: Sea Ice In the Climate System A Russian View (here)
Below I provide excerpts from this extensive analysis to form a synopsis of their view: Component parts of the climate system interact so that Arctic Sea Ice varies within a range constrained by those internal forces.

Self-Oscillating Sea Ice System
The most probable regulator of the physical geographical process can be found from analysis of the relationships between the components of the climate system. It is not necessary to investigate the cause-effect relationships between all these components in succession. It is sufficient to choose one of them, let us say sea ice, and consider its direct interaction with the atmosphere and the ocean – in the climate system and the significance of internal mechanisms in the natural process. Pg 1
The idea that the ice area growth at present can be achieved by changes in only the haline structure of the upper ocean layer, as a result of surface Arctic water overflowing onto warmer but more saline water, is supported both by calculations and empirical data. Pg. 46
First of all, it should be noted that the signs of temperature and salinity anomalies coincide in most cases: a decreased salinity corresponds to enhanced temperature and vice versa. Such similarity in the change of these parameters is impossible to explain from the point of view of the governing role of thermal conditions in the atmosphere with regard to the ocean, as the air temperature increase and decrease can result only in the change of the thermal state of sea surface layer not its salinity. Pgs. 48-49
Thus, the presented facts suggest that the most significant cause of changes in the ice cover extent are the changes in the vertical water structure in the upper ocean layer, rather than the changes of thermal conditions in the atmosphere. These changes are induced by fluctuations in the horizontal dimensions of the halocline, which are governed in turn by the expansion or reduction of the surface Arctic water mass. Pg. 49
It follows from the above that, under present day conditions, the changes in the area of the Arctic sea ice during the colder period of the year can be induced only by the change in the haline structure of the upper ocean layer. Indirectly, this change will also affect the thermal state of the atmosphere. Pg. 56
It is important to note that the ice effect on the atmosphere is not limited to the thermal effect. That it can produce a significant effect on atmospheric circulation is already evident from the fact that the Arctic anticyclone, considered by Viese [13] as a regulator of atmospheric processes in the Northern polar region, could form as a pressure formation only in the conditions of the ice regime in the Arctic. Pg. 56
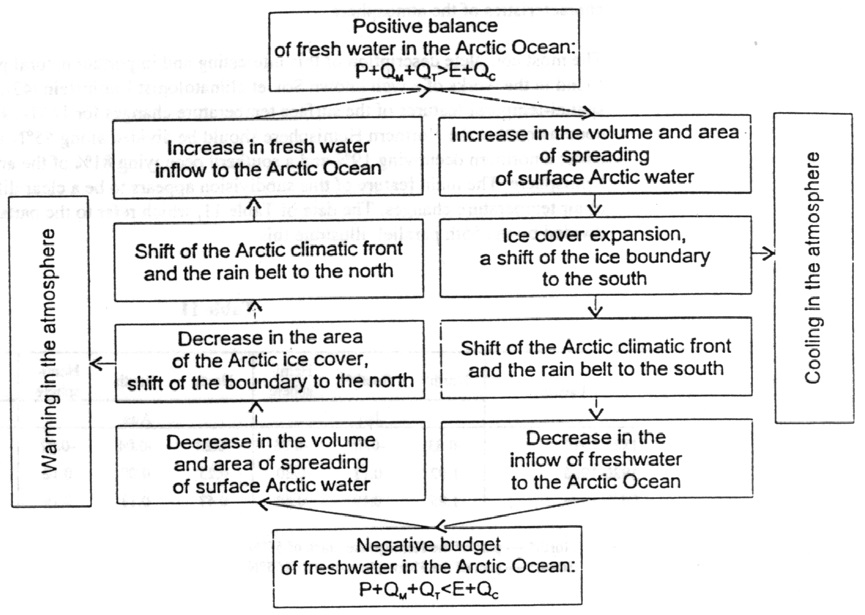
Zakharov fig.24
An analysis of cause-effect relationships does not leave any doubt in what direction and in what order the climate signal propagates in the atmosphere-ocean-polar ice system. This is not the direction and order usually assumed to cause present climate change. When it has become clear that the changes in the ocean, caused by disturbances of its freshwater balance, precede changes in the extent of sea ice, and the latter the changes in the atmosphere, then there was nothing left but for us to acknowledge self oscillation to be the most probable explanation for the development of the natural process. Pg. 58
Maybe the most convincing evidence of the Arctic sea ice stability is its preservation during the last 700,000 years despite vast glacial- interglacial fluctuations. The surface air temperature in the Arctic during the interglacial periods was higher by several degrees than present day temperatures. Pg. 44
Conclusion:
The remarkable stability of our planetary climate system derives from feedbacks between internal parts of the system, providing the oscillations we observe as natural variability. Arctic Sea Ice is a prime example. Bottom line: A bit less ice in the Arctic indicates that we are not yet slipping into an ice age, little or otherwise.
See also The Great Arctic Ice Exchange
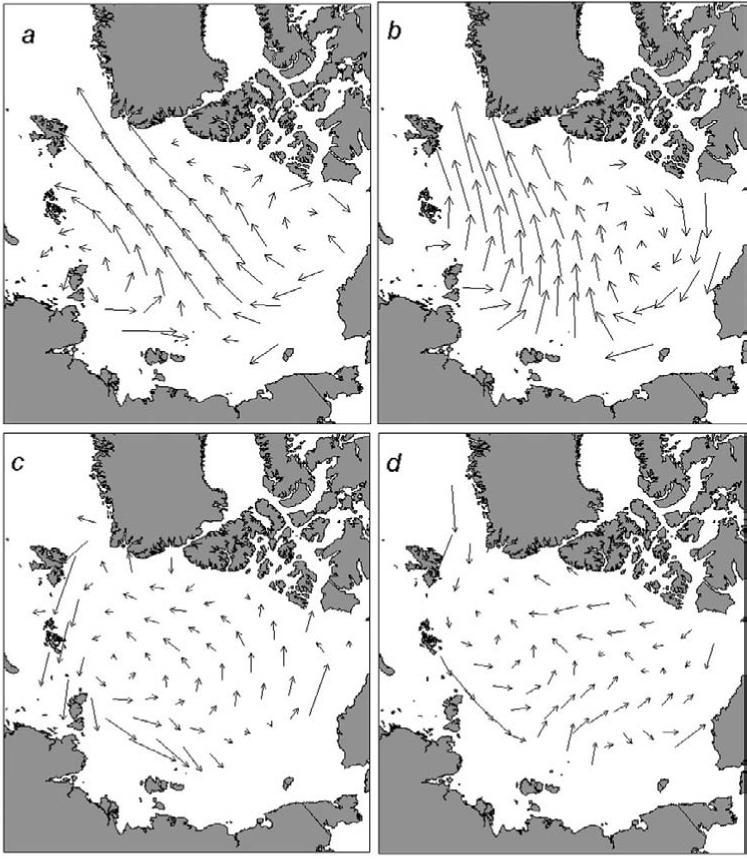
Figure 4.12. Mean resulting ice-drift pattern for summer (a) and winter (b) during the warm epoch and the difference between ice-drift vectors during the warm and cold epochs for summer (c) and winter (d).


Reblogged this on Climate Collections.
LikeLike
These results provide evidence that marked climate changes may not require an external trigger.
Miles missed by a mile because he didn’t include solar activity or ENSO in his study.
https://i.postimg.cc/hjkKvS21/Lo-TSI-Hard-Winters.jpg << from my 2018 AGU poster
The 2020/21 winter is following the template I established in my 2018 AGU poster, “Extreme Weather Events and Climate Extremes are Limited by the Duration of Solar Cycle Irradiance Extremes”.
– Bob Weber
LikeLiked by 1 person
Thanks Bob. How are our present lesser ice extents related to the presently quiet sun?
LikeLike
Ron, my first link caption should read “Sea Ice peaks generally occur at solar minima (arrows) & maxima (circles), from either long duration low TSI or low TSI from large sunspots groups”, and the Wu etal solar reconstruction is the ten-year average sunspot number. The 2010-19 v2 SN average was 53.9.
Antarctic sea ice is growing now while the Arctic sea ice isn’t at the moment. The ocean open water and temperature distribution profiles ensure asymmetrical asynchronous freezing/melting. El Nino warming affects the SH less quickly and effectively as a result.
The recent positive ENSO phase earlier during this solar minimum sent ice-melting warm waters north. HadSST3 finally fell last month indicating the effect of the 2018/19 positive ENSO conditions on the NH sea ice is essentially over, so I expect net NH ice gain this winter until more positive ENSO conditions prevail, which I contend won’t come about without more solar activity.
The last time Arctic sea ice really grew was during the early 1900s when the portion of the ocean warmer than 25.6C (my CO2 outgassing threshold) was 50% less than in 2019, which coincided with the Centennial Minimum in solar activity.
LikeLike
Thanks for elaborating Bob. It also seems to me that changes in solar output as an input to our climate system have to be integrated over time. So effects only appear with accumulation of a regime shift. I took Miles to be saying that Sea Ice extents are not the only factor, but have been underappreciated.
LikeLiked by 1 person
…changes in solar output as an input to our climate system have to be integrated over time
You’ve got the right idea Ron. The climate, ie 30y HadSST3, is a integrated function of 11 solar cycles.
LikeLiked by 1 person
Thanks for your interesting comments, that are very similar to my understanding too that solar activity is the main driver of Earth’s climate.
I believe the next 2-3 solar cycles could be crucial for the climate if they confirm the predictions of a very low solar output, similar to the Maunder period. I’m convinced that if this happens, it could bring the end of the present interglacial – Holocene. Do you think this is possible?
I believe a possible trigger for this event could be the following: a combination of negative anomalies of AMO, a return to negative of the PDO leading to an expansion of the Arctic ice, and the continuation of the expansion of the Antarctic ice – and the persistent low anomalies of southern oceans in recent years.
All these factors combines could cause, in my opinion, the end of the Holocene.
LikeLike
Fran, I think that we are due for a cooling off, but not ready to sound alarms about the end of the Holocene. I have been watching the AMO, but it has still not produced a shift into its negative phase. As you say, the PDO is also a factor, and the quiet sun as well. It’s seems to me that presently the oceans have been releasing heat into the atmosphere and keeping us warm the last five years. How long can that continue, I can not say.
LikeLiked by 1 person
Thanks Ron, I am a little confused too about the abnormal heating of the N Pacific, but I’ve just discovered the following data of TSI [seems legit], following the hint of Bob’s post, and found that the recent TSI has had an *increasing* trend despite the low SSN.
The TSI of the beginning of the XX century was much lower [relatively speaking] than the present,
LikeLike
Original site address for the TSI graph,
https://lasp.colorado.edu/home/sorce/data/tsi-data/
LikeLike
Your previous post from 2016 seems to agree with the TSI data,
https://wordpress.com/read/blogs/87268333/posts/3346
LikeLike
Thanks Fran. I’ve had the privilege of meeting most of the scientists involved in TSI and hearing of their work firsthand at the last two LASP sun-climate symposiums to appreciate the difficulties in establishing the true TSI record.
The historical TSI reconstruction you presented by Dudok de Wit et al 2017 is by now considered obsolete by most in the field, I think too by T. Dudok de Wit. Judith Lean, Odele Coddington, and Greg Kopp etal (LASP) have updated their historical TSI model this year (in review I believe) as have the European TSI group (already published) that flattens the TSI record more to account for Leif Svalgaard’s etal work on SILSO v2 SN and his separate work on the solar minimum floor level of activity that he found varies much less. There may be one more round of reconstructions within the next 5 years, and then the TSI industry will all be mostly on the same page. Radiometers are difficult enough to make that successive instrument data have to be daisy-chained properly with offsets and other methods to obtain the best record, not always an easy task – PMOD TSI was proxy-tuned which isn’t accurate enough.
The updated version(s) reduces the solar minimum TSI range since 1600 of almost 1W/m^2 by over half. That means the upward trend in at least the floor level will be less than shown in de Wit’s 2017 plot. The peaks from high SN also have a non-linear effect that isn’t readlly testable with the latest instruments unless there’s very high SN again, such as in SC19, the most active solar cycle in 400 years. That will be the last hurdle for TSI research that may not happen for who knows how long, and until then the very highest TSI limits can only be approximated.
Below is a 2018 model comparison of Svalgaard’s model, Lean’s 2018 model, and my empirically-based model based on PMOD (also needing an update too using RMIB data) followed by my application of my model to the climate:
The NW Pacific regularly becomes a hotspot after positive ENSO conditions, such as in 2018/19 right into early 2020. The ‘blob’ as it was called during 2014-2016 was a result of high solar maximum TSI-driven positive ENSO.
LikeLike