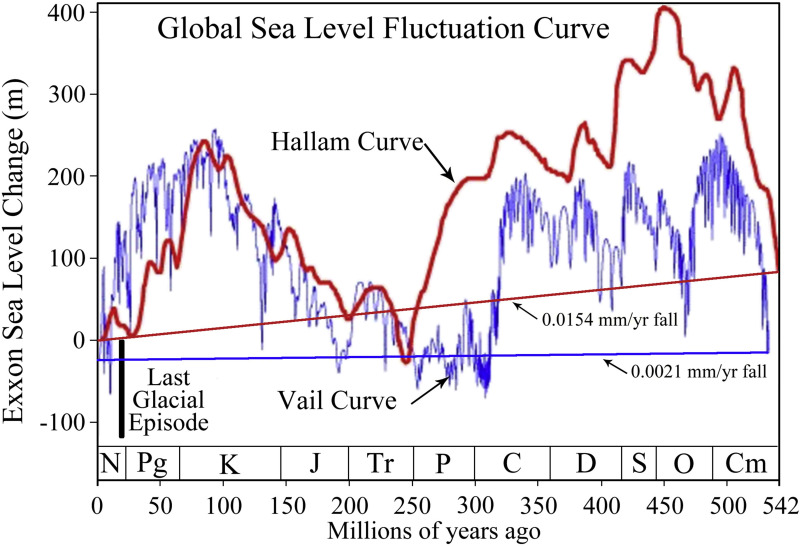
1-s2-0-s1674987118300446-gr12 Posted on March 26, 2018 by Ron Clutz Trackbacks are closed, but you can post a comment. Figure 12. Vail and Hallam curves of global paleo sea level fluctuations from the last 542 million years (Copied and redrawn from https://en.wikipedia.org/wiki/Sea-level_curve).