On the Motion of the Ocean

The image shows what is known about how ocean currents flow under the influence of the earth’s rotation. A recent article adds another level of complexity and insight by examining smaller scale effects. From the American Institute of Physics Researchers challenge our assumptions on the effects of planetary rotation Excerpts in italics with my bolds.

Coriolis effect can influence eddies in wakes as small as 10 meters

The Coriolis effect impacts global patterns and currents, and its magnitude, relative to the magnitude of inertial forces, is expressed by the Rossby number. For over 100 years, scientists have believed that the higher this number, the less likely Coriolis effect influences oceanic or atmospheric events. Recently, however, researchers found that smaller ocean disturbances with high Rossby numbers are influenced by the Coriolis effect. Their discovery challenges assumptions of theoretical oceanography and geophysical fluid dynamics.

A 2-D image of the velocity in an internal jet with the Rossby number of 100 that shows how planetary rotation leads to the destabilization and dispersion of an initially coherent flow pattern. Credit: Timour Radko and David Lorfeld

Earth’s rotation causes the Coriolis effect, which deflects massive air and water flows toward the right in the Northern Hemisphere and toward the left in the Southern Hemisphere. This phenomenon greatly impacts global wind patterns and ocean currents, and is only significant for large-scale and long-duration geophysical phenomena such as hurricanes. The magnitude of the Coriolis effect, relative to the magnitude of inertial forces, is expressed by the Rossby number. For over 100 years, scientists have believed that the higher this number, the less likely Coriolis effect influences oceanic or atmospheric events.

Recently, researchers at the Naval Postgraduate School in California found that even smaller ocean disturbances with high Rossby numbers, like vortices within submarine wakes, are influenced by the Coriolis effect. Their discovery challenges assumptions at the very foundation of theoretical oceanography and geophysical fluid dynamics. The team reports their findings in Physics of Fluids, from AIP Publishing.

“We have discovered some major — and largely overlooked — phenomena in fundamental fluid dynamics that pertain to the way the Earth’s rotation influences various geophysical flows,” Timour Radko, an oceanography professor and author on the paper, said.

Radko and Lt. Cmdr. David Lorfeld originally focused on developing novel submarine detection systems. They approached this issue by investigating pancake vortices, or flattened, elongated mini-eddies located in the wakes of submerged vehicles. Eddies are caused by swirling water and a reverse current from waterflow turbulence.

Last year, a team led by Radko published a paper in the same AIP journal on the rotational control of pancake vortices, the first paper that challenged the famous “Rossby rule.” In this most recent paper, the researchers showed, through numerical simulations, that internal jets of the wake can be directly controlled by rotation. They also demonstrated that the evolution of a disorganized fine-scale eddy field is determined by planetary rotation.

“Here is where our discovery could be critical,” Radko said. “We find that cyclones persist, but that anticyclones unravel relatively quickly. If the anticyclones in the wake are as strong as the cyclones, this means that the wake is fresh — the enemy passed through not too long ago. If the cyclones are much stronger than the anticyclones, then the sub is probably long gone.”

The algorithm that the researchers developed is based on the dissimilar evolution of cyclones and anticyclones, which is a consequence of planetary rotation. “Therefore,” Radko concluded, “such effects must be considered in the numerical and theoretical models of finescale oceanic processes in the range of 10-100 meters.”

The computer model is detailed enough to resolve eddies that are important for ocean circulation. The triangle-shaped island of Newfoundland, center, is at the eastern edge of the study area, the mouth of the Gulf of St. Lawrence. This graphic shows oxygen at the surface, where red shows more oxygen. Credit: Mariona Claret/University of Washington

Background:  Ocean Physics in a Cup of Coffee


How to Test an Accusation

The Senate Judiciary committee is meeting today and the written testimonies of Dr. Ford and Judge Kavanaugh are available. The challenge for senators and everyone else is how to judge the validity of the sexual assault claim. Normally an accusation is supported by evidence such as other witnesses before it is given legal consideration. But this is a he said, she said situation.

We know from scientific studies that our memories are untrustworthy the further in the past are the events being recalled. Cognitive experts say that a core remembrance, usually laden with emotion, is elaborated with details invented by our brains to fill in the gaps for a complete story.  An accuser can bear truthful witness to a false memory, and thereby belie the facts. So how to sort out how much is what happened and how much is imagination?

Adam Mill is an employment lawyer who has experience with many such cases and writes in the Federalist 10 Red Flags About Sexual Assault Claims, From An Employment Lawyer

It’s not nice or politically correct to say, but people do sometimes lie to get money, revenge, power, attention, or political advantage. False allegations of assault have been documented.

I know it’s a very unfashionable to advocate on behalf of the presumption of innocence, and I am often reminded of how insensitive and outdated the principle is in today’s climate.

Of course, courtesy to the alleged victim is absolutely essential to be effective. To do otherwise is completely counterproductive and quickly turns the focus from the facts to the conduct within the inquiry. So I go to great pains to make my questions respectful.

When the complaint is “he said/she said,” we should not helplessly acquiesce to coin-flip justice that picks winners and losers based upon the identity politics profile of the accused and accuser. Experience with a career’s worth of complaints in hearings, depositions, and negotiations has taught me some tells, red flags that warn that an innocent person stands accused.

Without naming any particular accusation, I offer these factors for consideration to the fair-minded who remain open to the possibility that guilt or innocence is not simply a question of politics. I also remind the reader that politicizing these accusations have allowed men like Harvey Weinstein, Al Franken, Matt Lauer, Les Moonves, Bill Clinton, and Keith Ellison to escape accountability. Nobody seems to care if they walk the walk so long as they talk the talk.

1. The accuser uses the press instead of the process.
Every company has a slightly different process for harassment and assault complaints. Often it begins with a neutral investigator being assigned to interview the accuser first, then potential corroborating witnesses. When an accuser is eager to share with the media but reluctant to meet with an investigator, it’s a flag.

2. The accuser times releasing the accusation for an advantage.
For example, when the accuser holds the allegation until an adverse performance rating of the accuser is imminent, or serious misconduct by the accuser is suddenly discovered, or the accused is a rival for a promotion or a raise, or the accused’s success will block an accuser’s political objective. It’s a flag when the accusation is held like a trump card until an opportunity arises to leverage the accusation.

3. The accuser attacks the process instead of participating.
The few times I’ve been attacked for “harassing” the victim, it has always followed an otherwise innocuous question about the accusation, such as: Where, when, how, why, what happened? I don’t argue with accusers, I just ask them to explain the allegation. If I’m attacked for otherwise neutral questions, it’s a red flag.

4. When the accused’s opportunity to mount a defense is delegitimized.
The Duke Lacrosse coach was fired just for saying his players were innocent. When the players dared to protest their innocence, the prosecutor painted their stories in the press as “uncooperative.” If either the accused or the accused’s supporters are attacked for just for failing to agree with the accusation, it’s a red flag.

5. The accuser seeks to force the accused to defend himself or herself before committing to a final version.
Unfortunately, this has become the preferred approach of the kangaroo courts on college campuses. It’s completely unfair because it deprives the accused of the opportunity to mount an effective defense. When the accuser demands the accused speak first, it is a strong indication that the accuser wants the opportunity to fill in the details of the accusation to counter any defense or alibi the accused might offer. It’s a red flag.

6. The accused makes a strong and unequivocal denial.
In most cases, there’s some kernel of truth to even the most exaggerated claims. When the accused reacts with a dissembling explanation full of alternatives and rationalizations, I tend to find the accuser more credible. Rarely, however, the accused reacts with a full-throated and adamant denial. When it happens, it’s a red flag that the accusation might have problems.

7. The accuser makes unusual demands to modify or control the process.
It’s a flag when the accuser demands a new investigator or judge without having a substantial basis for challenging the impartiality of the process that’s already in place.

8. When the accuser’s ability to identify the accused has not been properly explained.
In the Duke lacrosse case, the accuser was shown a lineup of photos of potential attackers. Every photo was of a member of the team. None were of people known to be innocent. It’s a red flag when an identification is made only after the accused appears in media and the accuser has not seen the accused for a number of years or was otherwise in regular contact with the accused.

9. When witnesses don’t corroborate.
10. When corroborating witnesses simply repeat the accusation of the accuser but don’t have fresh information.
It is now clear that accusations of sexual misconduct will forever be a tool to change results in elections and Supreme Court nominations. It’s disappointing to see so many abandon the accused to join the stampede of a mob that punishes any who ask legitimate questions about accusations.

These accusations destroy the lives of the accused, often men, and bring devastation to the women who love and support them. Some of the falsely accused commit suicide. When the mob attacks legitimate inquiry into the accusation, it’s a sure sign that the mob isn’t confident about the truth of the allegation. Rather than shrink in fear when attacked, we should take it as a sign that there is a risk that the accused is innocent, and the questions need to keep coming.

Adam Mill works in Kansas City, Missouri as an attorney specializing in labor and employment and public administration law. He frequently posts to millstreetgazette.blogspot.com. Adam graduated from the University of Kansas and has been admitted to practice in Kansas and Missouri.

Dr. Elizabeth Loftus concluded in one TED talk:

If I’ve learned anything from my decades working on these problems, it’s this: Just because somebody tells you something and they say it with lots of confidence, detail, and emotion does not mean that it really happened. We can’t reliably distinguish true memories from false memories; we need independent corroboration. Such a discovery has made me more tolerant of friends and family who misremember. Such a discovery might have saved Steve Titus. We should all keep in mind that memory, like liberty, is a fragile thing.


Honey, I Made the Earth Wobble! Not.


Image is from Honey, I Shrunk the Kids, a 1989 American science fiction family film produced by Walt Disney Pictures.

Repeated robotically by alarmist websites, this week’s climate scare says that burning fossil fuels is causing the earth to wobble in its spin.

Earth is Wobbling and Climate Change is to Blame Newsweek

Humans Are Causing Earth to Wobble Popular Mechanics

Human-Driven Climate Change Is Literally Making Earth ‘Wobble’ Motherboard

Earth’s rotation wobbles. NASA says humans partly to blame. Big Think

Earth’s Axis Is Drifting Inches Every Year In Part Because Of Human-Driven Climate Change IFLScience

Planet Earth Wobbles As It Spins, and Now Scientists Know Why Live Science  The case as made in the Live Science article,

Since 1899, the Earth’s axis of spin has shifted about 34 feet (10.5 meters). Now, research quantifies the reasons why and finds that a third is due to melting ice and rising sea levels, particularly in Greenland — placing the blame on the doorstep of anthropogenic climate change.

Another third of the wobble is due to land masses expanding upward as the glaciers retreat and lighten their load. The final portion is the fault of the slow churn of the mantle, the viscous middle layer of the planet.

Earth wobbles irregularly over time, which means it does not always spin on an axis running through its poles. Its axis has been drifting towards North America during most of the last century (green arrow). That direction has changed dramatically due to changes in water mass on Earth. (Image: NASA/JPS-Caltech)

After a little investigation, there are several reasons not to be alarmed about this finding.

1.The Wobble is ancient.

Scientists have long known that the distribution of mass around the Earth determines its spin, much like how the shape and weight distribution of a spinning top determines how it moves. Also, Earth’s spin isn’t perfectly even, as scientists know thanks to slight wiggles in the movements of the stars across the night sky that have been recorded for thousands of years, said Erik Ivins, a study co-author and a senior research scientist at JPL. Since the 1990s, space-based measurements have also confirmed that the Earth’s axis of rotation drifts by a few centimeters a year, generally toward Hudson Bay in northeastern Canada.

Researchers knew that a proportion of this wobble was caused by glacial isostatic adjustment, an ongoing process since the end of the last ice age 16,000 years ago. As the glaciers retreat, they relieve the land underneath of their mass. Gradually, over thousands of years, the land responds to this relief by rising like bread dough. (In some places on the edges of the ancient ice sheets, the land might also collapse because the ice had forced it to bulge upward.)

2. Wobbling results from multiple causes.

“We have provided evidence for more than one single process that is the key driver” for altering the Earth’s axis, said Surendra Adhikari, an Earth system scientist at NASA’s Jet Propulsion Laboratory in Pasadena, California, and a lead researcher on the new study.

But in the new research, published in the November issue of the journal Earth and Planetary Science Letters, Adhikari and his colleagues found that glacial isostatic adjustment was only responsible for about 1.3 inches (3.5 centimeters) of axis wobble per year. That was only about a third of the wobble — 4 inches (10.5 cm) — observed each year over the 20th century.

To fill in the gap, the research team built a computer model of the physics of Earth’s spin, feeding in data about changes in the balance of land-based ice and ocean waters over the 20th century. The researchers also accounted for other shifts in land and water, such as groundwater depletion and the building of artificial reservoirs, all part of humanity’s terraforming of the planet.

The results revealed that these environmental processes cause another 1.7 inches (4.3 cm) of wobble each year. The melting of the Greenland ice sheet was a particularly important contributor, the researchers found. That’s because Greenland has released a large amount of water that was once locked up on land into the oceans, where its mass has been redistributed, Ivins told Live Science. Mountain glaciers and small ice caps elsewhere have also contributed to sea-level rise, he said; but they aren’t as concentrated, and their effects on the Earth’s rotation often cancel each other out.

3. The mantle itself is always moving.

The glaciers and the ice melt still left a third of the wobble unaccounted for, so Adhikari and his team looked inward. The Earth’s mantle is not static, he said, but moves by the process of convection: Hotter material from closer to the core rises and cooler material sinks in a cycle of vertical motion. By including convection in the model of Earth’s wobble, the researchers had accounted for the last third of the changes in the spin over the 20th century.

4. The Wobble is not menacing.

It’s important to realize that this wobble isn’t the prelude to any sort of environmental calamity, Ivins and Adhikari said. It doesn’t affect agriculture or climate in and of itself, and any small impact on navigational equipment is easy to correct for.

“The amount [of drift] is not a huge amount,” Adhikari said.

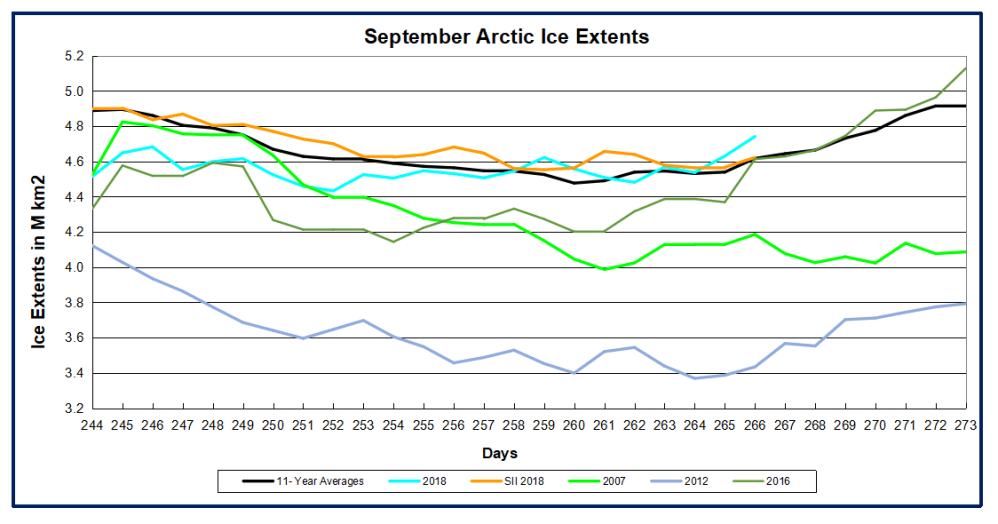
5. Greenland ice sheet is affected by many natural factors.

A recent paper looked into unusually extensive melting in 2012. The implication of nonradiative energy fluxes dominating Greenland ice sheet exceptional ablation area surface melt in 2012 by Robert S. Fausto et al. Excerpts in italics with my bolds.

The surface energy budget consists of nonradiative (sensible, latent, rain, and subsurface) and radiative (shortwave and longwave) energy fluxes. Distinguishing the contribution of nonradiative and radiative energy fluxes in melt over the Greenland ice sheet is important to understand ice sheet surface climate sensitivity, especially in the ablation area, where the majority of melt occurs [e.g., Fausto et al., 2012a].

Ablation varies with elevation, but there are also considerable latitudinal differences as the Greenland ice sheet stretches from the upper midlatitudes (~60°N) to the high Arctic (~82°N). The largest total observed ice ablation in 2012 was 8.5 m ice eq. at QAS_L, which was 9% less than the 2010 value. This interannual variability may be attributed to larger winter snow accumulation in 2012, which maintained high surface albedo by delaying bare ice exposure during the melt season.

Given that absorbed solar radiation is the primary energy source of melt on an annual basis, the influence of intra‐annual and interannual variability in air temperature and other variables on ablation is of secondary importance [Van den Broeke et al., 2011]. Yet during the two melt episodes we focus on, which together resulted in ~14% of annual ice ablation (Table 1), the nonradiative (sensible, latent, rain, and subsurface) energy fluxes were the primary control of melt with a contribution of 53 ± 16% and 66 ± 8%, respectively, averaged for the eight western AWSs for episodes E1 and E2, respectively (Tables 1).

During the two episodes, the large longitudinal contrast in nonradiative energy fluxes contribution to surface melt stem from anomalously warm and moist southern air flow being transferred onto the western ice sheet by atmospheric flow (Figure 2b) [Neff et al., 2014; Bonne et al., 2015], while east Greenland was dominated by stable weather with relatively low cloud cover and high solar radiation (Figure 2c) [Fettweis et al., 2013; Tedesco et al., 2013].

More broadly, data from the two episodes presented here demonstrate that exceptional melt can occur during periods characterized by cloudy skies and transient atmospheric flow, with melt being dominated by nonradiative, rather than radiative fluxes in the ablation area.

Conclusions

We find that year 2012 Greenland ice sheet melt was marked not only by widespread interior surface melting [Nghiem et al., 2012] but also by an increased nonradiative (sensible, latent, and rain) energy flux contributing to melt in the ablation area of the southern and western ice sheet. Latent and sensible energy advection governed two exceptional melt episodes in July 2012 [Neff et al., 2014]. The two episodes which lasted just ~6% of the ablation period in June–August were responsible for ~14% of the annual 2012 ablation average for all PROMICE measurement sites (Table 1). At all PROMICE sites during the two exceptional melt episodes the combined sensible, latent, rain, and subsurface energy fluxes (i.e., nonradiative energy fluxes) comprised 60% of the melt energy on average (Figure 1 and Table S1).

Summary

Earth has wobbled a bit in its rotation since the beginning, and continues to do so. The movement is not large or menacing. The three causes appear to be shifting material in the mantle, land rebounding when glaciers retreat, and changes in Greenland ice sheet balance.

The latter is attributed to human activity, even though major melting events result primarily from nonradiative factors: sensible, latent, rain and subsurface energy fluxes. If you buy the notion that burning fossil fuels causes Greenland ice sheet to melt, then please contact me about my bridge in Brooklyn that I am selling.

Ethane is Transforming World Energy

Many of us know of methane (CH4, AKA natural gas), but overlooked in the current drilling revolution is ethane (C2H6) which is quietly transforming the world of energy. The story comes appropriately from the Houston Chronicle (H/T Master Resource). Jordan Blum writes How the ethane molecule changed the Gulf Coast — and the world Excerpts in italics with my bolds.

Overview

Ethane is simply described as C2H6. But that molecule, a byproduct of natural gas, has triggered a petrochemical boom that is reshaping the Gulf Coast, the energy industry that lives here, and global markets for plastics, resins and other petrochemicals.

We followed that molecule from a Texas shale field where it is found, to the petrochemical plant where it is transformed into ethylene, the basic building block of most plastics, and to the Port of Houston, where it is shipped to Asia and other emerging consumer markets.

The impact of ethane is perhaps the most remarkable development in the remarkable story of the shale revolution. Less than three years ago, ethane was a largely unwanted byproduct of oil and gas drilling, much of it burned away in the natural gas stream flowing to power plants, businesses and homes, or flared off at well sites.

But today, ethane is feedstock for nearly half of U.S. plastics production and a valuable export to chemical companies around the world. As ethane flows from Texas shale fields, chemical and energy companies are building and expanding plants to take advantage of the cheap, plentiful raw material, plowing more than $140 billion into the Gulf Coast alone.

“It’s absolutely extraordinary this is happening in the United States,” said Neil Chapman, Exxon Mobil senior vice president. “I can assure you nobody predicted this in 2000 or even 2005.”

U.S. ethane production is projected to reach 2 million barrels a day by 2020, double the output at the height of the last drilling boom in 2014. On the journey from wellhead to market, ethane molecules will change forms several times as they are separated from natural gas, heated to become ethylene, processed into polyethylene, and ultimately extruded and molded into packaging and products that will appear on shelves in stores from Houston to Mumbai and Ho Chi Minh City.

The shale revolution is widely credited to the innovation and determination of one man, the late George P. Mitchell, son of a Greek immigrant and founder of The Woodlands. Mitchell, after striking it rich in oil, spent 35 years stubbornly focused on developing the Barnett Shale near Dallas, a play known for years as the “Wildcatters Graveyard.”

Mitchell, however, persisted, eventually combining hydraulic fracturing with horizontal drilling to unlock the complex shale rock. Mitchell didn’t frack his first profitable well until 1998, but with that success, he sold his company four years later for more than $3 billion to Devon Energy of Oklahoma City.

The shale boom was soon underway, producing oil and gas from Texas to North Dakota to the Northeast. It placed the United States among the world’s biggest energy producers, roiling global markets and upending more than 40 years of geopolitics.

And along with oil and gas came large volumes of another petroleum product known as natural gas liquids.

Three primary components can come out any successful well: crude oil, natural gas, which is essentially methane, and natural gas liquids, primarily ethane, butane and propane. Ethane is the most prevalent natural gas liquid, or NGL, and used solely as a feedstock for petrochemicals.

Mont Belvieu is built atop a salt dome formed more than 100 million years ago from deposits likely left by an ancient inland sea that cut across the North American continent. For more than 60 years, energy companies have used it as a natural storage tank, carving out salt caverns some 3,000 feet deep to hold millions of barrels of petroleum products.

Today, those caverns are increasingly filled with ethane and other natural gas liquids that feed the plastics and chemical industries, making Mont Belvieu and its neighbor to the south, Baytown, the focal point of the Gulf Coast petrochemical boom. Here, where rice fields once stretched as far as the eye could see, Exxon Mobil alone has invested some $6 billion to dramatically expand its 36-year-old plastics plant as well as its sprawling refining and chemicals complex in Baytown.

At these plants, the ethane molecules that squeezed through fissures in shale rock, flowed up a Texas well and traveled more than 150 miles by pipeline, will undergo chemical changes to transform them from once-overlooked byproducts of oil and gas drilling into one of most ubiquitous materials on earth. Hundreds of other pipelines stretching across Texas and beyond will carry millions more barrels of natural gas liquids from U.S. shale fields, converging near the salt dome under Mont Belvieu’s Barbers Hill.

This is the next stop for the natural gas liquids produced by Exxon’s subsidiary XTO Energy. Here, processing plants known as fractionators use varying pressures and temperatures to break the natural gas liquids into components, each with a slightly different combination of carbon and hydrogen, including butane (C4H10), propane (C3H8), pentane (C5H12) and, of course, ethane (C2H6).

The ethane is piped 10 miles to Exxon Mobil’s Baytown complex, which is simultaneously one of the nation’s oldest and most modern plants. The refinery was built nearly a century ago by one of Exxon Mobil’s predecessor companies, Humble Oil. A chemical plant was added in 1979 and expanded in 1997.

The focus of the Baytown expansion was eight furnaces, each costing more than $100 million and standing 23 stories tall — nearly the height of NRG Stadium. The furnaces, built in Thailand, are the heart of a plant known as a cracker, which gets its name from the process that uses extreme heat to crack ethane molecules in half and trigger chemical reactions that form ethylene.

The ethylene is piped back to Mont Belvieu, where some will be stored in the salt caverns, but most will feed another process that will change the hydrocarbons liberated from Texas shale once again.

Where the Baytown complex used heat and pressure to crack ethane into ethylene, Exxon Mobil’s Mont Belvieu plant relies on chemical reactions to fuse trillions of ethylene molecules into polyethylene.

The Mont Belvieu plant opened in 1982, producing mainly low-grade, flexible polyethylene used in plastic wrap and food packaging, and expanded nine years later to produce plastic for more rigid products, such as milk bottles. The most recent expansion, completed late last year, is dedicated to high-performance polyethylene that is light, flexible and strong.

After quality testing, the plastic is loaded into as many as 35 rail cars, each holding about 200,000 pounds of polyethylene pellets, and shipped throughout the country to customers who shape the polyethylene pellets into finished plastics products. About 40 percent of the polyethylene is made for the domestic market.

Polyethylene pellets marked for export are mechanically packaged in 55-pound bags, each holding about 1 million pellets. Every hour, the plant fills about 10,000 bags, which are loaded onto pallets, each holding 55 bags, and trucked to a 70-acre storage yard. As many as 100,000 pallets are kept for up to 45 days until they can be loaded into containers and shipped out of the Port of Houston.

The Baytown and Mount Belvieu plants together employ 7,500 people, and Exxon Mobil estimates that the number doubles to 15,000 when counting contractors and jobs at local suppliers, restaurants and other businesses that support the plant. Exxon pays more than $150 million a year in local taxes and fees.

The plants also have contributed to a surge in exports that has made Houston one of few regions in the country that exports more than it imports. That brings new money into the area — tens of billions of dollars that can be used to expand business, hire workers and increase wealth.

“We’re going to have things that are made in America again and getting shipped overseas,” Fritsch said. “That’s what’s exciting about shale gas. It’s the explosion of industry again in the U.S.”

Tweak the Sun’s Rotation, and We’re Not Here

Watch the Sun rotate for over a month brought to you by SDO. Since the Sun rotates once every 27 days on average, this movie presents more than an entire solar rotation. From March 30 through Apr. 29, 2011, the Sun sported quite a few active regions and magnetic loops. The movie shows the Sun in the 171 Angstrom wavelength of extreme ultraviolet light (capturing ionized iron heated to about 600,000 degrees), color coded to appear gold. The movie is based on a frame taken every 15 minutes being shown at 24 frames per second, with very few data gaps in this almost two-minute movie. Source Solar Dynamics Observatory

Another fresh reminder we owe our existence to the sun along with the climate in which we evolved and adapted. The Forbes article is Early Sun’s ‘Goldilocks’ Rotation Rate May Be Why We’re Here  Excerpts in italics with my bolds.

Our early Sun’s rate of rotation may be one reason we’re here to talk about it, astrobiologists now say. The key likely lies in the fact that between the first hundred million to the first billion years of its life, our G-dwarf star likely had a ‘Goldilocks’ rotation rate; neither too slow nor too fast.

Instead, its hypothetical ‘intermediate’ few days rate of rotation guaranteed our Sun was active enough to rid our newly-formed Earth of its inhospitable, hydrogen-rich primary atmosphere. This would have enabled a more habitable, secondary atmosphere composed of nitrogen, carbon dioxide, hydrogen and oxygen to eventually form.

If it had been a ‘fast’ (less than one day rotator), our Sun might have continually stripped our young planet of its secondary atmosphere as well. However, if it took more than 10 days to rotate, it might not have been active enough to strip Earth of its hypothetical primary atmosphere.

Such ideas were recently bandied about in oral presentations at last month’s the General Assembly of the International Astronomical Union (IAU) in Vienna.

Earth’s very first atmosphere would have been too hot and too thick, more like Venus’ present-day atmosphere, Theresa Luftinger, an astrophysicist at the University of Vienna, told me. No known organisms could have evolved under such an atmosphere.  A secondary atmosphere cannot evolve in the presence of a primordial atmosphere , says Luftinger.

It’s the star’s magnetic dynamo that drives its magnetic fields. And these magnetic fields, in turn, interact with the star itself, creating an interplay of extreme stellar activity.

“So, the quicker the star rotates, the higher the interaction between the magnetic field and the stellar body ,” said Luftinger.

Faster rotation means higher extreme ultra-violet and x-ray activity, Helmut Lammer, an astrophysicist at Austria’s Space Science Institute in Graz, told me. This would lead to atmospheric stripping and water loss on earthlike planets around an active young star, he says. 

Our Sun is now a very slow rotator at 27 days. But that wasn’t always the case. As for why some stars seem to inherently rotate faster than others?

Astrophysicists suspect that initial conditions within star-forming clouds cause newborn stars to have different rotation rates.

Researchers are able to roughly pinpoint the Sun’s early rotation rates by studying the isotopic ratios of neon, argon, potassium, and uranium here in Earth’s crust. That is, elements which have atoms that have the same numbers of protons in their atomic nucleus, but different numbers of neutrons. The researchers also considered such isotopic ratios from decades’-old Venus surface samples taken by Soviet Venus lander missions.


Arctic Ice Flash Freezing

CAA2018262to266

Four Days in Nunavut

Previous posts described how the Northwest Passage was treacherously laden with ice this year.  The image above shows the flash freezing in this region over the last four days.  Sept. 19 the CAA ice extent (Canadian Arctic Archipelago) was 320k km2, close to its annual minimum.  Yesterday MASIE showed 450k km2,  a 40% increase.

ArcticIce20180923

The graph shows MASIE reporting ice extents totalling 4.74M km2 yesterday,  124k km2 above the 11 year average (2007 to 2017 inclusive).  NOAA’s Sea Ice Index is 119 k km2 lower, 2007 was 462k km2 lower, and 2012 1.2M km2 less ice extent.  A dip on day 252 to  4.43M km2 will certainly be the daily minimum for the year.  With typical refreezing to month end, we can expect the September monthly average will exceed 2007 by at least 300k to 400k km2.


algore_ice_gone_by_2013


Why Teenagers Are Not Supreme Court Justices

The current skirmish is between those who want to disqualify Brett Kavanaugh and those who want to confirm him to the Supreme Court bench. At issue is a claim by a woman that the nominee harassed her when both were teenagers. Presumably she will tell her story to the Senators and he will tell his, and unless something unforeseen is disclosed, the claim will end up being unprovable and undisprovable.

At that point we should remember why teenagers are not candidates for adult responsibilities. It is widely accepted that most of us at those ages have brains not fully developed, especially regarding morality. The inability to foresee consequences of risky behaviors is a classic adolescent failing. Every parent struggles with granting freedom to youngsters to take decisions and bear the consequences, all the while hoping they and others survive the mistakes and learn to be responsible adults. Are teenagers accountable for their actions? Absolutely, as we see reckless teenage drivers causing damage, injury and sometimes death, ruining their own and other lives.

In the current context, with an all-out, full-court press by desperate Democrats to prevent another originalist Justice, this accusation at this time has clear political motivations. That doesn’t say nothing happened between the two teenagers; her animus against him seems more than distaste for his legal position, though I could be mistaken about that. Teenagers are infamous for taking chances, pushing the envelope, testing the rules and advice provided by their elders. With the uncertainties about the recalled incident, when and where and who was present, there is no way for us to know what happened.

Martin Luther King said it well, and in fact there is progress unacknowledged by social justice warriors.  Today’s surveillance for racial bias is extremely sensitive, and yet the demand for such incidents far exceeds the supply.  In addition we now have conflicts over male and female sexual encounters, and some presume that women are always the victims and men the trespassers.  Case by case, it comes down to personal integrity and character of the individuals involved.

What we do know is that judges are qualified by the character they have displayed over a lifetime of service in their families, communities and in the courtroom. That character is only partly formed in adolescence, but can be examined and known by adult behaviors. What matters is not a single incident, but the pattern exhibited over decades. On this basis, Brett Kavanaugh is supremely qualified and his confirmation should not be derailed.


Arctic Ice Made Simple

People are overthinking and over-analyzing Arctic Ice extents, and getting wrapped around the axle (or should I say axis).  So let’s keep it simple and we can all readily understand what is happening up North.

I will use the ever popular NOAA dataset derived from satellite passive microwave sensors.  It sometimes understates the ice extents, but everyone refers to it and it is complete from 1979 to 2017.  Here’s what NOAA reports (in M km2):

If I were adding this to the Ice House of Mirrors, the name would be The X-Ray Ice Mirror, because it looks into the structure of the time series.   For even more clarity and simplicity, here is the table:

NOAA NH Annual Average Ice Extents (in M km2).  Sea Ice Index v3.0 (here)

Year Average Change Rate of Change
1979 12.328
1994 12.011 -0.317 0.021 per year
2007 10.474 -1.537 0.118 per year
2017 10.393  -0.081 0.008 per year

The satellites involve rocket science, but this does not.  There was a small loss of ice extent over the first 15 years, then a dramatic downturn for 13 years, 6 times the rate as before. That was followed by the current plateau with virtually no further loss of ice extent.  All the fuss is over that middle period, and we know what caused it.  A lot of multi-year ice was flushed out through the Fram Strait, leaving behind more easily melted younger ice. The effects from that natural occurrence bottomed out in 2007.

Kwok et al say this about the Variability of Fram Strait ice flux:

The average winter area flux over the 18-year record (1978–1996) is 670,000 km2, ;7% of the area of the Arctic Ocean. The winter area flux ranges from a minimum of 450,000 km2 in 1984 to a maximum of 906,000 km2 in 1995. . .The average winter volume flux over the winters of October 1990 through May 1995 is 1745 km3 ranging from a low of 1375 km3 in the 1990 flux to a high of 2791 km3 in 1994.

https://www.researchgate.net/publication/261010602/download

Conclusion:

Some complain it is too soon to say Arctic Ice is recovering, or that 2007 is a true change point.  The same people were quick to jump on a declining period after 1994 as evidence of a “Death Spiral.”

Update September 25, 2018

Oh the irony!  Tamino accuses me of emulating Michael Mann and “hiding the decline” of sea ice, as opposed to temperatures.  In that case, where is my Nobel Prize?

But my humble efforts to tell the truth pale in comparison with Mann’s campaign to erase the medieval warm period.  His temperature trickery is described in Rise and Fall of the Modern Warming Spike

Footnote:

No one knows what will happen to Arctic ice.

Except maybe the polar bears.

And they are not talking.

Except, of course, to the admen from Coca-Cola

Ontario to Scrap Green Energy Act

Update September 21, 2018 at bottom

Global News reports on today;s proposed legislation: Ontario PCs introduce legislation to scrap Green Energy Act.  Excerpts in italics with my bolds.

Doug Ford‘s Progressive Conservative government has introduced legislation to put an end to the province’s Green Energy Act.

The legislation was tabled just before 1:30 p.m. ET Thursday. A formal announcement was made by energy minister, Greg Rickford, and infrastructure minister, Monte McNaughton.

“The Green Energy Act represents the largest transfer of money from the poor and middle class to the rich in Ontario’s history,” Rickford said.

Killing the former Liberal government’s Green Energy Act — passed in 2009 when Dalton McGuinty was premier — was a major campaign promise for Ford.

He said that the GEA had resulted in fewer manufacturing jobs in Ontario and that regulations around renewable energy projects had led to higher electricity prices for consumers.

Reddy the shiv

The move comes after the PC government had already introduced legislation cancelling hundreds of wind energy projects approved under the act.

Scrapping the GEA will likely mean major changes for the province’s energy sector.

For example, under the GEA, municipalities were essentially barred from disallowing renewable energy projects – such as wind farms – from being built within their territory. Many people opposed to these projects criticized this section of the GEA, saying it prohibited local communities from deciding their own futures.

The GEA also gave special powers to the minister of energy to green light certain projects, such as transmission lines, without conducting a full economic review prior to approval.

But proponents of the GEA, including former energy minister George Smitherman, who helped pass the legislation, have called the GEA and renewable energy projects in the province a big success.

Meanwhile, Liberal interim leader, John Fraser, says cancellation of the GEA could see Ontario move backward on renewable energy when compared to the rest of the world. He also fears scrapping the act could mean job losses

“My biggest concern this afternoon is jobs. What’s going to happen to people’s jobs in this industry that we’ve built up – tens of thousands of jobs,” Fraser said.

But the PCs say this isn’t true.

They say that the GEA was responsible for the “disastrous” feed-in-tariff program that contributed significantly toward skyrocketing electricity prices and that the bill’s repeal is necessary to prevent “unneeded” renewable energy projects being approved in the future.

“We believe the people of Ontario should have the final say about what gets built in their communities,” McNaughton said.

Update September 21, 2018

Some news reports have given more air time to reaction from greens.  Lorrie Goldstein at Toronto Sun instead goes into more detail why the Ontario Green Act is a failure: Good riddance to toxic Green Energy Act  Excerpts in italics with my bolds.

By scrapping the Green Energy Act, passed by former Liberal premier Dalton McGuinty in 2009, Premier Doug Ford is ending one of the worst legislative disasters ever inflicted on the people of Ontario.

The GEA is largely responsible for Ontario’s skyrocketing electricity prices.

It’s the reason we’re paying outrageously high prices for green energy the Liberals didn’t need in order to eliminate coal power, which was actually done using nuclear power and natural gas.

The jobs the Liberals promised under the GEA never materialized, according to former Ontario auditor general Jim McCarter in his 2011 annual report.

The GEA made Ontario’s energy grid less efficient because it required the province to buy expensive and unreliable wind and solar power from green energy developers under 20-year contracts, before purchasing other forms of energy.

Auditor General Bonnie Lysyk reported in 2016 that Ontario electricity consumers had overpaid $9.2 billion for green energy, because the Liberals ignored the advice of their own experts on how to price it.

Under the GEA, the Liberals abdicated from the proper role of government, which is to balance public and private interests.

Instead, they became cheerleaders for the wealthy green energy lobby.

Citizens opposed to green energy projects imposed on their communities faced the impossible task of fighting the industry and the Liberal government.

Ford is right to scrap the GEA.

The tragedy is that the economic damage it caused under the McGuinty/Wynne Liberals will be felt for decades to come.

Carbon Credits Backfire

One of the favorite climate policy prescriptions is to apply carbon pricing either by a direct tax or by requiring purchase of carbon credits or offsets.  Now comes a report of unintended consequences, namely that rising prices for carbon credits have increased the demand for coal, the most disliked of all fossil fuels.

From Bloomberg Why Higher Pollution Costs Aren’t Denting Coal Demand in EU  Excerpts in italics with my bolds.

If you thought the surging price of fossil-fuel emissions in Europe would hurt coal demand, think again.

The highest prices for carbon credits in a decade have also lifted natural gas, discouraging power stations from making the switch away from coal. As a result, demand remains strong for the dirtiest fossil fuel in the continent that’s doing the most to clean up its economy. Coal prices as a result reached their highest in five years on Tuesday.

Gas futures would need to plunge by more than 20 percent before coal-fired power stations become uneconomic to run, based on current market prices for fuel and electricity, according to Georgi Slavov, head of research at broker Marex Spectron.

“This is highly unlikely” through at least November, Slavov said. “There are no plausible scenarios which support pricing out of coal.”

Demand for coal in China and India is drawing in cargoes that otherwise would land at plants in Europe from the Netherlands to Germany. The Dutch front-year contract recovered from losses early in the year to rise almost 13 percent, climbing alongside gas and oil.

Gas-fired generators, Chinese importers of liquefied natural gas and storage sites in mainland Europe are all competing for the same shipments, stoking the cleaner fuel’s rally. There simply hasn’t been much spare gas supply to allow switching from coal because of carbon’s price surge.

Global coal imports are set to reach a record 1.01 billion tons this year, exceeding 2013’s level, which was just below 1 billion tons, according to Guillaume Perret, founder and director of Perret Associates Ltd., a London-based research company.

“The coal market is now facing a structural shortage” of investment, including in mines and logistics, Perret said.


clean energy backfire2

How Goes the Transition Away from Fossil Fuels

The first objective in the Great Green Transition is to stop the use of Coal, Climate Enemy #1. An update report on that front comes from Vijay Jayaraj, Aug 18, 2018, at Townhall The Dawn of Climate Realism: Coal Surges Amid Climate Rhetoric  Excerpts in italics with my bolds.

Many countries have been at the crisscross of warfare between anti-coal establishments and the traditional coal industry. Despite the elite-empowered and politically motivated worldwide campaign to phase out coal, demand for coal is on the rise!

Coal has been “enemy No. 1” for the climate establishment. In fact, it would seem that the entire global warming movement is hinged upon the singular aim to eliminate coal from use.

Catastrophic Anthropogenic Global Warming (CAGW) is a notion that cites a popular scientific hypothesis and concludes that the global temperatures have risen, or will soon rise, to dangerous levels in the post-industrialized era due to human activity.

The proponents of CAGW believe that the primary contributor to this increase in temperature is the combustion of coal and the subsequent release of carbon dioxide gas into the atmosphere.

However, peer-reviewed scientific journals by hundreds of scientists render many of these claims dubious at best. Here are just three of them.

Firstly, contrary to the claim that carbon dioxide is the primary driver of global warming, global temperatures have not risen proportionately to carbon dioxide concentration in the atmosphere. In other words, an increase in carbon dioxide emission has not resulted in an increase in temperature.

Secondly, most of the current “consensus” on climate change is based on forecasts from computer climate models. But the wide divergence between observed temperature and model predictions makes it apparent that the models were programmed incorrectly to be over-dependent on carbon dioxide concentration to predict temperature changes.

In what was a major embarrassment to United Nations Intergovernmental Panel on Climate Change (IPCC), top climate scientists admitted these flaws in the climate models when they failed to reflect real-world temperatures during the last 19 years. The same was widely publicized and even testified to the U.S. House Committee on Science, Space & Technology.

Thirdly, contrary to the claim that recent warming is historically unprecedented, today’s temperature levels are similar to the temperatures the earth experienced in the first and eleventh centuries. Also known as Roman Warm Period and Medieval Warm Period, these were times when, though as warm as today or warmer, the earth’s ecosystems flourished. The notion that “today’s temperature levels are at unprecedented levels” is completely false.

Despite these (and many more) straight-forward evidences against the CAGW hypothesis, the climate establishment continues to advocate for the ban of coal and coal-fired power plants. Global climate treaties like the Paris Agreement were set out to target and close down coal plants in developing countries.

But to their surprise, coal use is rising.

This financial year, Coal India—India’s largest state-controlled coal mining company—saw its first-quarter profits jump 61 percent and its coal production rise 15.23 percent. India has a long-term vision to increase its coal output and has been vocal about “carbon imperialism”—a term it uses to define the attitude of the anti-coal climate establishment.

In 2017, coal accounted for 60.4 percent of total energy consumption in China. The country’s coal production outputs for the first seven months of 2018 was 1.98 billion tons, 3.4 percent higher than the same period last year. China’s coal imports surged this July and hit a record high (29 million tons), beating the previous highest recorded monthly volume import (January 2014).

But the surge in coal is not just limited to Asia.

Russia’s coal production of 410 million tons was its highest since the Soviet era and is expected to reach 420 million tons this year. The coal industry is set to expand in the coming years with massive infrastructure upgrades.

U.S. coal output reached a 16-year high in 2017 (701 million tons), after a change in leadership that saw the lifting of heavy restrictions on coal from the previous administration. Coal output in 2017 was 40.8 million tons higher than in 2016, and India was the top importer of U.S. coal in Asia (13 million tons).

The trend continued in 2018, and the month of April recorded the highest coal export in five years. U.S exports to India reached 6.2 million tons in just the first half of 2018, which is nearly the entire export (6.8m tons) to India in 2017! And coal is expected to do fairly well in the U.S. despite the disruption from the natural gas boom.

The situations for coal in India, China, and the U.S. are prime examples of the coal industry’s strength. It can also be said that the climate rhetoric has failed to break the world’s dependence on coal. And for good reason. Coal remains among the cheapest, and technically simplest, sources of the abundant, affordable, reliable electricity indispensable to the modern industry and technology that are indispensable to lifting and keeping whole societies out of poverty.

Leaders across the globe understand the indispensable role of coal in their economies. They are also beginning to understand the exaggerated nature of climate-change dangers promoted heavily in the mainstream media.

The climate establishment’s doomsday prophecies failed to come true in the last 20 years, which saw global temperature remain largely stable. Arctic ice remained stable, global agricultural outputs increased, more people rose out of poverty, and the forests in Europe grew instead of shrinking.

Clearly, there is no reason why the coal industry should slow down, and it won’t. Overblown climate-change rhetoric is leading rapidly to the downfall of the climate establishment, and nations are moving past it at a rapid pace.

Postscript:


cap n trade