Arctic Heart Beat

We are about 50 days away from the annual Arctic ice extent minimum, which typically occurs on or about day 260 (mid September). Some take any year’s slightly lower minimum as proof that Arctic ice is dying, but the image below shows day 260 over the last 10 years. The Arctic heart is beating clear and strong.

Click on image to enlarge.

Over this decade, the Arctic ice minimum has not declined, but looks like fluctuations around a plateau since 2007. By mid-September, all the peripheral seas have turned to water, and the residual ice shows up in a few places. The table below indicates where we can expect to find ice this next September.

Arctic Regions 2007 2010 2012 2014 2015 2016 Average
Central Arctic Sea 2.67 3.16 2.64 2.98 2.93 2.92 2.91
BCE 0.50 1.08 0.31 1.38 0.89 0.52 0.87
LKB 0.29 0.24 0.02 0.19 0.05 0.28 0.17
Greenland & CAA 0.56 0.41 0.41 0.55 0.46 0.45 0.46
B&H Bays 0.03 0.03 0.02 0.02 0.10 0.03 0.03
NH Total 4.05 4.91 3.40 5.13 4.44 4.20 4.45

BCE (Beaufort, Chukchi and East Siberian) on the Asian side are quite variable as the largest source of ice other than the Central Arctic itself.   Greenland Sea and CAA (Canadian Arctic Archipelago) together hold almost 0.5M km2 of ice at minimum, fairly consistently.   LKB are the European seas of Laptev, Kara and Barents, a smaller source of ice, but a difference maker some years, as Laptev was in 2016.  Baffin and Hudson Bays are almost inconsequential.

For context, note that the average maximum has been 15M, so on average the extent shrinks to 30% of the March high before growing back the following winter.


Reasoning About Climate

As the stool above shows, the climate change package sits on three premises. The first is the science bit, consisting of an unproven claim that observed warming is caused by humans burning fossil fuels. The second part rests on impact studies from billions of research dollars spent uncovering any and all possible negatives from warming. And the third leg is climate policies showing how governments can “fight climate change.”

It is refreshing to see more and more articles by people reasoning about climate change/global warming and expressing rational positions. Increasingly, analysts are unbundling the package and questioning not only the science, but also pointing out positives from CO2 and warming. And as this post shows, essays are challenging the policy proposals advanced by climate activists. David R. Henderson and John H. Cochrane published at WSJ on July 30, 2017 Climate Change Isn’t the End of the World  Even if world temperatures rise, the appropriate policy response is still an open question.  Complete text below (my Bolds)

Climate change is often misunderstood as a package deal: If global warming is “real,” both sides of the debate seem to assume, the climate lobby’s policy agenda follows inexorably.

It does not. Climate policy advocates need to do a much better job of quantitatively analyzing economic costs and the actual, rather than symbolic, benefits of their policies. Skeptics would also do well to focus more attention on economic and policy analysis.

To arrive at a wise policy response, we first need to consider how much economic damage climate change will do. Current models struggle to come up with economic costs consummate with apocalyptic political rhetoric. Typical costs are well below 10% of gross domestic product in the year 2100 and beyond.

That’s a lot of money—but it’s a lot of years, too. Even 10% less GDP in 100 years corresponds to 0.1 percentage point less annual GDP growth. Climate change therefore does not justify policies that cost more than 0.1 percentage point of growth. If the goal is 10% more GDP in 100 years, pro-growth tax, regulatory and entitlement reforms would be far more effective.

Yes, the costs are not evenly spread. Some places will do better and some will do worse. The American South might be a worse place to grow wheat; Southern Canada might be a better one. In a century, Miami might find itself in approximately the same situation as the Dutch city of Rotterdam today.

Rotterdam–Ninety years thriving behind dikes and dams.

But spread over a century, the costs of moving and adapting are not as imposing as they seem. Rotterdam’s dikes are expensive, but not prohibitively so. Most buildings are rebuilt about every 50 years. If we simply stopped building in flood-prone areas and started building on higher ground, even the costs of moving cities would be bearable. Migration is costly. But much of the world’s population moved from farms to cities in the 20th century. Allowing people to move to better climates in the 21st will be equally possible. Such investments in climate adaptation are small compared with the investments we will regularly make in houses, businesses, infrastructure and education.

And economics is the central question—unlike with other environmental problems such as chemical pollution. Carbon dioxide hurts nobody’s health. It’s good for plants. Climate change need not endanger anyone. If it did—and you do hear such claims—then living in hot Arizona rather than cool Maine, or living with Louisiana’s frequent floods, would be considered a health catastrophe today.

Global warming is not the only risk our society faces. Even if science tells us that climate change is real and man-made, it does not tell us, as President Obama asserted, that climate change is the greatest threat to humanity. Really? Greater than nuclear explosions, a world war, global pandemics, crop failures and civil chaos?

No. Healthy societies do not fall apart over slow, widely predicted, relatively small economic adjustments of the sort painted by climate analysis. Societies do fall apart from war, disease or chaos. Climate policy must compete with other long-term threats for always-scarce resources.

Facing this reality, some advocate that we buy some “insurance.” Sure, they argue, the projected economic cost seems small, but it could turn out to be a lot worse. But the same argument applies to any possible risk. If you buy overpriced insurance against every potential danger, you soon run out of money. You can sensibly insure only when the premium is in line with the risk—which brings us back where we started, to the need for quantifying probabilities, costs, benefits and alternatives. And uncertainty goes both ways. Nobody forecast fracking, or that it would make the U.S. the world’s carbon-reduction leader. Strategic waiting is a rational response to a slow-moving uncertain peril with fast-changing technology.

Global warming is not even the obvious top environmental threat. Dirty water, dirty air and insect-borne diseases are a far greater problem today for most people world-wide. Habitat loss and human predation are a far greater problem for most animals. Elephants won’t make it to see a warmer climate. Ask them how they would prefer to spend $1 trillion—subsidizing high-speed trains or a human-free park the size of Montana.

Then, we need to know what effect proposed policies have and at what cost. Scientific, quantifiable or even vaguely plausible cause-and-effect thinking are missing from much advocacy for policies to reduce carbon emissions. The Intergovernmental Panel on Climate Change’s “scientific” recommendations, for example, include “reduced gender inequality & marginalization in other forms,” “provisioning of adequate housing,” “cash transfers” and “awareness raising & integrating into education.” Even if some of these are worthy goals, they are not scientifically valid, cost-benefit-tested policies to cool the planet.

Climate policy advocates’ apocalyptic vision demands serious analysis, and mushy thinking undermines their case. If carbon emissions pose the greatest threat to humanity, it follows that the costs of nuclear power—waste disposal and the occasional meltdown—might be bearable. It follows that the costs of genetically modified foods and modern pesticides, which can feed us with less land and lower carbon emissions, might be bearable. It follows that if the future of civilization is really at stake, adaptation or geo-engineering should not be unmentionable. And it follows that symbolic, ineffective, political grab-bag policies should be intolerable.

Climate science, impacts and policies also appear as a house of cards.

Mr. Henderson is a research fellow with the Hoover Institution and an economics professor at the Naval Postgraduate School. Mr. Cochrane is a senior fellow of the Hoover Institution and an adjunct scholar of the Cato Institute.

More about Climate Policy Failures

Speaking Climate Truth to Policymakers

Climate Policies Failure, the Movie

Climatists Wrong-Footed

Control Knobs, Rick Perry and AMS

A great post by Ross McKitrick at the Hill (H/T GWPF)  In the fight between Rick Perry and climate scientists — He’s winning  Excerpts below (my bolds)

Policy makers and the public need to understand the extent to which major scientific institutions like the American Meteorological Society have become biased and politicized on the climate issue. Convincing them of this becomes much easier when the organizations themselves supply the evidence.

This happened recently in response to a CNBC interview with Energy Secretary Rick Perry. He was asked “Do you believe CO2 [carbon dioxide] is the primary control knob for the temperature of the Earth and for climate?”

It was an ambiguous question that defies a simple yes or no answer. Perry thought for moment then said, “No, most likely the primary control knob is the ocean waters and this environment we live in.” He then went on to acknowledge the climate is changing and CO2 is having a role, but the issue is how much, and being skeptical about some of these things is “quite all right.”

Perry’s response prompted a letter of protest from Keith Seitter, executive director of the American Meteorological Society. The letter admonished him for supposedly contradicting “indisputable findings” that emissions of CO2 and other greenhouse gases are the primary cause of recent global warming, a topic for which Seitter insists there is no room for debate.

It is noteworthy that the meteorological society remained completely silent over the years when senior Democratic administration officials made multiple exaggerated and untrue statements in service of global warming alarmism.  (McKitrick provides several examples in his article)

But the meteorological society leapt to condemn Perry for a cautious response to an awkward question. Perry could not reasonably have agreed with the interviewer since the concept of a “control knob” for the Earth’s temperature wasn’t defined. Doubling CO2 might, according to models, cause a few degrees of warming. Doubling the size of the sun would burn up the planet. Doubling cloud cover might trigger an ice age. So which is the “primary control knob”? The meteorological society letter ignored the odd wording of the question, misrepresented Perry’s response and then summarily declared their position on climate “indisputable.” Perry’s cautious answer, by contrast, was perfectly reasonable in the context of a confusing question in a fast-moving TV interview.

Furthermore, Seitter’s letter invites skepticism. It pronounces confidently on causes of global warming “in recent decades” even though this is where the literature is most disputed and uncertain. Climate models have overestimated warming in recent decades for reasons that are not yet known. Key mechanisms of natural variability are not well understood, and measured climate sensitivity to CO2 appears to be lower than modelers assumed. Climate models tweaked to get recent Arctic sea ice changes right get overall warming even more wrong, adding to the list of puzzles. But to the meteorological society, the fact that these and many other questions are unresolved does not prevent them from insisting on uniformity of opinion.

Summary

The meteorological society letter is all about enforcing orthodoxy, which speaks ill of the leadership’s overall views on open scientific debate.

Ross McKitrick is a professor of economics at the University of Guelph and an Adjunct Scholar at the Cato Institute.

See also:  Nature’s Sunscreen and Climate Biorhythms

Footnote:  Arnd’s comment below reminds of this image.  It works even better with Republican Rick Perry testifying to the ocean’s climate dominance.


Arctic Ice Frees Captive Ships

Icebreaker “Kapitan Dranitsyn” has been trapped in Pevek along with two cargo vessels since early January. Photo: Rosmorport May30, 2017

In July, the Northern Sea Route (NSR) starts to open for commercial shipping. As previously reported here Arctic Ice Takes Revenge, a convoy of Russian cargo ships including icebreakers were trapped by January ice and were stranded in Pevek. May 30 they were able to leave port, but making it home to Arkhangelsk is still uncertain since plenty of ice remains in Eastern Siberian and Laptev seas.

More about the NSR shipping situation at the end of this post.

The image below shows the evolution of ice extents since 2007 along the Northern Sea Route.  The principal challenge for shipping is Laptev sea, and secondarily East Siberian and Kara seas.

Click on image to enlarge.

The graph below shows Arctic ice extents comparing 2017 to the eleven-year average, to 2016 and 2007, as well as SII estimates.

This year ice extents are ~200k km2 higher than average at day 208, 660k km2 greater than 2016, and 760k km2 surplus above 2007.  MASIE, with its higher resolution mapping shows 600k km2 more ice than Sea Ice Index (SII).

The table below presents the ice extents in various regions of the Arctic Ocean.

Region 2017208 Day 208
Average
2017-Ave. 2007208 2017-2007
 (0) Northern_Hemisphere 7616280 7412179 204101 6854322 761958
 (1) Beaufort_Sea 817086 800703 16383 731315 85771
 (2) Chukchi_Sea 501448 576407 -74959 410291 91157
 (3) East_Siberian_Sea 655273 859194 -203922 611838 43435
 (4) Laptev_Sea 595803 493098 102705 346484 249320
 (5) Kara_Sea 234885 216677 18208 263819 -28935
 (6) Barents_Sea 74162 33989 40173 38450 35713
 (7) Greenland_Sea 429112 337523 91590 350141 78971
 (8) Baffin_Bay_Gulf_of_St._Lawrence 351594 169554 182040 226232 125362
 (9) Canadian_Archipelago 584766 603827 -19062 585307 -542
 (10) Hudson_Bay 153623 172129 -18506 114225 39398
 (11) Central_Arctic 3217386 3146830 70556 3174877 42508

The only sizeable 2017 deficits to decadal average are in Chukchi and East Siberian seas.  Ice surpluses this year offset the losses, especially in Laptev, Greenland Sea, Baffin Bay and the Central Arctic.  Barents has been holding steady at the highest minimum of the decade, set by 2014.  2007 is eclipsed by 2017 in almost every region.

Varying Views of the Northern Sea Route

Text in image refers to events in 2013

Northern Sea Route Information Office

According to the data provided by the Northern Sea Route Information Office, traffic volume in 2016 has increased by 35% in comparison with 2015. However the traffic remained low with only 19 vessels using the route, far from the record set in 2013 with 71 vessels. Steep downturn started in 2014, the amount of cargo transported in transit dropping 77 per cent compared to the previous year.

The navigation season for transit passages on NSR starts approximately at the beginning of July and lasts through to the second half of November. There are no specific dates for commencement and completion of navigation; it all depends on particular ice conditions. In 2011 the navigation season on the NSR seaways for large vessels constituted 141 days in total, i.e. more than 4.5 months. In recent years quite easy ice conditions have been observed and that offers more considerable opportunities for operation at the NSR seaways. All NSR seaways are currently located in the area of one-year ice. In the arctic conditions one-year ice grows approximately up to 1.6 metres. Arktika-type icebreaker can open passages through up to 2.3m thick ice. In early July, at the beginning of navigation ice is not pressurized. The ice is broken and easily moved through. . . Therefore, in the current ice conditions vessels can navigate from July until December.

Malte Humpert, the strategic director and founder of the Arctic Institute

The NSR will not become a major shipping route. Not today and not in 2030 – or even 2050. As long as there is winter ice, which makes the Arctic Ocean unnavigable for part of the year, it will not be suitable for regular transit traffic.

There may be occasional voyages, as we have seen over the past few years, delivering timber from Finland to Canada, or Norwegian fish and LNG to Japan or iron ore to China. But the NSR will not see containerized cargo on which global trade operates. There are a host of reasons for that, the biggest ones being lack of schedule reliability and seasonability of the route, lack of ports of call and increased insurance premiums on the NSR over Suez.

As a comparison: the Suez Canal sees around 18,000 transits per year, the Panama Canal around 15,000, the Straits of Malacca around 65,000.

In the past five years taken together, the NSR saw around 200 transits, with most vessels being tiny compared to the giant container ships and bulk carriers passing through the world’s shipping hubs.

The 259 meters long, 34 meter wide «Shturman Albanov» in early May arrived in Murmansk with another load of oil from Novy Port, the new oil field in the Yamal Peninsula. It marked the 5th million ton of oil delivered from the field, operator Gazprom Neft informs.

In the course of the last 12 months, a total of 196 shiploads of oil have made from Yamal to Murmansk. Shipping company Sovcomflot now has three brand new Arc7 ice class tankers dedicated to shipments from the new Arctic field.

Man Made Warming from Adjusting Data

trends and strings

Roger Andrews does a thorough job analyzing the effects of adjustments upon Surface Air Temperature (SAT) datasets. His article at Energy Matters is Adjusting Measurements to Match the Models – Part 1: Surface Air Temperatures. Excerpts of text and some images are below.  The whole essay is informative and supports his conclusion:

In previous posts and comments I had said that adjustments had added only about 0.2°C of spurious warming to the global SAT record over the last 100 years or so – not enough to make much difference. But after further review it now appears that they may have added as much as 0.4°C.

For example, these graphs show warming of the GISS dataset:

Figure 2: Comparison of “Old” and “Current” GISS meteorological station surface air temperature series, annual anomalies relative to 1950-1990 means

The current GISS series shows about 0.3°C more global warming than the old version, with about 0.2°C more warming in the Northern Hemisphere and about 0.5°C more in the Southern. The added warming trends are almost exactly linear except for the downturns after 2000, which I suspect (although can’t confirm) are a result of attempts to track the global warming “pause”. How did GISS generate all this extra straight-line warming? It did it by replacing the old unadjusted records with “homogeneity-adjusted” versions.

The homogenization operators used by others have had similar impacts, with Berkeley Earth Surface Temperature (BEST) being a case in point. Figure 3, which compares warming gradients measured at 86 South American stations before and after BEST’s homogeneity adjustments (from Reference 1) visually illustrates what a warming-biased operator does at larger scales. Before homogenization 58 of the 86 stations showed overall warming, 28 showed overall cooling and the average warming trend for all stations was 0.54°C/century. After homogenization all 86 stations show warming and the average warming trend increases to 1.09°C/century:

Figure 3: Warming vs. cooling at 86 South American stations before and after BEST homogeneity adjustments

The adjusted “current” GISS series match the global and Northern Hemisphere model trend line gradients almost exactly but overstate warming relative to the models in the Southern (although this has only a minor impact on the global mean because the Southern Hemisphere has a lot less land and therefore contributes less to the global mean than does the Northern). But the unadjusted “old” GISS series, which I independently verified with my own from-scratch reconstructions, consistently show much less warming than the models, confirming that the generally good model/observation match is entirely a result of the homogeneity adjustments applied to the raw SAT records.


Summary

In this post I have chosen to combine a large number of individual examples of “data being adjusted to match it to the theory” into one single example that blankets all of the surface air temperature records. The results indicate that warming-biased homogeneity adjustments have resulted in current published series overestimating the amount by which surface air temperatures over land have warmed since 1900 by about 0.4°C (Table 1), and that global surface air temperatures have increased by only about 0.7°C over this period, not by the ~1.1°C shown by the published SAT series.

Land, however, makes up only about 30% of the Earth’s surface. The subject of the next post will be sea surface temperatures in the oceans, which cover the remaining 70%. In it I will document more examples of measurement manipulation malfeasance, but with a twist. Stay tuned.

Footnote:

I have also looked into this issue by analyzing a set of US stations considered to have the highest CRN rating.  The impact of adjustments was similarly evident and in the direction of warming the trends.  See Temperature Data Review Project: My Submission


Trump’s Climate Clarity


Delingpole gets the back story from Chris Horner on Trump’s climate position. How Donald Trump Got to be so Amazing on Climate Change  Excerpts:

Horner understands the magnitude of Trump’s achievement so far. Even Trump announcing his plan to pull out of the UN Paris climate agreement required immense determination and moral courage. After all his decision wasn’t only resisted by the usual Democrat suspects and green lobbyists: it also came up against stiff opposition from key members of the Administration, among them, Secretary of State Rex Tillerson and Economics Advisor Gary Cohn.

In fact, argues Horner, probably nowhere in DC is the swamp more heavily defended by the liberal politico-media establishment than the EPA and the climate change industry.

No other GOP presidential candidate – not Rubio, not Cruz – would have delivered on climate change in the same way as Trump has. They would, quite simply, have been overwhelmed by the swamp. So how come Trump has proved so exceptional in tackling the Green Blob? It’s not like he’ll have read lots of books on the subject because his attention span just doesn’t allow for it. No, according to Horner it’s much simpler than that. It’s because Trump does not think like a politician. Rather, Trump made his decision using much the same gut feeling he uses on his business deals – which he wasn’t sidetracked by any of the “green jobs” “save the world” crap which other politicians find so seductive…

Horner: “Here’s what I firmly believe. I’m convinced that the penny dropped for others, as it did me, when Donald Trump gave his editorial board interview to the Washington Post. It’s often mocked – where he said: “I’m not a big believer in global warming. Not a big believer.” And then he continued in a very important way. And if you follow the way Donald Trump speaks it’s perfectly clear what he’s saying. He said, “You know, a lot of people are making a lot of money off of this.”

“He was not saying this as a politician says it. (‘And if we use spoons not shovels we can create even more jobs…’ That sort of playground thinking is very common among politicians.) And whatever anybody thinks about Donald Trump you can be confident of this. At 21, at Le Cirque, somewhere at some point, somebody who is making a killing off the rents of the global warming industry laughed it up a little too loudly or once too many times around Donald Trump. Because what he said to the Washington Post was “You’re robbing Peter to pay Paul. Goldmans is making a killing out of this.” That’s what I heard him say. Politicians normally fall for this. But not Donald.

You can take his Chinese hoax comments, you can take hoax in any context but the fact is the way they’re playing out the global warming industry there are many scams involved and I think he was aware of this. I do think at one point somebody laughed a little too loudly…”

Summary

A politician would have been sidetracked by all the talk of “green jobs” or “saving the planet.” But Trump made his decision using much the same gut feeling he uses on his business deals. “Something about this climate change business stinks,” he probably said to himself at some stage.

And if so, he would have been quite right, it does.

To follow the money see also Climate Crisis Inc.


Green Losers

There is much to like about a recent Daily Beast article by Joel Kotkin, who is no fan of Trump, but sees clearly why he is winning against the greens. In writing Why the Greens Lost and Trump Won, Kotkin encapsulates in a few paragraphs  all the reasons why so many of us detest the climatists. (Article reblogged below with some images added)

When President Trump pulled out of the Paris climate accords, embraced coal, and stacked his administration from people from fossil-fuel producing states, the environmental movement reacted with near-apocalyptic fear and fury. They would have been better off beginning to understand precisely why the country has become so indifferent to their cause, as evidenced by the victory not only of Trump but of unsympathetic Republicans at every level of government.

Yet there’s been little soul-searching among green activists and donors, or in the generally pliant media since November about how decades of exaggerated concerns—about peak oil, the “population bomb,” and even, a few decades back, global cooling—and demands for economic, social, and political sacrifices from the masses have damaged their movement.

The New Religion and the Next Autocracy

Not long ago, many greens still embraced pragmatic solutions—for example substituting abundant natural gas for coal—that have generated large reductions in greenhouse gas emissions. Rather than celebrate those demonstrable successes, many environmentalists began pushing for a total ban on the development of fossil fuels, including natural gas, irrespective of the costs or the impact on ordinary people.

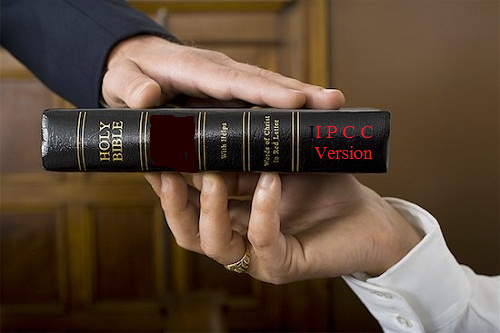
James Lovelock, who coined the term “Gaia,” notes that the green movement has morphed into “a religion” sometimes marginally tethered to reality. Rather than engage in vigorous debate, they insist that the “science is settled” meaning not only what the challenges are but also the only acceptable solutions to them. There’s about as much openness about goals and methods within the green lobby today as there was questioning the existence of God in Medieval Europe. With the Judeo-Christian and Asian belief systems in decline, particularly among the young, environmentalism offers “science” as the basis of a new theology.

The believers at times seem more concerned in demonstrating their faith than in passing laws, winning elections or demonstrating results. So with Republicans controlling the federal government, greens are cheering Democratic state attorney generals’ long-shot legal cases against oil companies. The New York Times’ Thomas Friedman has talked about dismissing the disorder of democracy as not suited to meeting the environmental challenges we face, and replacing it with rulers like the “reasonably enlightened group of people” who run the Chinese dictatorship.

After Trump pulled the U.S. out of the Paris climate accord, China was praised, bizarrely, as the great green hope. The Middle Kingdom, though, is the world’s biggest and fastest growing emitter, generating coal energy at record levels. It won’t, under Paris, need to cut its emissions till 2030. Largely ignored is the fact that America, due largely to natural gas replacing coal, has been leading the world in GHG reductions.

Among many greens, and their supports, performance seems to mean less than proper genuflecting; the Paris accords, so beloved by the green establishment, will make little impact on the actual climate, as both rational skeptics like Bjorn Lomborg and true believers like NASA’s James Hanson agree. In this context, support for Paris represents the ultimate in “virtue signaling.” Ave Maria, Gaia.

The UN climate train wreck.

The California Model

The cutting edge for green soft authoritarianism, and likely model after the inevitable collapse of the Trump regime, lies in California. On his recent trip with China, Brown fervently kowtowed to President Xi Jinping. Brown’s environmental obsessions also seems to have let loose his own inner authoritarian, as when he recently touted “the coercive power of the state.”

Coercion has its consequences. California has imposed, largely in the name of climate change, severe land use controls that have helped make the state among the most unaffordable in the nation, driving homeownership rates to the lowest levels since the 1940s, and leaving the Golden State with the nation’s highest poverty rate.

The biggest losers from Brown’s policies have been traditional blue collar, energy-intensive industries such as home building, manufacturing, and energy. Brown’s climate policies have boosted energy prices and made gas in oil-rich California about the most expensive in the nation. That doesn’t mean much to the affluent Tesla-driving living in the state’s more temperate coast, but it’s forced many poor and middle-class people in the state’s less temperate interior into “energy poverty,” according to one recent study.

that, too, fits the climatista’s agenda, which revolves around social engineering designed to shift people from predominately suburban environments to dense, urban and transit dependent ones. The state’s crowded freeway are not be expanded due to a mandated “road diet,” while local officials repeatedly seek to reduce lanes and “calm traffic” on what are already agonizing congested streets. In this shift, market forces and consumer preferences are rarely considered, one reason these policies have stimulated much local opposition—and not only from the state’s few remaining conservatives.

California’s greens ambitions even extend to eating habits. Brown has already assaulted the beef producers for their cattle’s flatulence. Regulators in the Bay Area and local environmental activists are proposing people shift to meatless meals. Green lobbyists have already convinced some Oakland school districts to take meat off the menu. OK with me, if I get the hamburger or taco-truck franchise next to school when the kids get out.

Sadly, many of these often socially harmful policies may do very little to address the problem associated with climate change. California’s draconian policies fail to actually do anything for the actual climate, given the state’s already low carbon footprint and the impact of people and firms moving to places where generally they expand their carbon footprint. Much of this has taken on the character of a passion play that shows how California is leading us to the green millennium.

Goodbye to the Family

An even bigger ambition of the green movement—reflecting concerns from its earliest days—has been to reduce the number of children, particularly in developed countries. Grist’s Lisa Hymas has suggested that it’s better to have babies in Bangladesh than America because they don’t end up creating as many emissions as their more fortunate counterparts. Hymas’ ideal is to have people become GINKs—green inclinations, no kids.

Many green activists argue that birth rates need to be driven down so warming will not “fry” the planet. Genial Bill Nye, science guy, has raised the idea of enforced limits on producing children in high-income countries. This seems odd since the U.S. already is experiencing record-low fertility rates, a phenomenon in almost all advanced economies, with some falling to as little as half the “replacement rate” needed to maintain the current population. In these countries, aging populations and shrinking workforces may mean government defaults over the coming decades.

The demographic shift, hailed and promoted by greens, is also creating a kind of post-familial politics. Like Jerry Brown himself, many European leaders—in France, Germany, Sweden, the United Kingdom, and the Netherlands—are themselves childless. Their attitude, enshrined in a EU document as “no kids, no problem” represents a breathtaking shift in human affairs; it’s one thing to talk a good game about protecting the “next generation” in the collective abstract, another to experience being personally responsible for the future of another, initially helpless, human being.

Do As We Say, Not How We Live

The pressing need to change people’s lives seems intrinsic now to green theology. Without penance and penalties, after all, there is no redemption from original sin. In the process, it seems to matter little if we undermine the great achievements of our bourgeois economy—expanded homeownership, greater personal mobility, the ability to rise to a higher class—if it signals our commitment to achieve a more earth-friendly existence.

The left-wing theorist Jedidiah Purdy has noted that “mainstream environmentalism overemphasizes elite advocacy” at the expense of issues of economic equity, a weakness that both Trump and the GOP have exploited successfully, particularly in the Midwest, the South, and Intermountain West. Some greens object even to the idea of GDP growth at a time when most Americans are seeing their standard of living drop. No surprise then that the green agenda has yet to emerge from the basement of public priorities, which remain focused on such mundanities as better jobs, public safety, and decent housing.

To further alienate voters, many green scolds live far more lavishly than the people they are urging to cut back. Greens have won over a good portion of the corporate elite, many of whom see profit in the transformation as they reap subsidies for “green” energy, expensive and often ineffective transit and exorbitant high-density housing. Most notable are the tech oligarchs, clustered in ultra-green Seattle and the Bay Area, who depend on massive amounts of electricity to run their devices, but have reaped huge subsidies for green energy.

The tech oligarchs have little interest in family friendly suburbs, preferring the model of prolonged adolescence in largely childless places like college campuses and San Francisco. Oligarchs such as Mark Zuckerberg live in spacious and numerous houses, even while pressing policies that would push everyone without such a fortune to downsize. Richard Branson, another prominent green supporter, may not like working people’s SUVs, but he’s more than willing to sponsor climate change events on a remote Caribbean island reachable only by private plane. One does not even need to plumb the hypocrisy of Al Gore’s jet-setting luxurious lifestyle.

In the manner of Medieval indulgences these mega emissions-generators claim to pay for their carbon sins by activism, buying rain forests and other noble gestures. Hollywood, as usual, is particularly absurd, with people like Leonardo di Caprio flying in his private jet across country on a weekly basis. Living in Malibu, Avatar director James Cameron sees skeptics as “boneheads” who will have “to be answerable” for their dissidence, suggesting perhaps a shootout at high noon.

Summary

In the end, the greens and their wealthy bankrollers may find it difficult to prevail as long as their agenda makes people poorer, more subservient, and more miserable; this disconnect is, in part, why the awful Donald Trump is now in the White House. Making progress on climate change, and other environmental concerns, remains a critical priority, but it needs to explore ways humans, through ingenuity and innovation, can meet these challenges without undermining what’s left of our middle class and faded democratic virtue.

Another wheel flies off Ontario’s green energy bus

Updating Ontario’s energy debacle shows that Toronto and Ottawa have now achieved the highest electricity rates in Canada.  And a new wheel falling off the bus has crushed 340 jobs.  Kelly McFarland reports the news in Another wheel flies off Ontario’s green energy bus, and lands on 340 workers.

When former premier Dalton McGuinty visited the new Siemens Canada plant in Tillsonburg in 2011, he brushed aside protesters and boasted that the plant was part of the Liberal alternative energy plan that would “put us at the forefront in North America.”

The plant made windmill blades. Windmills were the future. Clean energy was what McGuinty’s two-year-old Green Energy Act was all about. It would free the province of old, dirty manufacturing and introduce new, cutting-edge jobs that would make Ontario the envy of the world.

Just six years later the plant is closing. Management says big changes in the wind industry make it no longer viable. The cutting edge plant that was to help lead Ontario into the Valhalla of a clean energy future can’t survive in a market that wants bigger blades.

Siemens Wind Power chief executive David Hickey was careful not to blame the Liberal change in plans for the Tillsonburg closing, but plenty of others were happy to. Companies like Siemens come for the subsidies, and when the subsidies disappear, so do they, said independent industry analyst Tom Adams. Ontario has poured so much into its green energy dream the market is saturated, he said. Hickey said the market is shifting west: Alberta and Saskatchewan are “the key opportunities of the future.”

The impact of all this virtue signaling falls on ratepayers. The detailed accounting is presented in It’s official: Toronto and Ottawa are now the most expensive cities for electricity

Ontario’s electricity price increases were more than double the national average.
Postmedia News

To get a sense of how much more Ontarians pay compared to the rest of the country, consider a comparison of monthly electricity bills between Toronto and Montreal, Canada’s two largest cities. In 2016, the estimated average monthly electricity bill (including taxes) for Torontonians was $201, or roughly $2,400 for the year. Residents of Montreal only paid an estimated $83 per month, or just under $1,000 per year. That’s an extra $1,400 a year that Montrealers can spend on other priorities because of lower electricity prices.

A large part of the blame rests on poor policy choices at Queen’s Park. One such policy has been the government’s poorly structured long-term contracts for renewable energy generation, like wind and solar. These contracts place ever-increasing costs on consumers, despite the fact that renewables accounted for only 6.8 per cent of electricity generation in 2016.

The province’s phase-out of coal-fired electricity has also proved costly and unnecessary. Indeed, noted environmental economist Ross McKitrick found that Ontario could have achieved the same environmental benefits of the phase-out (at one-tenth the cost) by simply completing the retrofitting of Ontario’s coal-fired plants.

Another issue is the imbalance between the supply and demand of electricity in the province. When the province’s energy generation exceeds demand, it must be exported — quite often at a loss — leaving Ontario ratepayers to cover the difference.

Summary

Does anyone remember the last time anything positive emerged from Ontario’s electricity industry, battered and bruised from 13 years of Liberal government manhandling? Hydro rates so punitive the Liberals have applied layer on layer of subsidies, borrowing the money or pushing debt onto future generations to do so. An estimated $45 billion extra in future costs so the government can reduce consumer bills now, as it campaigns for re-election. Billions lost selling power at a loss to the U.S., which will now be made easier by approval of a power line under Lake Erie.

Liberal energy strategy was always predicated on the belief that politicians could dictate to the market and control the outcome. Despite overwhelming evidence that governments do badly when they try to remove the freedom from free enterprise, Wynne and McGuinty ploughed ahead in their determination to impose their vision on Canada’s biggest province and most important economy. The result has been a catalogue of disasters. The $2 billion smart meter program that proved a bust at reducing demand; the gas plant construction projects halted in mid-campaign to protect a few Liberal seats; the doubling of consumer electricity bills; the army of windmills marching across vast expanses of rural Ontario, defacing the landscape while producing pricey, unneeded power.

Business Climate Advice

Climate Activists storm the bastion of Exxon Mobil, here seen without their shareholder disguises.

It’s not only big oil companies under siege from anti-fossil fuel activists. All businesses, small and large, private and publically traded are in the crosshairs.

Robert Bradley has a recent post directed at leaders of businesses, both large and small with respect to global warming/climate change. The article is Climate Alarmism and Corporate Responsibility at Master Resource. It is important advice since the large majority of business people are ethical and want to do the right thing, but their good intentions can be used against them in the current feverish media and political environment.

Everyone including business leaders needs to distinguish between two related but different threats from global warming/climate change. The first is the direct impacts upon one’s business and livelihood from natural conditions. The second is the indirect threat to prosperity from misguided public policies to “fight climate change.”

Climate Science: Where’s the Alarm?

On the outlook for the climate, of course there are both risks and opportunities to anticipate. Corporate plans typically involve assumptions and projections considered to be believable to a “reasonable person.” And as Bradley points out, no reasonable person can be expected to go beyond IPCC science, which is premised on concerns about global warming/climate change. Bradley:

Climate alarmism is not supported by the scientific reports of the Intergovernmental Panel on Climate Change (IPCC) on close inspection. There is no direct linkage between the IPCC finding that “the balance of evidence suggests a discernible human influence on climate” and climate alarmism. In fact, there is ample evidence in the scientific literature that the enhanced greenhouse effect is benign. Top climate economists have gone further to conclude that a warmer and wetter world predicted by climate models would produce net benefits in future decades for the United States and other areas of the world with the free market means to adapt. (my bold)

Corporate policymakers can discount climate alarmism by understanding several key arguments and facts:

  • Increasing atmospheric concentrations of carbon dioxide (CO2), the preeminent anthropogenic greenhouse gas, benefit plant life and agricultural productivity and are not a direct human health issue. It will be centuries before the plant optimum concentration is reached and exceeded, creating a long potential glide path for hydrocarbon energies to “green” planet earth. 
  • The surface warming (“greenhouse signal”) of recent decades shows a relatively benign distribution. Minimum (night, winter) temperatures have been increasing twice as much as maximum (daytime, summer) temperatures.[9] Higher nighttime temperatures and longer growing seasons reinforce the aforementioned carbon fertilization effect to aid plant growth and agricultural productivity.

  • Model-estimated warming from anthropogenic effects has fallen over time. . .The chart above shows IPCC (2007) projecting warming at 0.38C per decade and the last report (2013) dropped to 0.17 C per decade. With a more than 50 percent drop in the IPCC estimate in six years, there is clear evidence that model revision and more realistic forcing scenarios have weakened the alarmist scenario.

  • Today’s lower model-predicted warming estimates may still be too high. At the half way point of the feared doubling of the warming potential greenhouse gases in the atmosphere, the model scenarios are over predicting warming by a factor of two or more.

  • The two global temperature measurements from satellites and balloons in their two decades of existence have not picked up the “greenhouse signal” where it should be most pronounced or at least discernible—the lower troposphere. This suggests that surface thermometers may be overestimating warming and/or the surface warming is primarily the result of other factors than just the enhanced greenhouse effect (such as increased solar radiation). A natural warming trend neuters the case for climate alarmism.

  • The reduced growth rate of greenhouse gas buildup in the atmosphere in the last decade, as much as half the rate of some alarmist scenarios, extends the warming timetable to facilitate adaptation under any scenario. The reduced buildup is primarily related to greater carbon dioxide intake—the “greening of planet earth” phenomenon of robust carbon sinks.

  • Scientists who are confident about pinpointing the greenhouse signal from the surface temperature record have not substantiated a greenhouse signal with weather extremes. “Overall,” concluded the IPCC, “there is no evidence that extreme weather events, or climate variability, has increased, in a global sense, through the 20th century, although data and analyses are poor and not comprehensive.”


Business leaders have to balance the needs and interests of various stakeholders in the enterprise: principally the customers, the employees and the investors, as well as the larger society. Today’s social context presents the hazards of misguided public policies and regulations against fossil fuels, despite the unconvincing science case for them. The main risks are more expensive and unreliable power, more costly energy of all kinds, and a sluggish economy burdened with unnecessary expenses. To cope, Bradley makes some “no regrets” suggestions:

“No regret” policies—policies that are economical whether or not GHG emissions are worth addressing—should be pursued in their own right to help defuse the climate change issue. A prominent example is for businesses to profitably lower their energy usage wherever possible. Energy service companies in recent years have executed long-term contracts with guaranteed savings to completely manage the energy function of commercial and industrial users. Total energy outsourcing improves the allocation of core competencies and creates new incentives for optimal energy usage to benefit each party to the agreement.  (my bold)

Other pro-market “no regret” public policies that would have the effect of profitably reducing greenhouse gas emissions over time include:

  • Reducing criteria air pollutants in urban areas not in compliance with the Clean Air Act. 
  • Modernizing and simplifying the tax code to provide more incentives for capital-intensive businesses to modernize their physical capital, thus lowering energy usage and related GHG emissions. 
  • Maintaining incentives (or removing disincentives) for hydroelectric and nuclear power generation facilities that produce carbon-free electricity.Increasing energy conversion efficiencies of new electric generation capacity and a growing market share of natural gas-fired power relative to coal are natural market processes that will complement the above public policy reforms. Together, they will ensure that GHG emissions are not greater than their free market levels and will continue to fall per unit of output (the decarbonization phenomenon).

Summary

Agenda-driven climate alarmism should be rejected by corporate America on pragmatic and social responsibility grounds. Not only does the balance of evidence point toward net social benefits from a carbon dioxide enriched and moderately warmer and wetter world. Energy reality concludes that any short-term regulatory approach is futile and wasteful compared to perfecting business-as-usual strategies and using the wealth of energy abundance and free global markets to adapt to any weather and climate conditions in the future.


Resilient Arctic Ice


Source: NASA Worldview July 18, 2017. Click on image to enlarge.

July is showing again the resilience of Arctic ice this year. The graph below shows 2017 extents for the first 19 days of July compared to the average for the previous 11 years, to 2016, to 2007 and the SII (Sea Ice Index) estimates for 2017.

The graph shows 2017 holding to the decadal average and just yesterday dropping below 8M km2, one day ahead of average.  Meanwhile the other extents are much lower than 2017: 2016 is down 357k km2, 2007 is 379k km2 down, and SII shows 2017 480k km2 less than MASIE day 200.

As we shall see, this year’s extents are in surplus on the Atlantic side, offset by deficits on the Pacific side and in Hudson Bay.  The image shows the evolution of Arctic ice from 2007 to this year for day 200.

Click on image to enlarge.

The Table compares 2017 day 200 ice extents with the decadal average and 2007

Region 2017200 Day 200
Average
2017-Ave. 2007200 2017-2007
 (0) Northern_Hemisphere 7997823 8064957 -67133 7618029 379795
 (1) Beaufort_Sea 806596 819503 -12906 797272 9324
 (2) Chukchi_Sea 514591 619294 -104704 488952 25638
 (3) East_Siberian_Sea 744800 937942 -193142 707353 37447
 (4) Laptev_Sea 666317 584009 82308 455463 210854
 (5) Kara_Sea 321934 310630 11304 377648 -55714
 (6) Barents_Sea 74053 45893 28160 55933 18120
 (7) Greenland_Sea 478308 388587 89721 375816 102492
 (8) Baffin_Bay_Gulf_of_St._Lawrence 371429 238537 132893 278443 92986
 (9) Canadian_Archipelago 624373 685089 -60717 686749 -62376
 (10) Hudson_Bay 172045 258697 -86652 170690 1355
 (11) Central_Arctic 3222235 3173093 49143 3221912 323

2007 overall ice extent on day 200 was lower by 380k km2, 2017 showing surpluses everywhere except Kara and CAA (Canadian Arctic Archipelago).  Compared to the decadal average, the 2017 larger deficits are in the Pacific ( Chukchi and East Siberian) and in Canada (Hudson Bay and CAA).  These are offset by above average extents elsewhere, especially in Laptev, Greenland, Baffin and Central Arctic. Barents is still surplus to average, but has now fallen behind 2014 as the highest in the last decade.

The black line is average for the last 11 years.  2007 in purple appears close to an average year.  2014 had the highest annual extent in Barents Sea, due to higher and later maximums, holding onto ice during the summer, and recovering quickly.  In contrast, 2016 was the lowest annual extent, melting out early and recovering later.  2017 in blue started out way behind, but grew rapidly to reach average, and then persisted longer to exceed even 2014 before falling behind just recently.

For more on why Barents Sea matters see Barents Icicles