It’s Greta’s Worldview We Disavow

Nick Gillespie gets the focus right in his Reason article Think Globally, Shame Constantly: The Rise of Greta Thunberg Environmentalism. Excerpts in italics with my bolds.

Her future—and that of the planet—hasn’t been “stolen” and the best way forward is through serious policy discussion, not histrionics.

To say that reactions to Thunberg are as extreme as her rhetoric is an understatement. . . But despite the volume and vitriol of the attacks directed her way, it’s vitally important that the worldview she represents and the policies she espouses are refuted. Like Rep. Alexandria Ocasio-Cortez (D–N.Y.), Sen. Elizabeth Warren (D–Mass.), and a host of other American politicians, Thunberg believes that we’ve only got a few years left to settle the fate of the planet, a basic tenet pushed by supporters of the Green New Deal and by most of the Democrats running for president. In fact, Thunberg thinks that “cutting our emissions in half in 10 years,” the target invoked by many environmentalists, is too little, too late.

Such catastrophic thinking is similar to AOC’s equally apocalyptic statement that “The world is gonna end in 12 years” and Warren’s contention that “we’ve got, what, 11 years, maybe” to cut our emissions in half to save the planet. As Reason’s Ronald Bailey has documented:

Such predictions stem from a fundamental misreading of a 2018 report from the Intergovernmental Panel on Climate Change (IPCC).

That report offered up predictions in the growth of global economic activity, how it might be affected by climate change, and how reducing greenhouse gases might increase planetary GDP. It did not specify anything like a 10- to 12-year window after which extinction or amelioration is inevitable. Writes Bailey:

If humanity does nothing whatsoever to abate greenhouse gas emissions, the worst-case scenario is that global GDP in 2100 would be 8.2 percent lower than it would otherwise be.

Let’s make those GDP percentages concrete. Assuming no climate change and an global real growth rate of 3 percent per year for the next 81 years, today’s $80 trillion economy would grow to just under $880 trillion by 2100. World population is likely to peak at around 9 billion, so divvying up that GDP suggests that global average income would come to about $98,000 per person. Under the worst-case scenario, global GDP would only be $810 trillion and average income would only be $90,000 per person.

“There is no looming climate change ‘expiration date,'” writes Bailey, a point underscored by Bjorn Lomborg, president of the Copenhagen Consensus Center, which promotes cost-effective policies to remediate climate change, hunger, disease, and other global issues. Lomborg notes that the IPCC itself has found the evidence does not support claims that floods, droughts and cyclones are increasing.

What’s more, the scientists have found that current human-caused global warming cannot reasonably be linked to any of these extreme weather phenomenon-“globally, there is low confidence in attribution of changes in (cyclone) activity to human influence”, “low confidence in detection and attribution of changes in drought” and low confidence “that anthropogenic climate change has affected the frequency and magnitude of floods”. This doesn’t mean there is no problem-just that the facts matter.

There are only better and worse ways to deal with coming changes. Contra Thunberg, the better ways don’t demonize economic growth as a problem but as a solution. “The most inexorable feature of climate-change modeling isn’t the advance of the sea but the steady economic growth that will make life better despite global warming,” writes science journalist Will Boisvert. The environmental Kuznets curve, by which countries get wealthier and their citizens demand a cleaner environment, is the rule, not the exception. Such a dynamic is predicated upon economic and technological innovation that would be almost impossible under the sort of regulations promulgated by Green New Dealers and activists such as Thunberg and Naomi Klein, who wants to “decimate the entire neoliberal project” in the name of environmentalism. Environmental commons tend to deteriorate as countries begin to develop economically—but once per-capita income reaches a certain level, the public starts to demand a cleanup. It’s a U-shaped pattern: Economic growth initially hurts the environment, Bailey reminds us, but after a point it makes things cleaner. By then, slowing or stopping economic growth will delay environmental improvement, including efforts to mitigate the problem of man-made global warming.

Greta Thunberg’s histrionics are likely heartfelt but neither they nor the deplorable responses they conjure are a guide forward to good environmental policy in a world that is getting richer every day. For the first time in human history, half the earth’s population is middle class or wealthier and the rate of deaths from natural disasters is well below what it was even a few decades ago.

Protecting all that is just as important as protecting the environment and, more importantly, those two goals are hardly mutually exclusive.

Update: Children’s Climate Crusade

The Greta phenomenon is only the latest example of climate activists using children as human shields in their war against fossil fuels, as a previous post showed (reprinted below).  The satirical blog Bablyon Bee is on target with two skewers into recent events.  Firstly Marionette Strings Clearly Visible During Greta Thunberg Testimony  Excerpts in italics with my bolds.

NEW YORK, NY—Climate activist and adolescent Greta Thunberg gave a passionate speech at the UN Climate Action Summit in New York, declaring, “How dare you? You have stolen my dreams and my childhood with your empty words, and yet I’m one of the lucky ones. People are suffering. People are dying. Entire ecosystems are collapsing.”

“This is all wrong,” she declared, clearly on the verge of tears.

Savvy viewers, however, noticed there were marionette strings attached to the 16-year-old throughout her speech.

“Hey, wait a minute!” one attendee shouted. “Those are puppet strings, kinda like on Thunderbirds!” This caused some uproar, with everyone tracing the strings to see who had brainwashed this young girl into thinking the world was ending and pulling her strings. Some people got bored with the speech after that and just went and watched Thunderbirds, which had more interesting puppets and better acting.

Then there was this report on government action on climate change: Panel Of Third Graders To Dictate Nation’s Climate Change Policy  Excerpts in italics with my my bolds.

WASHINGTON, D.C.—At a panel on climate change held yesterday, the Senate brought in a group of excited third graders for ideas on fighting climate change.

“These kids have ideas and they are passionate, so we must listen to them,” said Sen. Brian Schatz of Hawaii. “There are no possible downsides to taking kids who have been told the world is ending by the public school system and allowing them to dictate national policies on important issues.

The kids came up with the following list so far, though they say they’re “just spitballing” and the ideas need some fleshing out:

  • Bribing the climate with cookies and candy
  • Putting the climate on time-out
  • Just ignoring climate change and playing Fortnite
  • Building a giant magnet and sucking up all the bad climate stuff
  • Buying a Nintendo Switch for every person in the nation (so they’ll stay inside and play Nintendo instead of driving cars)
  • Making a big freeze ray gun like in Despicable Me and shooting the climate
  • Pointing and laughing at cows who fart so they’ll be embarrassed and stop farting
  • Hey do you guys want to play some Minecraft? This is boring.

“It’s incredibly brave for these kids to volunteer to take over our government’s climate change policies,” said Schatz as the panel convened for its seventh Fortnite break of the morning. “I’m not sure why we didn’t think of this before.

The kids will also be asked to make policies on bedtime, homework, and candy.

Background from previous post Climate War Human Shields

In Massachusetts, four teenagers, the Conservation Law Foundation and the Mass Energy Consumer Alliance brought the climate action case to court. “The global climate change crisis is a threat to the well being of humanity, and to my generation, that has been ignored for too long,” said one of the young prosecutors, Shamus Miller.

On Tuesday, the Massachusetts (MA) Supreme Court mandated the MA Department of Environmental Protection (DEP) to promote impactful climate legislation. The court deemed that the DEP failed to uphold climate change agreements outlined in the Global Warming Solutions Act of 2008 and “requires the department to promulgate regulations that establish volumetric limits on multiple greenhouse gas emissions sources, expressed in carbon dioxide equivalents, and that such limits must decline on an annual basis.”

This case is in accordance with “youth around the country and internationally…bringing their governments to court to secure their rights to a healthy atmosphere and stable climate,” commented Julia Olson, executive director of Our Children’s Trust (an organization that helps youth fight “game-changing” legal battles around the world).Source: Planetexperts 

And who are the adults involved in  Our Children’s Trust?

Supporting Experts (the usual suspects)

Dr. James Hansen
Dr. Ove Hoegh-Guldberg
Dr. Sivan Kartha
Dr. Pushker Kharecha
Dr. David Lobell
Dr. Arjun Makhijani
Dr. Jonathan Overpeck
Dr. Camille Parmeson
Dr. Stefan Rahmstorf
Dr. Steven Running
Dr. James Gustave Speth
Dr. Kevin Trenberth
Dr. Lise Van Susteren
Dr. Paul Epstein (1943-2011)
Etc

Campaign Partners (Allies whose funding depends on CO2 Hysteria)

Climate Reality Project,
Western Environmental Law Center,
Crag Law Center,
Texas Environmental Law Center,
Cottonwood Environmental Law Center,
WildEarth Guardians,
Clean Air Council,
Global Campaign for Climate Action,
Chasing Ice,
Environmental Law Alliance Worldwide,
TERRA,
Sierra Club,
350.org,
Climate Solutions,
Greenwatch,
Center for International Environmental Law..
Greenpeace
etc.

Conclusion

This is as obscene as brainwashing young Muslims to be suicide bombers. Or terrorists hiding among families to deter the drone strikes. The fact that the kids are willing is no excuse.

Think of the children! How will they feel a decade from now when they realize they have been duped and exploited by activists who figured judges would be more sympathetic to young believers?

Gifted kids


Update June 24

Some addition background in response to questions from Frederick Colbourne.

Frederick, they are employing a creative approach to the “Public Trust Doctrine”. From their website:
“Specifically, these court decisions have rejected many legal defenses raised by our opponents, including non-justiciability, standing, separation of powers and sovereign immunity. In support of our youths’ positions, and in face of argument to the contrary, the courts have validated critical climate science and reserved for the courts the exclusive right to determine whether a particular commons resource is protected by the Public Trust Doctrine for benefit of present and future generations, and whether there has been a breach of that trust. Our cases are now progressing to the next phases where the courts will make those determinations relative to our atmosphere.”

Massachusetts is ripe for this legal suit because the state passed legislation endorsing the threat of climate change and subscribing to targets for reducing emissions.

From the Court decision: “the Climate Protection and Green Economy Act, G. L. c. 21N (statute)”
“The act established a comprehensive framework to address the effects of climate change in the Commonwealth by reducing emissions to levels that scientific evidence had suggested were needed to avoid the most damaging impacts of climate change. . .In accordance with these findings, the statute requires that, by 2050, greenhouse gas emissions be reduced by at least eighty per cent below 1990 levels. G. L. c. 21N, § 3 (b).”

Note that it was Massachusetts that acted to get EPA jurisdiction over GHGs. Again from the Court decision: “See also Massachusetts v. Environmental Protection Agency, 549 U.S. 497, 505 (2007) (petition by Massachusetts, with other States, local governments, and private organizations, arguing Environmental Protection Agency abdicated responsibility under Clean Air Act to regulate emissions of four greenhouse gases, including carbon dioxide).”

This legal strategy is along the lines of “Sue and Settle” tactic employed in the past to expand the regulatory scope of the EPA. Part of this latest charade is for the state to offer a token defense so that the court requires them to do what they want to do anyways, but now armed with additional ammunition against resisters.

Note also the bait and switch: Climate change is not at issue, it is all about meeting emissions targets.  It should serve also as a cautionary tale to any jurisdiction that thinks they can pass lip-service legislation and get away with politically-correct posturing.

Footnote for those not aware of Aliases for the Usual Suspects:

James “Death Trains” Hansen
Ove “Reefer Mad” Hoegh-Guldberg
Jonathan “Water Torture” Overpeck
Camille “The Extincter” Parmeson
Stefan “No Tommorow” Rahmstorf
Kevin “Hidden Heat” Trenberth

Childish Climate Power Play

The peformance by Greta at the UN sounded familiar to anyone who has raised children or grandchildren.  We knew first hand what was called the “terrible twos,” when sweet, adorable children frequently and all of a sudden acted out behaviors like:

  • Screaming
  • Temper tantrums
  • Kicking and biting
  • Fighting with siblings
  • Total meltdowns

Such behavior is a way of expressing the need for independence along with frustration at not being in control all the time.

Oftentimes the events involve ” I want, I want, I want”, just as Greta declared: “I want you to panic.”  And in addition there are all the “Greta Wannabes”:

It’s a peculiar and disturbing devlelopment when anyone, including a teenager, becomes a celebrity and attracts followers by being totally certain of something while being ignorant at the same time.  And then to use outbursts of emotional blackmail to tap adults’ guilt feelings:  “If you really loved me, you would do what I want”.  Instead of being grateful for living in a time with so many options and conveniences, what we get is “I will never forgive you for stealing my future.”

Hearing the applause from the UN audience indicated that the ruse is working, that the childish climate power play is successfully manipulating people who should know better from their greater education and life experience.

When I heard that Greta and friends are also launching a lawsuit, it reminded me of this:
Who knows what will happen next?  Here is what I am hoping for:


Energy Savings from Building Codes are Only Symbolic

Richard Tol posted at Climate Economics: How much energy do building code save?

Not nearly as much as expected, according to this paper by Arik Levinsohn. California has had building codes for energy since 1978, and they are tightened every so often. Levinsohn compares the energy use of buildings build before and after a code change, compares Californian houses to houses elsewhere in the USA, and compares the weather sensitivity of houses with different building codes. He finds that codes save energy, but the ex post estimates are lower than the ex ante ones on which the regulation was based.

Arik Levinsohn wrote at American Economic Review  How Much Energy Do Building Energy Codes Save? Evidence from California Houses 

Abstract

Regulations governing the energy efficiency of new buildings have become a cornerstone of US environmental policy. California enacted the first such codes in 1978 and has tightened them every few years since. I evaluate the resulting energy savings three ways: comparing energy used by houses constructed under different standards, controlling for building and occupant characteristics; examining how energy use varies with outdoor temperatures; and comparing energy used by houses of different vintages in California to that same difference in other states. All three approaches yield estimated energy savings significantly short of those projected when the regulations were enacted.

Footnote:  From Green New Deal promotional article:

Existing buildings hoover up about 40% of energy consumed in the U.S. and emit about 29% of greenhouse gases. The Green New Deal calls for retrofitting all of them—every last skyscraper, McDonald’s, and suburban ranch home—for energy efficiency within the next 10 years.

August SSTs Offset NH Warming

The best context for understanding decadal temperature changes comes from the world’s sea surface temperatures (SST), for several reasons:

  • The ocean covers 71% of the globe and drives average temperatures;
  • SSTs have a constant water content, (unlike air temperatures), so give a better reading of heat content variations;
  • A major El Nino was the dominant climate feature in recent years.

HadSST is generally regarded as the best of the global SST data sets, and so the temperature story here comes from that source, the latest version being HadSST3.  More on what distinguishes HadSST3 from other SST products at the end.

The Current Context

The chart below shows SST monthly anomalies as reported in HadSST3 starting in 2015 through August 2019.

A global cooling pattern is seen clearly in the Tropics since its peak in 2016, joined by NH and SH cycling downward since 2016.  In 2019 all regions had been converging to reach nearly the same value in April.

Now something exceptional is happening in NH rising almost 0.5C in the last three months, now exceeding previous summer peaks in NH since 2015.  Meanwhile the SH remains relatively cooler, and the Tropics not changing much.  Despite the sharp jump in NH, the global anomaly rose only slightly.

Note that higher temps in 2015 and 2016 were first of all due to a sharp rise in Tropical SST, beginning in March 2015, peaking in January 2016, and steadily declining back below its beginning level. Secondly, the Northern Hemisphere added three bumps on the shoulders of Tropical warming, with peaks in August of each year.  A fourth NH bump was lower and peaked in September 2018.  As noted above, July 2019 is matching the first of these upward bumps.

And as before, note that the global release of heat was not dramatic, due to the Southern Hemisphere offsetting the Northern one.  The major difference between now and 2015-2016 is the absence of Tropical warming driving the SSTs.

Note: The NH spike is unexpected since UAH ocean air tempts dropped sharply in July 2019 and remained cooler in August.  The discrpency between the two datasets is surprising since previously they were quite similar.


The annual SSTs for the last five years are as follows:

Annual SSTs Global NH SH  Tropics
2014 0.477 0.617 0.335 0.451
2015 0.592 0.737 0.425 0.717
2016 0.613 0.746 0.486 0.708
2017 0.505 0.650 0.385 0.424
2018 0.480 0.620 0.362 0.369

2018 annual average SSTs across the regions are close to 2014, slightly higher in SH and much lower in the Tropics.  The SST rise from the global ocean was remarkable, peaking in 2016, higher than 2011 by 0.32C.

A longer view of SSTs

The graph below  is noisy, but the density is needed to see the seasonal patterns in the oceanic fluctuations.  Previous posts focused on the rise and fall of the last El Nino starting in 2015.  This post adds a longer view, encompassing the significant 1998 El Nino and since.  The color schemes are retained for Global, Tropics, NH and SH anomalies.  Despite the longer time frame, I have kept the monthly data (rather than yearly averages) because of interesting shifts between January and July.

Open image in new tab to enlarge.

1995 is a reasonable starting point prior to the first El Nino.  The sharp Tropical rise peaking in 1998 is dominant in the record, starting Jan. ’97 to pull up SSTs uniformly before returning to the same level Jan. ’99.  For the next 2 years, the Tropics stayed down, and the world’s oceans held steady around 0.2C above 1961 to 1990 average.

Then comes a steady rise over two years to a lesser peak Jan. 2003, but again uniformly pulling all oceans up around 0.4C.  Something changes at this point, with more hemispheric divergence than before. Over the 4 years until Jan 2007, the Tropics go through ups and downs, NH a series of ups and SH mostly downs.  As a result the Global average fluctuates around that same 0.4C, which also turns out to be the average for the entire record since 1995.

2007 stands out with a sharp drop in temperatures so that Jan.08 matches the low in Jan. ’99, but starting from a lower high. The oceans all decline as well, until temps build peaking in 2010.

Now again a different pattern appears.  The Tropics cool sharply to Jan 11, then rise steadily for 4 years to Jan 15, at which point the most recent major El Nino takes off.  But this time in contrast to ’97-’99, the Northern Hemisphere produces peaks every summer pulling up the Global average.  In fact, these NH peaks appear every July starting in 2003, growing stronger to produce 3 massive highs in 2014, 15 and 16.  NH July 2017 was only slightly lower, and a fifth NH peak still lower in Sept. 2018.  Note also that starting in 2014 SH plays a moderating role, offsetting the NH warming pulses. (Note: these are high anomalies on top of the highest absolute temps in the NH.)

What to make of all this? The patterns suggest that in addition to El Ninos in the Pacific driving the Tropic SSTs, something else is going on in the NH.  The obvious culprit is the North Atlantic, since I have seen this sort of pulsing before.  After reading some papers by David Dilley, I confirmed his observation of Atlantic pulses into the Arctic every 8 to 10 years.

But the peaks coming nearly every summer in HadSST require a different picture.  Let’s look at August, the hottest month in the North Atlantic from the Kaplan dataset.
The AMO Index is from from Kaplan SST v2, the unaltered and not detrended dataset. By definition, the data are monthly average SSTs interpolated to a 5×5 grid over the North Atlantic basically 0 to 70N. The graph shows warming began after 1992 up to 1998, with a series of matching years since. Because the N. Atlantic has partnered with the Pacific ENSO recently, let’s take a closer look at some AMO years in the last 2 decades.
This graph shows monthly AMO temps for some important years. The Peak years were 1998, 2010 and 2016, with the latter emphasized as the most recent. The other years show lesser warming, with 2007 emphasized as the coolest in the last 20 years. Note the red 2018 line is at the bottom of all these tracks. The short black line shows that 2019 began slightly cooler, then tracked 2018, but has now risen to match previous summer pulses.

Summary

The oceans are driving the warming this century.  SSTs took a step up with the 1998 El Nino and have stayed there with help from the North Atlantic, and more recently the Pacific northern “Blob.”  The ocean surfaces are releasing a lot of energy, warming the air, but eventually will have a cooling effect.  The decline after 1937 was rapid by comparison, so one wonders: How long can the oceans keep this up? If the pattern of recent years continues, NH SST anomalies may rise slightly in coming months, but once again, ENSO which has weakened will probably determine the outcome.

Footnote: Why Rely on HadSST3

HadSST3 is distinguished from other SST products because HadCRU (Hadley Climatic Research Unit) does not engage in SST interpolation, i.e. infilling estimated anomalies into grid cells lacking sufficient sampling in a given month. From reading the documentation and from queries to Met Office, this is their procedure.

HadSST3 imports data from gridcells containing ocean, excluding land cells. From past records, they have calculated daily and monthly average readings for each grid cell for the period 1961 to 1990. Those temperatures form the baseline from which anomalies are calculated.

In a given month, each gridcell with sufficient sampling is averaged for the month and then the baseline value for that cell and that month is subtracted, resulting in the monthly anomaly for that cell. All cells with monthly anomalies are averaged to produce global, hemispheric and tropical anomalies for the month, based on the cells in those locations. For example, Tropics averages include ocean grid cells lying between latitudes 20N and 20S.

Gridcells lacking sufficient sampling that month are left out of the averaging, and the uncertainty from such missing data is estimated. IMO that is more reasonable than inventing data to infill. And it seems that the Global Drifter Array displayed in the top image is providing more uniform coverage of the oceans than in the past.

uss-pearl-harbor-deploys-global-drifter-buoys-in-pacific-ocean

USS Pearl Harbor deploys Global Drifter Buoys in Pacific Ocean

YouGov Climate Push Poll: Still no Believer Majority

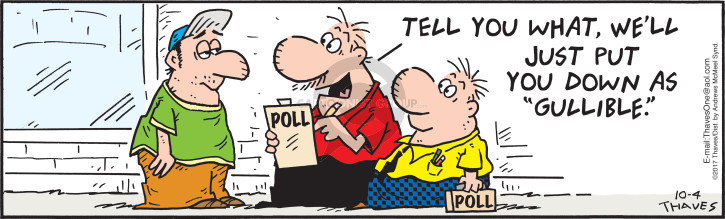
A new internatiional climate change poll shows most European countries as well Anglophone nations are divided between belief and scepticism over global warming claims.  The YouGov poll results are presented in part in the diagram below (H/T GWPF)

Lest there be any doubt:  This is a survey of opinions (beliefs) about global warming/climate change as buzzwords without any meaning defined as a reference for knowing why any response was given.  Further on is a reprint of a previous post describing the tactics for getting the highest possible affirmation of belief rather than scepticism.  Of course, it is important to know what was the survey methodology, i.e. how the questions were put, what answers were offered and/or accepted, and what context (if any) was given to participants.  For the YouGov International Survey the questioning went like this.

Thinking about the global environment… In general, which of the following statements, if any, best describes your view?

The climate is changing and human activity is mainly responsible
The climate is changing and human activity is partly responsible, together with other factors
The climate is changing but human activity is not responsible at all
The climate is not changing
Don’t know

Which countries, if any, do you think have had the most negative impact on global warming and climate change?  (Please tick up to five)

[Most frequently mentioned by Europeans were Brazil, China, India, Russia, USA, and Don’t know]

And do you think that you personally could be doing more to tackle climate change, or are you already doing as much as you reasonably can? Could be doing more/Doing as much as it reasonably can/Don’t know

How responsible, if at all, do you think each of the following are for the current situation with climate change?  Very responsible/Fairly/Not Very/Not Responsible at all/Dont’t know

International bodies (e.g. the United Nations)
National governments of wealthy countries
National governments of developing countries
Businesses and industry
Individuals

And how much power, if any, do you think each of the following have to combat climate change?
A great deal of power, a fair amount, Not very much, no power at all, Don’t Know

International bodies (e.g. the United Nations)
National governments of wealthy countries
National governments of developing countries
Businesses and industry
Individuals

How much of an impact, if any, do you believe climate change will have on your life?
A great deal of impact/ A fair amount, Not Much, No impact at all/Don’t know

Which of the following comes closest to your view?

It is already too late to avoid the worst effects of climate change
We are still able to avoid the worst effects of climate change but it would need a drastic change in the steps taken
We will be able to avoid the worst effects of climate change if we broadly carry on with the steps currently being taken
Don’t know

If you had to choose one, which approach would you prefer governments and societies to focus on more to tackle climate change?

One where we attempt to reduce consumption of resources to slow or halt the negative effects of climate change
One where we attempt to come up with technological solutions to try and counter the effects of climate change
Don’t know

How likely do you think it is that climate change will cause each of the following? Very likely/Quite/Not Very/Not at all likely/ Don’t know

The extinction of the human race
Small wars
A new world war
Serious damage to the global economy
Cities being lost to rising sea levels
Mass displacement of people from some parts of the world to others

For your information the table of Yougov climate questions and responses from various nations is here

Comment:  Note how belief in climate change and its human agency is assumed throughout the questioning process.  As discussed below, using “environmental” and “global” are AGW belief triggers.  And then asking which nations are most responsible for hurting the climate is akin to asking “Have you stopped beating your wife?” Note also that “tackling climate change” presumes humans caused it and can stop it by changing behavior.

Background from previous post The Art of Rigging Climate Polls

Marketing and social influence makers have used opinion surveys extensively to promote awareness, interest and motivation to engage with their products or preferred policies. I have written before on how this ploy is used regarding global warming/climate change (links at bottom). This post is prompted by a fresh round of climate polls and some further insight into how results are created to support a socio-political agenda.

Of course, any opinion poll on climate as a public policy matter is indicating how much of the blather in the media has penetrated public consciousness, and softened them up for political pitches and financial support. And the continuing samplings and reports need to show progress to keep activist hopes alive.

Just yesterday we had an announcement along these lines. Poll shows consensus for climate policy remains strong is published at Phys.org from Stanford U. (where else, home of the belated Stephen Schneider, among many other leading alarmists). Stanford also happens to be my alma mater, but when I was studying organic chemistry there, we knew life on earth was carbon-based and did not think CO2 was a pollutant.

Climate Public Opinion is a Program of Research by the Stanford Political Psychology Research Group (website link) and has done frequent surveys on the question: What do the residents of the United States believe about global warming?

From psy.org article (excerpts in italics with my bolds):

While the United States is deeply divided on many issues, climate change stands out as one where there is remarkable consensus, according to Stanford research.

“But the American people are vastly underestimating how green the country wants to be,” said Jon Krosnick, a professor of communication and of political science at Stanford, about new findings from a poll he led on American attitudes about climate change.

The study was conducted with ABC News and Resources for the Future, a Washington, D.C.-based research organization. A representative sample of 1,000 American adults nationwide were polled from May 7 to June 11, 2018. The margin of error is +/- 3.5 percentage points.

The poll showed that Americans don’t realize how much they agree about global warming: Despite 74 percent of Americans believing the world’s temperature has been rising, respondents wrongly guessed 57 percent.

“The majority doesn’t realize how many people agree with them,” said Krosnick. “And this may have important implications for politics: If people knew how prevalent green views are in the country, they might be more inclined to demand more government action on the issue.”

Public belief in the existence and threat of global warming has been strikingly consistent over the last 20 years, even in the face of a current administration skeptical about climate change,” said Krosnick, who has been tracking public opinion about global warming since 1995.

Krosnick has learned from his 20 year experience with this topic, and shares with us some of the tricks of the trade. For example, one paper provides their finding regarding the wording of questions.

1. “What do you think is the most important problem facing the country today?”

In this traditional MIP question, about 49 percent answered the economy or unemployment, while only 1 percent mentioned the environment or global warming.

2. “What do you think is the most important problem facing the world today?”

Substituting the word “country” with “world” produced a significant change: 7 percent mentioned environmental issues, while 32 percent named the economy or unemployment.

3. “What do you think will be the most important problem facing the world in the future?”

When asked to consider the future of the planet, 14 percent chose the environment or global warming, while economic issues slipped to 21 percent.

4. “What do you think will be the most serious problem facing the world in the future if nothing is done to stop it?”

This time, 25 percent said the environment or global warming, and only 10 percent picked the economy or unemployment.

“Thus, when asked to name the most serious problem facing the world in the future if nothing is done to stop it, one-quarter of all Americans mentioned either global warming or the environment,” Krosnick said. “In fact, environmental issues were cited more often in response to question 4 than any other category, including terrorism, which was only mentioned by 10 percent of respondents.”

Thus it is that survey results are influenced greatly by the design of the questioning process. Helpfully, the Stanford program provides this history of the questions put to participants over the years. Below are the result categories, some showing the evolving form of questioning, and others just the most recent form for brevity. I will comment on the first few, and leave the others for your reflection (my bolds)

1. Global warming is happening. 2012-2013: What is your personal opinion? Do you think that the world’s temperature probably has been going up over the past 100 years, or do you think this probably has not been happening? 2012: What is your personal opinion? Do you think that the world’s temperature probably has been going up slowly over the past 100 years, or do you think this probably has not been happening? 1997-2011: You may have heard about the idea that the world’s temperature may have been going up slowly over the past 100 years. What is your personal opinion on this? Do you think this has probably been happening, or do you think it probably has not been happening?

Fair question with both responses equally acceptable. The earlier form referred to what they may have heard, but wisely dropped that later on. One does wonder what evidence people use for 100 years of reference.

In a separate study Krosnick tested the effect of asking about “global warming” or “climate change” and concluded:
In the full sample, global warming, climate change, and global climate change were all perceived to be equally serious on average. These findings seem to be inconsistent with the claim that people view climate change or global climate change as less serious than global warming. In addition, the distribution of seriousness ratings were equivalent for global warming, climate change, and global climate change.

IMO it is to his credit that he asks about global warming rather than the vacuous “climate change”.

2.Warming will continue in the future. 2012: If nothing is done to prevent it, do you think the world’s temperature probably will go up slowly over the next 100 years, or do you think the world’s temperature probably will not go up slowly over the next 100 years?

Here comes the phrase:  If nothing is done to prevent it . . . The participant gets the suggestion that rising temperatures have human agency, that we can do something to prevent them. As Krosnick explained above, this phrase will help respondents identify the issue as “environmental” and tap their instinct to protect nature. Implanting this subliminal suggestion sets them up for the next question.

3. Past warming has been caused by humans. 2012: Do you think a rise in the world’s temperature is being caused mostly by things people do, mostly by natural causes, or about equally by things people do and by natural causes? 2012: Assuming it’s happening, do you think a rise in the world’s temperature would be caused mostly by things people do, mostly by natural causes, or about equally by things people do and by natural causes?

Now we have some serious distortions inserted into the findings. The end results will reported as “The % of Americans that believe past warming has been caused by humans.” Note that participants have been primed to think warming is preventable by humans, so obviously humans have caused it (logical connection). Moreover, there are the 50-50 responses that will be counted as human causation. The problem is, people who are mostly uncertain and unwilling to say “don’t know” will fall back to the “equally human, equally nature” response.  It is a soft, not affirmative response.

And a further perversion: Those who have said temperatures are not rising are now told to “Assume it is happening.” What? This is no longer an opinion, it is out-and-out speculation. It appears that “Don’t know” and “Not Happening” are disallowed to force a choice with a 67% chance of getting the right answer: “Caused by Humans.”

4.Warming will be a serious problem for the U.S. 2012: If nothing is done to reduce global warming in the future, how serious of a problem do you think it will be for THE UNITED STATES – very serious, somewhat serious, not so serious, or not serious at all? 2012: Assuming it’s happening, if nothing is done to reduce global warming in the future, how serious of a problem do you think it would be for THE UNITED STATES – very serious, somewhat serious, not so serious, or not serious at all?

Again the phrase “If nothing is done to reduce global warming. . .” signaling participants that this is a serious issue, so don’t come with “not so serious” or (God forbid) “not serious at all.” And again, global warming must be assumed to be happening by anyone still unconvinced of it.

5. Warming will be a serious problem for the world. 2012: If nothing is done to reduce global warming in the future, how serious of a problem do you think it will be for THE WORLD – very serious, somewhat serious, not so serious, or not serious at all? 2012: Assuming it’s happening, if nothing is done to reduce global warming in the future, how serious of a problem do you think it would be for THE WORLD – very serious, somewhat serious, not so serious, or not serious at all?

Same comments regarding #4 apply here, only as Krosnick explained, elevating the issue to a “world problem” triggers even more seriousness in responses.

6. Five degrees of warming in 75 years will be bad. 2011-2012: If the world’s average temperature is about five degrees Fahrenheit higher 75 years from now than it is now, overall, would you say that would be good, bad, or neither good nor bad? 1997-2010: Scientists use the term “global warming” to refer to the idea that the world’s average temperature may be about five degrees Fahrenheit higher in 75 years than it is now. Overall, would you say that if the world’s average temperature is five degrees Fahrenheit higher in 75 years than it is now, would that be good, bad, or neither good nor bad?

In the past, interviewers told participants that global warming is defined as 5 degrees warmer, which triggered “bad” as a response. Fortunately, that obvious bias was dropped, and now people are free to say good, bad or neither. Interestingly, this question is not emphasized in the reports, perhaps because it only gets around 50% “Bad”, even in alarmist places like New York and California.

7. The government should limit greenhouse gas emissions. 2012: As you may have heard, greenhouse gasses are thought to cause global warming. In your opinion, do you think the government should or should not limit the amount of greenhouse gasses that U.S. businesses put out? 2008-2011: Some people believe that the United States government should limit the amount of air pollution that U.S. businesses can produce. Other people believe that the government should not limit air pollution from U.S. businesses. What about you? Do you think the government should or should not limit air pollution from U.S. businesses?

Here the older form of the question was more balanced: Some people believe X, some people believe Y, what do you believe? However, the older question was about air pollution which confuses CO2 (natural plant food) with artificial chemicals. The recent question targets “greenhouse gases”, a term nowhere defined. Now the biased question: Greenhouse gases cause global warming, should the government reduce them? Duh!

8.U.S. federal government should do more to address global warming. 2012: How much do you think the U.S. government should do about global warming? A great deal, quite a bit, some, a little, or nothing? 2009-2011: How much do you think the U.S. government is doing now to deal with global warming? A great deal, quite a bit, some, a little, or nothing? 2008: Do you think the federal government should do more than it’s doing now to try to deal with global warming, should do less than it’s doing now, or is it doing about the right amount?

Note the shift from asking about Whether government should do more than now, to How much is government doing now, to present form: How much more should government do.  Compares with: “Have you stopped beating your wife?”

9. U. S. should take action regardless what other countries do. Do you think the United States should take action on global warming only if other major industrial countries such as China and India agree to do equally effective things, that the United States should take action even if these other countries do less, or that the United States should not take action on this at all?

IOW, Should the US wait for others and be a follower, not a leader? Duh!

Series of Government Policy Questions

The real reason for the survey is to develop support for government officials to impose climate policies upon the population. The flavor of these is below with few comments from me until the end.

10. For the next items, please tell me for each one whether it’s something the government should require by law, encourage with tax breaks but not require, or stay out of entirely. Each of these changes would increase the amount of money that you pay for things you buy.

Reduce greenhouse gas emissions by power plants. Favor lowering the amount of greenhouse gases that power plants are allowed to release into the air?

Favor a national cap and trade program. There’s a proposed system called “cap and trade.” The government would issue permits limiting the amount of greenhouse gases companies can put out. Companies that did not use all their permits could sell them to other companies. Companies that need more permits can buy them, or these companies can pay money to reduce the amount of greenhouse gases that other people or organizations put out. This will cause companies to figure out the cheapest way to reduce greenhouse gas emissions. This type of permit system has worked successfully in the past to reduce the air pollution that companies put out. For example, in 1990, the federal government passed a law like this, called the Clean Air Act, which caused companies to put out a lot less of the air pollution that causes acid rain. Would you favor or oppose a cap and trade system to reduce the amount of greenhouse gases that companies put out?

Tax breaks to produce renewable energy. Do you favor or oppose the federal government giving companies tax breaks to produce more electricity from water, wind, and solar power?

Tax breaks to reduce air pollution from coal. Do you favor or oppose the federal government giving tax breaks to companies that burn coal to make electricity if they use new methods to reduce the air pollution being released from their smokestacks?

Increase CAFE standards for cars. Favor building cars that use less gasoline?
Build electric vehicles. 2012: Building cars that run completely on electricity?

Build appliances that use less electricity. Favor building air conditioners, refrigerators, and other appliances that use less electricity?

Build more energy-efficient buildings. Favor building new homes and offices that use less energy for heating and cooling?

Tax breaks to build nuclear power plants. Do you favor or oppose the federal government giving companies tax breaks to build nuclear power plants?

Who Pays for all this? It is time for the turkeys to face the pilgrim with the hatchet. How willing are you to pay increased taxes to “fight global warming?”

Increase consumption taxes on electricity. Do you favor or oppose the federal government increasing taxes on electricity so people use less of it?

Most places, majorities of respondents were favorable, up to 80% in some states. Perhaps a tribute to relatively cheap electricity in the U. S.  They are blissfully unaware of what can happen to electricity rates, having been spared so far the “Ontario Experience.”

Increase consumption taxes on gasoline. Do you favor or oppose the federal government increasing taxes on gasoline so people either drive less, or buy cars that use less gas?

Nowhere does this get a majority favorable response. It ranges from 15% to 40%, with most places around 30% in favor of higher gasoline taxes.

And finally, how much do you care and how much do you know?

Warming is extremely important personally (and is likely to influence voting). How important is the issue of global warming to you personally – extremely important, very important, somewhat important, not too important, or not at all important?

Less than 17% of people say global warming is personally extremely important, and most places are under 10%

Highly knowledgeable about global warming. How much do you feel you know about global warming – a lot, a moderate amount, a little, or nothing?
Americans rate their global warming knowledge higher than other countries, going up to 60-70% claiming “Highly Knowledgeable.” Other country surveys would report 25% more typically.

Conclusion

An opinion poll is a mirror claiming to show us ourselves. All polls have error margins, and some are purposely bent to a desired distorted outcome.

In modern social democracies, polls and media are used to shape and report public opinions required by ruling elites to impose laws and policies unwanted by the people. A recent example was the distorted Canadian survey on carbon pricing used by Trudeau government to justify a carbon tax. That poll is deconstructed in a post Uncensored: Canadians View Global Warming.

Krosnick said that people taking his climate poll were surprised that the responses were not more skeptical of global warming claims. After seeing how the survey is put together, I am inclined to believe that participants and their neighbors are actually more skeptical than depicted in the results.  This showed up in the low numbers saying global warming is an important personal issue.  Despite agreeing with alarmist talking points, people seem to know this is about virtue signaling and tribal politics.  It is an “everywhere elsewhere” problem.

Finally, in the survey, Americans rate themselves as highly knowledgeable about global warming, up to 60-70% in some states. Other countries doing such climate surveys typically get about 25% of people saying that. For so many to be taken in by such a survey suggests that Americans’ actual knowledge of global warming is highly overrated.

Background:  Another Climate Push Poll

Climate Is a State of Mind
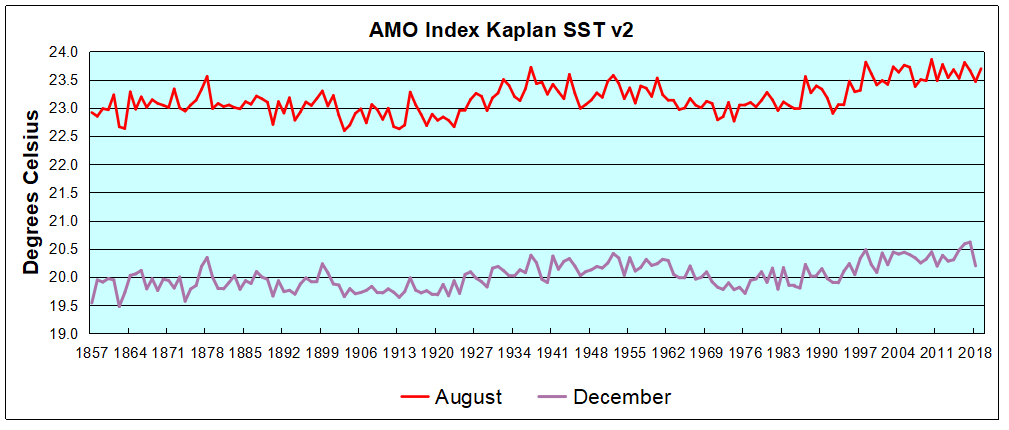
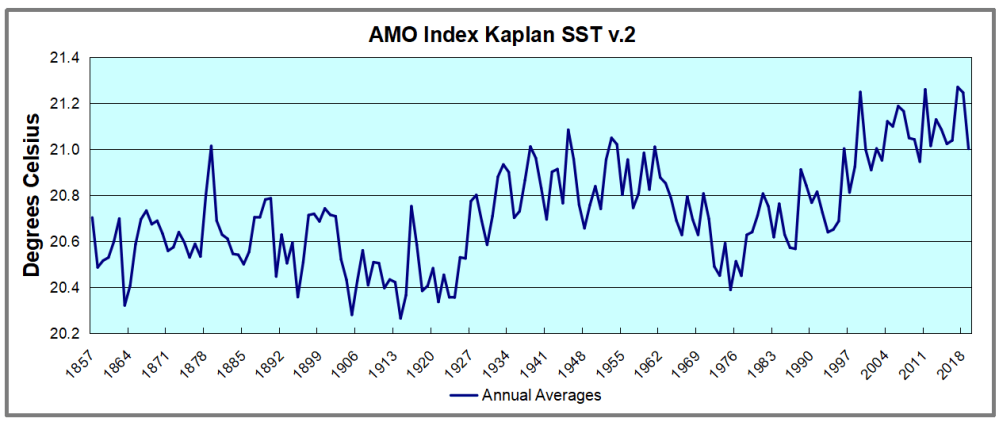
 

Global Warming Theory and the Tests It Fails


Many people commenting both for and against reducing emissions from burning fossil fuels assume it has been proven that rising GHGs including CO2 cause higher atmospheric temperatures.  That premise has been tested and found wanting, as this post will describe.  First below is a summary of Global Warming Theory as presented in the scientific literature.  Then follows discussion of several unsuccessful attempts to find evidence of the hypothetical effects from GHGs in the relevant datasets.  Concluding is the alternative theory of climate change deriving from solar and oceanic fluctuations.

Scientific Theory of  Global Warming

The theory is well described in an article by Kristian (okulaer) prefacing his analysis of  “AGW warming” fingerprints in the CERES satellite data.  How the CERES EBAF Ed4 data disconfirms “AGW” in 3 different ways  by okulaer November 11, 2018. Excerpts below with my bolds.  Kristian provides more detailed discussion at his blog (title in red is link).

Background: The AGW Hypothesis

For those of you who aren’t entirely up to date with the hypothetical idea of an “(anthropogenically) enhanced GHE” (the “AGW”) and its supposed mechanism for (CO2-driven) global warming, the general principle is fairly neatly summed up here.

I’ve modified this diagram below somewhat, so as to clarify even further the concept of “the raised ERL (Effective Radiating Level)” – referred to as Ze in the schematic – and how it is meant to ‘drive’ warming within the Earth system; to simply bring the message of this fundamental premise of “AGW” thinking more clearly across.
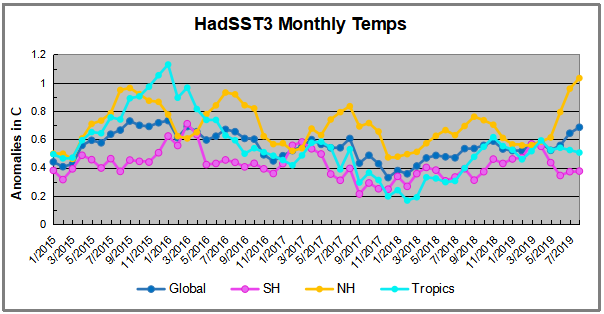
Then we have the “doubled CO2” (t1) scenario, where the ERL has been pushed higher up into cooler air layers closer to the tropopause:
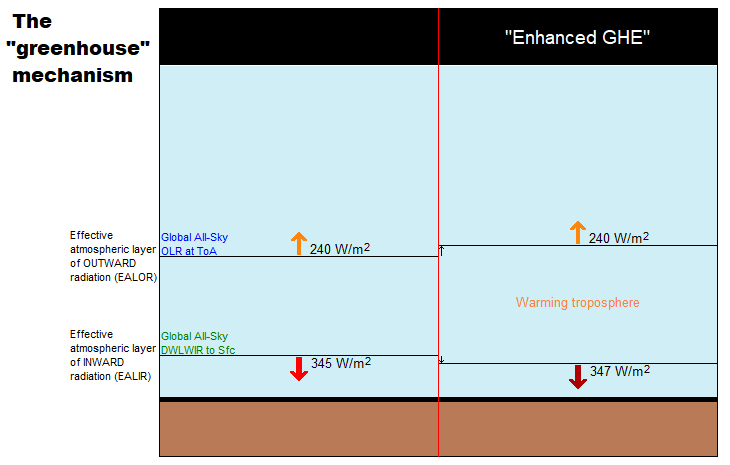
So when the atmosphere’s IR opacity increases with the excess input of CO2, the ERL is pushed up, and, with that, the temperature at ALL ALTITUDE-SPECIFIC LEVELS of the Earth system, from the surface (Ts) up through the troposphere (Ttropo) to the tropopause, directly connected via the so-called environmental lapse rate, i.e. the negative temperature profile rising up through the tropospheric column, is forced to do the same.

The Expected GHG Fingerprints

How, then, is this mechanism supposed to manifest itself?

Well, as the ERL, basically the “effective atmospheric layer of OUTWARD (upward) radiation”, the one conceptually/mathematically responsible for the All-Sky OLR flux at the ToA, and from now on, in this post, dubbed rather the EALOR, is lifted higher, into cooler layers of air, the diametrically opposite level, the “effective atmospheric layer of INWARD (downward) radiation” (EALIR), the one conceptually and mathematically responsible for the All-Sky DWLWIR ‘flux’ (or “the atmospheric back radiation”) to the surface, is simultaneously – and for the same physical reason, only inversely so – pulled down, into warmer layers of air closer to the surface. This latter concept was explained already in 1938 by G.S. Callendar. Feldman et al., 2015, (as an example) confirm that this is still how “Mainstream Climate Science (MCS)” views this ‘phenomenon’:

The gist being that, when we make the atmosphere more opaque to IR by putting more CO2 into it, “the atmospheric back radiation” (all-sky DWLWIR at sfc) will naturally increase as a result, reducing the radiative heat loss (net LW) from the surface up. And do note, it will increase regardless of (and thus, on top of) any atmospheric rise in temperature, which would itself cause an increase. Which is to say that it will always distinctly increase also RELATIVE TO tropospheric temps (which are, by definition, altitude-specific (fixed at one particular level, like ‘the lower troposphere’ (LT))). That is, even when tropospheric temps do go up, the DWLWIR should be observed to increase systematically and significantly MORE than what we would expect from the temperature rise alone. Because the EALIR moves further down.

Conversely, at the other end, at the ToA, the EALOR moves the opposite way, up into colder layers of air, which means the all-sky OLR (the outward emission flux) should rather be observed to systematically and significantly decrease over time relative to tropospheric temps. If tropospheric temps were to go up, while the DWLWIR at the surface should be observed to go significantly more up, the OLR at the ToA should instead be observed to go significantly less up, because the warming of the troposphere would simply serve to offset the ‘cooling’ of the effective emission to space due to the rise of the EALOR into colder strata of air.

What we’re looking for, then, if indeed there is an “enhancement” of some “radiative GHE” going on in the Earth system, causing global warming, is ideally the following:

OLR stays flat, while TLT increases significantly and systematically over time;
TLT increases systematically over time, but DWLWIR increases significantly even more.
Effectively summed up in this simplified diagram.

Figure 4. Note, this schematic disregards – for the sake of simplicity – any solar warming at work.

However, we also expect to observe one more “greenhouse” signature.

If we expect the OLR at the ToA to stay relatively flat, but the DWLWIR at the sfc to increase significantly over time, even relative to tropospheric temps, then, if we were to compare the two (OLR and DWLWIR) directly, we’d, after all, naturally expect to see a fairly remarkable systematic rise in the latter over the former (refer to Fig.4 above).

Which means we now have our three ways to test the reality of an hypothesized “enhanced GHE” as a ‘driver’ (cause) of global warming.

Three Tests for GHG Warming in the Sky

The null hypothesis in this case would claim or predict that, if there is NO strengthening “greenhouse mechanism” at work in the Earth system, we would observe:

1. The general evolution (beyond short-term, non-thermal noise (like ENSO-related humidity and cloud anomalies or volcanic aerosol anomalies))* of the All-Sky OLR flux at the ToA to track that of Ttropo (e.g. TLT) over time;
2. The general evolution of the All-Sky DWLWIR at the surface to track that of Ttropo (Ts + Ttropo, really) over time;
3. The general evolution of the All-Sky OLR at the ToA and the All-Sky DWLWIR at the surface to track each other over time, barring short-term, non-thermal noise.

* (We see how the curve of the all-sky OLR flux at the ToA differs quite noticeably from the TLT and DWLWIR curves, especially during some of the larger thermal fluctuations (up or down), normally associated with particularly strong ENSO events. This is because there are factors other than pure mean tropospheric temperatures that affect Earth’s final emission flux to space, like the concentration and distribution (equator→poles, surface→tropopause/stratosphere) of clouds, water vapour and aerosols. These may (and do) all vary strongly in the short term, significantly disrupting the normal temperature↔flux (Stefan-Boltzmann) connection, but in the longer term, they display a remarkable tendency to even out, leaving the tropospheric temperature signal as the only real factor to consider when comparing the OLR with Ttropo (TLT). Or not. The “AGW” idea specifically contends, resting on the premise, that these other factors (and crucially also including CO2, of course) do NOT even out over time, but rather accrue in a positive (‘warming’) direction.)

Missing Fingerprint #1

The first point above we have already covered extensively. The combined ERBS+CERES OLR record is seen to track the general progression of the UAHv6 TLT series tightly, both in the tropics and near-globally, all the way from 1985 till today (the last ~33 years), as discussed at length both here and here.

Since, however, in this post we’re specifically considering the CERES era alone, this is how the global OLR matches against the global TLT since 2000:
Figure 5.

This is simply the monthly CERES OLR flux data properly scaled (x0.266), enabling us to compare it more directly to temperatures (W/m2→K), and superimposed on the UAH TLT data. Watch how closely the two curves track each other, beyond the obvious noise. To highlight this striking state of relative congruity, we remove the main sources of visual bias in Fig.5 above. Notice, then, how the red OLR curve, after the 4-year period of fairly large ENSO-events (La Niña-El Niño-La Niña) between 2007/2008 and 2011/2012, when the cyan TLT curve goes both much lower (during the flanking La Niñas) and much higher (during the central El Niño), quickly reestablishes itself right back on top of the TLT curve, just where it used to be prior to that intermediate stretch of strong ENSO influence. And as a result, there is NO gradual divergence whatsoever to be spotted between the mean levels of these two curves, from the beginning of 2000 to the end of 2015.

Missing Fingerprint #2

The second point above is just as relevant as the first one, if we want to confirm (or disconfirm) the reality of an “enhanced GHE” at work in the Earth system. We compare the tropospheric temperatures with the DWLWIRsfc ‘flux’, that is, the apparent atmospheric thermal emission to the surface:

Figure 9. Note how the scaling of the flux (W/m2) values is different close to the surface than at the ToA. Here at the DWLWIR level, down low, we divide by 5 (x0.2), while at the OLR level, up high, we divide by 3.76 (x0.266).

We once again observe a rather close match overall. At the very least, we can safely say that there is no evidence whatsoever of any gradual, systematic rise in DWLWIR over the TLT, going from 2000 to 2018. If we plot the difference between the two curves in Fig.9 to obtain the “DWLWIR residual”, this fact becomes all the more evident:

Figure 10.

Remember now how the idea of an “enhanced GHE” requires the DWLWIR to rise significantly more than Ttropo (TLT) over time, and that its “null hypothesis” therefore postulates that such a rise should NOT be seen. Well, do we see such a rise in the plot above? Nope. Not at all. Which fits in perfectly with the impression we got at the ToA, where the TLT-curve was supposed to rise systematically up and away from the OLR-curve over time, but didn’t – no observed evidence there either of any “enhanced GHE” at work.

Missing Fingerprint #3

Finally, the third point above is also pretty interesting. It is simply to verify whether or not the CERES EBAF Ed4 ‘radiation flux’ data products are indeed suggesting a strengthening of some radiatively defined “greenhouse mechanism”. We sort of know the answer to this already, though, from going through points 1 and 2 above. Since neither the OLR at the ToA nor the DWLWIR at the surface deviated meaningfully from the UAHv6 TLT series (the same one used to compare with both, after all), we expect rather by necessity that the two CERES ‘flux products’ also shouldn’t themselves deviate meaningfully overall from one another. And, unsurprisingly, they don’t:

Figure 14.  Difference plot (“DWLWIR residual”)

Again, it is so easy here to allow oneself to be fooled by the visual impact of that late – obviously ENSO-related – peak, and, in this case, also a definite ENSO-based trough right at the start (you’ll plainly recognise it in Fig.14); another perfect example of how one’s perception and interpretation of a plot is directly affected by “the end-point bias”. Don’t be fooled:

If we expect the OLR at the ToA to stay relatively flat, but the DWLWIR at the sfc to increase significantly over time, even relative to tropospheric temps, then, if we were to compare the two (OLR and DWLWIR) directly, we’d […] naturally expect to see a fairly remarkable systematic rise in the latter over the former (refer to Fig.4 above).

Looking at Fig.14, and taking into account the various ENSO states along the way, does such a “remarkable systematic rise” in DWLWIR over OLR manifest itself during the CERES era?

I’m afraid not …

Four Lines of Evidence Against GHG Warming Hypothesis

The lack of GHG warming in the CERES data is added to three previous atmospheric heat radiation studies.


  1.  In 2004 Ferenc MIskolczi studied the radiosonde datasets and found that the optical density at the top of the troposphere does not change with increasing CO2, since reducing H2O maintains optimal radiating efficiency.  His publication was suppressed by NASA, and he resigned from his job there. He has elaborated on his findings in publications as recently as 2014. See:  The Curious Case of Dr. Miskolczi

2.  Ronan and Michael Connolly  studied radiosonde data and concluded in 2014:

“It can be seen from the infra-red cooling model of Figure 19 that the greenhouse effect theory predicts a strong influence from the greenhouse gases on the barometric temperature profile. Moreover, the modeled net effect of the greenhouse gases on infra-red cooling varies substantially over the entire atmospheric profile.

However, when we analysed the barometric temperature profiles of the radiosondes in this paper, we were unable to detect any influence from greenhouse gases. Instead, the profiles were very well described by the thermodynamic properties of the main atmospheric gases, i.e., N 2 and O 2 , in a gravitational field.”

While water vapour is a greenhouse gas, the effects of water vapour on the temperature profile did not appear to be related to its radiative properties, but rather its different molecular structure and the latent heat released/gained by water in its gas/liquid/solid phase changes.

For this reason, our results suggest that the magnitude of the greenhouse effect is very small, perhaps negligible. At any rate, its magnitude appears to be too small to be detected from the archived radiosonde data.” Pg. 18 of referenced research paper

See:  The Physics Of The Earth’s Atmosphere I. Phase Change Associated With Tropopause

3.  An important proof against the CO2 global warming claim was included in John Christy’s testimony 29 March 2017 at the House Committee on Science, Space and Technology. The text and diagram below are from that document which can be accessed here.

IPCC Assessment Reports show that the IPCC climate models performed best versus observations when they did not include extra GHGs and this result can be demonstrated with a statistical model as well.

Figure 5. Simplification of IPCC AR5 shown above in Fig. 4. The colored lines represent the range of results for the models and observations. The trends here represent trends at different levels of the tropical atmosphere from the surface up to 50,000 ft. The gray lines are the bounds for the range of observations, the blue for the range of IPCC model results without extra GHGs and the red for IPCC model results with extra GHGs.The key point displayed is the lack of overlap between the GHG model results (red) and the observations (gray). The nonGHG model runs (blue) overlap the observations almost completely.


An Alternative Theory of Natural Climate Change

Dan Pangburn is a professional engineer who has synthesized the solar and oceanic factors into a mathematical model that correlates with Average Global Temperature (AGT). On his blog is posted a monograph Cause of Global Climate Change explaining clearly his thinking and the maths.  I provided a post with some excerpts and graphs as a synopsis of his analysis, in hopes others will also access and appreciate his work on this issue.  See  Quantifying Natural Climate Change

Footnote on the status of an hypothetical effect too small to be measured:  Bertrand Russell’s teapot

Open image in new tab to enlarge.

Postscript:  For an explanation why CO2 has negligible effect on thermal properties of the atmosphere, and why all W/m2 are not created equal, see: Light Bulbs Disprove Global Warming

Beware the Climate Sirens Song

Greek mythology warned of seductive songs luring sailors to crash their ships upon the rocks.  Currently the climate sirens are singing loudly, filling the ears of captains of industries as well as ships of state.  Be forewarned of the latest example of disinformation coming again from IPCC.  Their fourth special report this  year will be a 900-page missive entitled, Special Report on the Ocean and Cryosphere in a Changing Climate, targeted for release to the general public for commentary on September 25.

CleanTechnica had a briefing and brings the message: The World’s Oceans Are Poised To Unleash “Misery On A Global Scale”  Some of the verses from this song in italics with my bolds.

  • Drastic onsequences if humanity does not reinvent how we produce and consume so we can avoid the worst ravages of climate change and environmental degradation.
  • Over the next 80 years, melting glaciers will alternately give too much and then too little fresh water to the multitudes who depend on them.
  • 30% of the northern hemisphere’s surface permafrost could melt by century’s end, unleashing billions of tons of carbon and accelerating global warming even more.
  • Destructive changes already set in motion could see a steady decline in fish stocks;
  • A 100-fold or more increase will occur in the damages caused by superstorms; and,
  • 100s of millions of people will be displaced by rising seas.
  • Acidification is disrupting the ocean’s basic food chain, and marine heatwaves are creating vast oxygen-depleted dead zones.
  • By 2050, many low-lying megacities and small island nations will experience “extreme sea level events” every year,
  • By 2100, “annual flood damages are expected to increase by two to three orders of magnitude,” or 100 to 1,000 fold,
  • Today’s small levels of migration have triggered political instability, while in the future tens of millions of people will be moving because the ocean is eating their land.

The words differ slightly, but the song remains the same:

For those wanting to keep their wits about them, here is some advice from Joel Kotkin writng in New Geography Common Sense Versus Climate Hysteria.  Excerpts in italics with my bolds.

Whether it’s fires in California or Brazil, hurricanes like Dorian or your summer hot spell, it’s not just weather anymore but a sign of the impending apocalypse.

This specter of imminent demise tied to the everyday, notes one American Psychological Association study, has induced “stress, depression and anxiety” among a wide part of the population. The Congress’ leading green advocate, Rep. Alexandria Ocasio-Cortez, admits her climate concerns often wake her up at 3:30 in the morning.

Of course, significant changes in the climate could well be afoot, but our “woke” media and its favored go-to expert class seem more prone to hysteric prophesizing than properly skeptical analysis.

After Katrina devastated New Orleans in 2005, some climatistas confidently predicted that it was harbinger of ever more powerful tropic storms, yet it was followed for 10 years by something of a “hurricane drought” that, sadly, may be at an end.

Little is said about anything that may alter the narrative, such as reports from the National Oceanic and Atmospheric Administration statistics show at most only minimal warming in the United States since 2005.

Few have heard that despite the recent fires in the Amazon, widely portrayed as part of a relentless incendiary burning tied to climate, as Mike Shellenberger notes, there’s been a 25 percent drop in fires globally since 2003; rather than burning up the forest, we have been planting more trees than harvesting them for over three decades.

And remember the California drought that Gov. Jerry Brown and his acolytes linked to climate change? That prolonged dry spell ended in a series of downpours, as it has for much of past 150 years.

The uses of apocalypse

The Catholic Church discovered millennia ago that the prospect of apocalypse provides a brilliant tool of propaganda. To people in the Middle Ages, observed historian Barbara Tuchman, “apocalypse was in the air,” the spawn of human sin. In much the same way the environmental movement links human material aspirations with impending disaster, citing manmade climate change as the singular explanation for everything from starvation, wars and crop failures to hurricanes, floods or any other unusual weather.

Unlike the medieval apocalypse, ours is cloaked in scientism, and is propelled to a certainty by computer models. Yet experience should engender some degree of skepticism — if history-challenged journalists knew different. One of the fundamental documents of modern environmentalism, the widely hailed 1972 Club of Rome report, predicted massive shortages of natural resources and the end of economic growth, claims generally accepted without skepticism in media, academic and political circles.

Yet energy and food subsequently became more plentiful than ever as the world has experienced the largest growth in affluence in its history.

Never called to account, greens and their allies can still follow the same mantra with predictable reliability. Upon the election of President Barack Obama in 2009, NASA’s James Hansen, one of the icons of the climate change movement, announced that the new chief executive had a bare “four years to save the Earth.” A year earlier ABC in 2008 claimed that Manhattan would be “under water” by 2015. None of these predictions, at least so far, have come true.

Hysteria leads to bad policy

The reinforced specter of imminent destruction increasingly drives the demand for ever more extreme policy choices. Climate researchers at Sweden’s Lund University and Oregon State University have proposed taxes on people who have children for their “carbon legacy,” even at a time of plummeting birthrates.

Part of the problem may stem from the complexity of the issue. The UN’s Intergovernmental Panel on Climate Change itself has suggested that climate prediction is difficult, if not impossible. Most of their projections are far less hysterical than those embraced by the media, which generally report only the most extreme predictions.

But the notion of an impending crisis is useful if you want to lobby for greater control of everyday life.

As one of the architects of the Green New Deal recently said, “Do you guys think of [the GND] as a climate thing? Because we really think of it as a how-do-you-change-the-entire-economy thing.” This proposal, echoed those recently offered by Bernie Sanders, would destroy jobs in many industries, such as aerospace and fossil-fuel energy, and force governments to compensate displaced workers.

Resilience and common sense

Common sense is really what we need. No amount of virtue-signaling by governments, celebrities, royalty or the media can make up for the fact that virtually all growth in greenhouse gases comes not from the West but from China, easily the world’s champion emitter, India and a host of poorer countries. Driving a Tesla or Prius is not going to change much, and many green-backed policies, such as in Germany and California , have done little, if anything, for the climate, but have succeeded in hurting middle- and working-class people far more than the affluent.

Given these realities, the logical course is to focus an intelligent economically sensible transition to a lower-carbon economy while pushing for resiliency measures to deal with the possible results of higher GHG emissions. Rather than seek to turn people into insect eaters and permanent apartment dwellers, perhaps we should push for measures in the new infrastructure bill before Congress to bolster coastal defenses, underground power lines, improve dams and water systems.

The future belongs not to the most self-righteous but the most adaptable.

This is gradually taking root in the policy discussion. After years of opposition, some environmentalists now accept that poorly managed forests in states like California must be trimmed to forestall massive firestorms. Others propose more expenditure on coastal walls, dispersed power systems, desalination plants and better storage of water.

The Netherlands provides a compelling role model here. After experiencing a massive flood in the 16th century, the Dutch embarked on a successful and extensive expansion of coastal berms to prevent future floods and bolstered their economy ever since. In contrast places that failed to address climate-related risks led to the decline of numerous cities in ancient Mesoamerica, the Indus Valley, Cambodia and, more recently, New Orleans.

Ultimately, the climate issue can be best addressed not by fueling anxiety but by adopting a practical and economically feasible approach. Quasi-religious hysteria may provide meaning for activists, but given the global nature of the problem, we need to address it not with panic but reason, and careful consideration about consequences, something in all too short supply today.

Joel Kotkin is the R.C. Hobbs Presidential Fellow in Urban Futures at Chapman University in Orange and executive director of the Houston-based Center for Opportunity Urbanism (www.opportunityurbanism.org)

Early Arctic Ice Minimum for 2019

The image shows Arctic ice thinning at the edges in the last 12 days up until day 249, when it appears to stabilize.  This would be an earlier minimum than average but comparable to some other years, including 2018.

The melting season in August and September up to yesterday shows 2019 below average but appearing to consolidate in the last few days.

Presently 2019 ice extent according to MASIE is 547k km2 below the 12 year average, having been 807k km2 in deficit just 7 days ago. The pace in recent days has flattened in comparison to the average, and is now matching where 2007 bottomed out. Another surprise is SII showing much more (~300k km2) ice extent than MASIE, and an even earlier bottom on day 247 compared to 249 for MASIE.  Note also that MASIE 2018 daily minimum was day 252.

It is also the case that most all regions have registered their 2019 minimums prior to day 253.  And as discussed below, the marginal basins have little ice left to lose.

The Bigger Picture 

We are close to the annual Arctic ice extent minimum, which typically occurs on or about day 260 (mid September). Some take any year’s slightly lower minimum as proof that Arctic ice is dying, but the image below shows the second week in September over the last 11 years. The Arctic heart is beating clear and strong.

These are weekly ice charts from AARI in St. Petersburg.  The legend says the brown area is 7/10 to 10/10 ice concentration, while green areas are 1/10 to 6/10 ice covered. North American arctic areas are not analyzed in these images.  Note how the distribution of sea ice varies from year to year, and how small was the extent after the 2012 Great Arctic cyclone.

Over this decade, the Arctic ice minimum has not declined, but since 2007 looks like fluctuations around a plateau. By mid-September, all the peripheral seas have turned to water, and the residual ice shows up in a few places. The table below indicates where we can expect to find ice this September. Numbers are area units of Mkm2 (millions of square kilometers).

Day 260 12 yr
Arctic Regions 2007 2010 2012 2014 2015 2016 2017 2018 Average
Central Arctic Sea 2.67 3.16 2.64 2.98 2.93 2.92 3.07 2.91 2.93
BCE 0.5 1.08 0.31 1.38 0.89 0.52 0.84 1.16 0.89
LKB 0.29 0.24 0.02 0.19 0.05 0.28 0.26 0.02 0.16
Greenland & CAA 0.56 0.41 0.41 0.55 0.46 0.45 0.52 0.41 0.46
B&H Bays 0.03 0.03 0.02 0.02 0.1 0.03 0.07 0.05 0.03
NH Total 4.05 4.91 3.4 5.13 4.44 4.2 4.76 4.56 4.48

The table includes three early years of note along with the last 5 years compared to the 12 year average for five contiguous arctic regions. BCE (Beaufort, Chukchi and East Siberian) on the Asian side are quite variable as the largest source of ice other than the Central Arctic itself.   Greenland Sea and CAA (Canadian Arctic Archipelago) together hold almost 0.5M km2 of ice at annual minimum, fairly consistently.   LKB are the European seas of Laptev, Kara and Barents, a smaller source of ice, but a difference maker some years, as Laptev was in 2016.  Baffin and Hudson Bays are inconsequential as of day 260.

For context, note that the average maximum has been 15M, so on average the extent shrinks to 30% of the March high before growing back the following winter.

N. Atlantic Weak August 2019 Pulse

RAPID Array measuring North Atlantic SSTs.

For the last few years, observers have been speculating about when the North Atlantic will start the next phase shift from warm to cold. Given the way 2018 went and 2019 is following, this may be the onset.  First some background.

. Source: Energy and Education Canada

An example is this report in May 2015 The Atlantic is entering a cool phase that will change the world’s weather by Gerald McCarthy and Evan Haigh of the RAPID Atlantic monitoring project. Excerpts in italics with my bolds.

This is known as the Atlantic Multidecadal Oscillation (AMO), and the transition between its positive and negative phases can be very rapid. For example, Atlantic temperatures declined by 0.1ºC per decade from the 1940s to the 1970s. By comparison, global surface warming is estimated at 0.5ºC per century – a rate twice as slow.

In many parts of the world, the AMO has been linked with decade-long temperature and rainfall trends. Certainly – and perhaps obviously – the mean temperature of islands downwind of the Atlantic such as Britain and Ireland show almost exactly the same temperature fluctuations as the AMO.

Atlantic oscillations are associated with the frequency of hurricanes and droughts. When the AMO is in the warm phase, there are more hurricanes in the Atlantic and droughts in the US Midwest tend to be more frequent and prolonged. In the Pacific Northwest, a positive AMO leads to more rainfall.

A negative AMO (cooler ocean) is associated with reduced rainfall in the vulnerable Sahel region of Africa. The prolonged negative AMO was associated with the infamous Ethiopian famine in the mid-1980s. In the UK it tends to mean reduced summer rainfall – the mythical “barbeque summer”.Our results show that ocean circulation responds to the first mode of Atlantic atmospheric forcing, the North Atlantic Oscillation, through circulation changes between the subtropical and subpolar gyres – the intergyre region. This a major influence on the wind patterns and the heat transferred between the atmosphere and ocean.

The observations that we do have of the Atlantic overturning circulation over the past ten years show that it is declining. As a result, we expect the AMO is moving to a negative (colder surface waters) phase. This is consistent with observations of temperature in the North Atlantic.

Cold “blobs” in North Atlantic have been reported, but they are usually winter phenomena. For example in April 2016, the sst anomalies looked like this

But by September, the picture changed to this

And we know from Kaplan AMO dataset, that 2016 summer SSTs were right up there with 1998 and 2010 as the highest recorded.

As the graph above suggests, this body of water is also important for tropical cyclones, since warmer water provides more energy.  But those are annual averages, and I am interested in the summer pulses of warm water into the Arctic. As I have noted in my monthly HadSST3 reports, most summers since 2003 there have been warm pulses in the north atlantic.

The AMO Index is from from Kaplan SST v2, the unaltered and not detrended dataset. By definition, the data are monthly average SSTs interpolated to a 5×5 grid over the North Atlantic basically 0 to 70N.  The graph shows the warmest month August beginning to rise after 1993 up to 1998, with a series of matching years since.  December 2016 set a record at 20.6C, but note the plunge down to 20.2C for  December 2018, matching 2011 as the coldest years  since 2000.  August 2019 is a weaker pulse matching 2017, lower than other peak years.  Because McCarthy refers to hints of cooling to come in the N. Atlantic, let’s take a closer look at some AMO years in the last 2 decades.

This graph shows monthly AMO temps for some important years. The Peak years were 1998, 2010 and 2016, with the latter emphasized as the most recent. The other years show lesser warming, with 2007 emphasized as the coolest in the last 20 years. Note the red 2018 line was at the bottom of all these tracks.  The short black line shows that 2019 began slightly cooler than January 2018, then tracked closely before rising in the last 3 months, though still lower than the peak years.

amo annual122018