Canada Govt. Aids and Abets Forest Fires

Traffic moves along One World Trade Center in New York City amid smokey haze from wildfires in Canada.Andy Bao / AP June 2026

Dr. Joseph Fournier explains the situation in his Daily Wire article Blame Canada’s Terrible Regulations For Wildfires Ruining America’s Summer.  Excerpts in italics with my bolds and added images.

It’s a perfect storm of the decline of local lumber industries
and the policies put in place to (mis)manage Canadian forests.

Americans often picture Canada as a vast northern forest — an endless expanse of pristine wilderness. But the truth is far more complex and increasingly relevant to U.S.–Canada policy debates. Eighty‑nine percent of Canada is Crown land, owned by federal or provincial governments. Yet only about 10–12% of that land receives detailed ecological monitoring.  This matters because U.S. trade policy, Canadian conservation policy, and federal herbicide permitting are now combining to reshape North America’s forests in ways few Americans recognize.

Over the past 20 years, Canada’s sawmill and pulp‑and‑paper sectors have entered a steep decline. Statistics Canada and industry reports show that mill closures have accelerated, especially in western Canada, where over 30% of softwood lumber capacity has disappeared. Employment has dropped sharply. Entire forestry towns have hollowed out.

And while multiple factors contribute — mountain pine beetle damage, wildfire losses, transportation bottlenecks — the most overlooked driver is the federal government’s long‑standing approval of spraying Roundup (glyphosate) herbicide across millions of hectares of Crown forests. For decades, glyphosate has been used to kill broadleaf species — birch, aspen, poplar — so that commercially valuable conifers can dominate.

But this practice has consequences. Roundup creates monoculture conifer stands, which are more resin‑rich and significantly more flammable than mixed‑species forests. Instead of diverse, moisture‑retaining ecosystems, Canada is producing vast tracts of single‑age, single‑species pine and spruce — exactly the kind of forests that burn explosively under extreme fire weather.

The result is a continental paradox: Policies meant to “manage” forests
have instead created more combustible landscapes,
contributing to the anomalous rise in total annual area burned.

The deterioration of Canada’s forests is also being accelerated by domestic policy. Rising carbon taxes on diesel and gasoline — critical fuels for logging, hauling, and mill operations — have increased costs across the supply chain. New layers of regulation slow approvals and reduce harvest flexibility. And when pulp mills close, sawmills lose buyers for residual chips and sawdust, further undermining their economics.

But the most consequential impact of this industrial contraction is ecological. Canada’s parklands — where monitoring exists — show a clear trend of rapidly aging boreal forests, with large stands now reaching 70 to 120 years old.

In Alberta’s eastern foothills, provincial parks contain dense, overmature, fuel‑loaded forests primed for high‑intensity wildfire. Decades of fire suppression, beetle kill, drought, and heavy recreational pressure have created extreme fire risk. As Parks Canada itself warns, “the reduction or exclusion of fire as a natural process … leads to increased risk of wildfires.”

The consequences are here. Alberta’s Jasper National Park recently nearly burned to the ground when extreme fire weather collided with decades of fuel accumulation, beetle‑killed forests, a highly vulnerable townsite, and infrastructure failures.

Nonetheless, long‑term fire data tell a more nuanced story.  According to Canada’s National Burned Area Composite and Canadian Interagency Forest Fire Centre wildfire statistics, forest‑fire frequency has declined since the 1980s. Canada is experiencing fewer fires overall.

What has changed is the total area burned, which had remained relatively moderate for decades but then spiked dramatically in 2023 and again in 2025, producing two of the worst years for fires in modern Canadian history.  These spikes reflect the dangerous combination of aging forests, heavy fuel loads, glyphosate‑driven monoculture, and extreme fire weather — not an increase in ignition frequency.

Meanwhile, federal biodiversity reports show that parks are not experiencing net improvement. Most ecosystems are stable, but among those changing, declines outnumber gains. And crucially, non‑park Crown lands are not monitored at all, meaning there is no empirical basis to claim that conservation designations improve biodiversity.

Yet Ottawa is moving ahead with its flagship 30×30 agenda — a plan
to place 30% of Canada’s land and water under conservation status by 2030.

In practice, this means restricting forestry across vast areas as forests age, become fuel‑loaded, and become increasingly prone to extreme fire behavior. By limiting private‑sector utilization, 30×30 will increase fuel loading, exacerbate forest aging, and reduce thinning and harvesting activities that mitigate catastrophic wildfire risk.

For Americans concerned about lumber prices or wildfire smoke drifting south, the lesson is simple. Canada’s forests are increasingly unmanaged, aging, and burning, not because Canadians don’t care, but because the economic and policy frameworks governing those forests are pushing the country toward less active management.

North America needs forestry — not just parks — to remain resilient.

Joseph Fournier, Ph.D., has worked in the energy industry and environmental sciences and is a member of the CO2 Coalition, Fairfax, Virginia. He writes from his family’s ranch east of Calgary.

See Also:

Canada Wildfires: Manage Forests or Lose Them


Extreme Weather and Climate Change Dashboard (Pielke Jr.)

Roger Pielke Jr. has created a monitor at his THB (The Honest Broker) blog applying scientific and statistical rigor to detection of US Extreme Weather and Climate Change.  All the details and methodology are provided in his blog post US Extreme Weather and Climate Change Dashboard.

Overview

The THB US Extreme Weather and Climate Change Dashboard follows the Intergovernmental Panel on Climate Change’s (IPCC) framework for detecting a change in climate in the context of internal variability. This dashboard tracks 32 variables associated with 7 types of extremes: heat waves, tornadoes, flooding, drought, winter storms, wildfire, and hurricanes. The site presents data for the full range of data judged to be of sufficient quality for trend analysis, and on each page for each phenomena, users can choose the time frame over which to observe the data. This is ongoing work in progress – Suggestions welcome!

Detecting a change in climate is not the same as spotting a trend in a time series — it’s demonstrating that a trend is unlikely to have arisen from natural internal variability by chance alone. Here that means two things:

♦  First, detecting a trend at IPCC’s stated example threshold of below 10% (via the nonparametric Mann-Kendall test).

♦  Second, because a long, low-noise record can show a statistically significant trend as a result of internal variability, this dashboard adds another check before identifying a detected change: the trend’s magnitude must also be a meaningful share (this site’s threshold: at least 25%) of the variable’s historical variability. A trend can be identified in a time series and still not count as a detected change here for that reason: flooding’s trend, for example, is statistically real (p=0.011) but is only about 4% of its typical week-to-week range, and not at all unexpected.

This combined standard — IPCC’s likelihood criterion plus this site’s
magnitude check on trends — is what “detected change” means.

Each tile above shows a variable’s reliable-trend-window data at a glance and its detected-change verdict — click through to that variable’s phenomenon page for the full interactive chart, an adjustable time window, PNG/CSV downloads, and alternative metrics. Full definitions and caveats are documented on the Methodology page. A side-by-side comparison of how IPCC AR6 has characterized each hazard, and how it compares to this site’s findings, can be found on the Detection & Attribution page.

Detection and Attribution

This dashboard focuses only on detection, following the IPCC’s own framework for detecting a change in climate. The IPCC’s definitions are below (Glossary, AR5/AR6/SR15, “Detection and Attribution”), and are applied throughout this site.

  • Climate: “The average weather, or more rigorously, the statistical description in terms of the mean and variability of relevant quantities over a period of time ranging from months to thousands or millions of years.”
  • Climate change: “A change in the state of the climate that can be identified (e.g., by using statistical tests) by changes in the mean and/or the variability of its properties, and that persists for an extended period, typically decades or longer.”
  • Detection: “The process of demonstrating that climate or a system affected by climate has changed in some defined statistical sense, without providing a reason for that change. An identified change is detected in observations if its likelihood of occurrence by chance due to internal variability alone is determined to be small, for example, <10%.”
  • Attribution: “The process of evaluating the relative contributions of multiple causal factors to a change or event with a formal assessment of confidence.” This dashboard performs detection only — it does not attempt attribution, which requires separate causal/model-based analysis this project hasn’t undertaken.

Background Resources

Devious Climate Attribution Studies

X-Weather Attributions by Pseudo-Scientists

US States Locking Two Zero Energy Back Doors

Frank Lasee writes at CFACT on state legislatures acting to block climate lawfare: Shutting the two back doors to Net Zero expenses. Excerpts in italics with my bolds and added images.

For years, activists pushing net-zero energy policy have lost where it counts. Voters reject higher power bills. Legislatures refuse to ban natural gas. Congress will not pass a carbon tax, so they moved to the two venues a determined minority can still control: local governments and the courtroom.

CFACT has set out to close both doors to the Green Left.

Working directly with legislative sponsors, we advanced two model bills before ALEC, the American Legislative Exchange Council’s Energy, Environment and Agriculture Task Force. Both were received warmly by the task force members at their recent meeting in Orlando, Florida (July 22-24), who will now carry them home to their states.

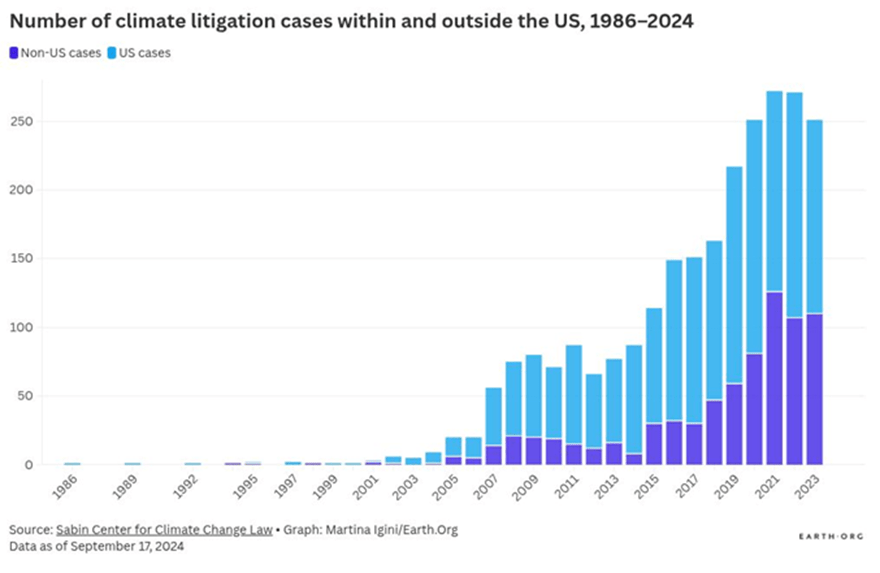
The first, the Energy Producers and Consumers Protection Act, led by Rep. Reagan Paul, Maine, shuts the courthouse door. Across the country, trial lawyers and city attorneys have discovered that if you cannot regulate energy producers out of business, you can try to sue them out of business instead. There are about 40 climate lawsuits around the country right now.

They file public nuisance claims, climate superfund actions, and fraud suits
that ask a single judge to blame one company for global atmospheric
conditions, all over a product that was legal to make and sell.

Our bill ends the game. It sets liability for lawful emissions at zero dollars unless a plaintiff can prove an actual violation of the federal Clean Air Act; it bars local governments from filing or funding these suits; and it prohibits the retroactive climate superfund schemes that states like New York and Vermont have used to hand energy producers enormous bills for products sold legally years ago.

This is not a fringe idea. It builds directly on laws already enacted in Utah, Iowa, Oklahoma, and Tennessee. Our model takes the strongest provisions from each and assembles them into one bill any state can adopt.

Suing over climate change: Taking fossil fuel companies to court

The second bill, the Local Government Net Zero Policy Prohibition Act, led by Rep. Thomas Peterson (Utah), shuts the city hall door.

Counties, school districts, and public universities have quietly become
some of the most aggressive climate regulators in the country.

They adopt net-zero targets, write carbon preferences into their purchasing contracts, pay dues to activist consortia like ICLEI and C40 Cities, and commit taxpayer money to programs that make no measurable difference to the global climate while raising costs for the families they serve.

Our bill stops it. Local governments will no longer spend public funds chasing net-zero mandates, and they may no longer join the climate lawsuits described above.  The bill protects real efficiency. Towns can still buy LED streetlights, weatherize buildings, and choose cheaper vehicles. What they cannot do is spend public money for political emissions targets. If it saves money, do it. If it only serves a political goal, do not bill the taxpayer.

Taken together, the two bills form a single strategy. One keeps activists from writing energy policy through the procurement office. The other keeps them from writing it through the courtroom. Both rest on the same principle.

In a self-governing republic, energy policy should be made by the people’s elected representatives in the legislature, not by trial lawyers seeking a payday or by unelected local boards answering to national pressure campaigns.

Every successful climate lawsuit and every local net-zero mandate lands on consumers who never voted for them. Affordable, reliable energy is not a luxury — it is the foundation of every community goal.

The momentum is real. Four states have already enacted versions of the litigation shield, and Florida has led the way on reining in local climate mandates. With these two models now in front of ALEC legislators, the path is open for many more states to follow.

CFACT will keep working with lawmakers to see these bills through. The activists changed venues because they were losing. We intend to make sure they keep losing, in the legislature, in the courtroom, and in city hall alike. This will benefit you by keeping those costs out of your wallet.


Observed State of the Climate 2025 (Humlum)


Ole Humlum published his annual summary The State of the Climate 2025 Global and Arctic Based on Real Observations*.  Synopsis below with my bolds and added images.

Abstract

Real observations show a slight decrease of global temperature in 2025 compared with the previous ten years. Some stations in the Arctic show warming, but most are fairly stable. The Arctic Ocean is cooling to considerable depth, while the tropical and Antarctic oceans have a slight surface warming. The sea level trend is not changing as IPCC model data indicate. The Arctic September sea ice varies but its area has the last 4 years been much larger than modelled by the IPCC. The average snow cover on the Northern Hemisphere is fairly constant during the last 50 years. The number of tropical cyclones varies, but with no clear trend. The integrated cyclonic energy shows some periodic variations, but no trend. Global precipitation has almost zero trend. The global cloud cover decreased from 64 % to 61 % from 1985 to 2020. At the same time the global temperature increased 0.7 °C, suggesting a possible relation. The observed sequence: first warming the of the sea surface, then the deeper sea, atmosphere and land suggests that the Sun is the source of warming, modulated by clouds, and there is no manmade climate catastrophe in the foreseeable future.

1. Introduction

The United Nations Secretary General, António Guterres on July 27, 2023, declared: The era of global boiling has arrived. We have a huge climate crisis. There is a good reason to study the available climate data to see if that is true. In the following we will compare data for 2025 with previous years and look for trends of this claimed extreme warming and accompanying weather extremes. We found no sign of a coming climate crisis.

Before I started this survey, I asked my helpful AI to make some images illustrating a) Changing
Climate, b) Natural climate change, and c) Good climate change and d) Man made climate change.
The pictures are shown on the next page.

They give a good idea of what the public is told about climate and climate change and that mankind is destroying it, as stated by the UN Secretary General. In this extended abstract I present a short status for the atmospheric and ocean temperatures, sea level, sea ice, sea level, snow, wind and storms, precipitation and global cloud cover.

My talk can be seen at https://www.youtube.com/watch v=85puIDVyBgc. Monthly updates of climate data are available at my website: http://www.climate4you.com.

2. Atmospheric temperatures

Figure 2: The average temperature of the year 2025 versus last 10 years

The average change is -0.24 °C and is more a sign of cooling than warming. A warning: The use of just one number, the average change in global temperature, hides the fact that our planet has various temperature regions which may show a different change than the average. In 2025 we observe that the Southern Africa has cooled 3.4°C, while Greenland and Northeast Canada have warmed 3.0 °C. The use of averages tends to hide important details.

3. Ocean temperatures

The general impression of the global sea temperatures is that they follow the radiation pattern of the Sun, with a maximum surface temperature in Equator regions and colder water towards the poles. At the deep bottom of both Polar Oceans we find, to our surprise, permafrost regions.

If we look at data for the Argo Ocean temperature surveys for the oceans from 0 to 1900 m depth, from 2004 to 2021, we find that the average temperature of the global oceans has increased from 6.42 to 6.47 °C. However, if we look at different oceans: the Circum-Arctic oceans are cooling, while the Circum-Equator oceans are warming – but only near the surface level. The CircumAntarctic oceans show warming down to 500 m. This is illustrated in Figure 4.

Much is still to be learned about the oceans! We should focus on local and regional values instead
of global averages and should not overinterpret published values.

4. Sea level

The satellite observations refer to a global model of the sea surface of the oceans. It is far more relevant to study the traditional sea level observations in coastal areas where people live. An important measuring station is Korsør in Denmark, which is in a geologically very stable area with no uplift or sinking. Measurements since 1897 in Figure 5, shows a linear trend of +0.83 mm/year. This means an estimated sea level rise of about 10 cm in 2150.

Figure 5: Sea level measurements in Korsør, Denmark. A geologically stable location.

5. Sea iceThe future of the Arctic Sea ice is rather serious according to the last IPCC report. Some scenarios
predict practically ice-free conditions in September from 2050 as shown in Figure 7. But observations show that for the last 4 years the sea ice area has been considerably higher than forecasted
by the models.

Figure 7: Arctic minimum sea ice (September) from last IPCC report (2021) with observed areas for 2022- 2025 (blue circles).

[Note: See the linked paper for Humlum’s point on Snow, Wind and Storms, and Global Precipitation, all of which show unalarming trends.]

8. Cloud cover – and a few reflections

If all clouds were suddenly removed, then our planet would gain about 17 W/m2 in solar radiation
and become warmer. In the period 1982-2019 we have observed a decrease in cloud cover from
64 % to 61 %. This means that the Earth has received significantly more solar radiation. This may
well be the main explanation for the observed temperature increase of about 0.7 °C during this
period, as shown in Figure 11.

Figure 11: Global cloud cover and global temperature in the period 1982 – 2019.

Climate scientists admit that they cannot model the cloud cover in a reliable way. It is simply not possible to trustworthy model small scale phenomena as evaporation and condensation, for use in global climate models.

There are many additional parameters that may act on the cloud cover. For instance, if we study the changes in the Earth’s rotation, which we measure as the length of the day, we find that it was 2 milliseconds longer in 1980 than it is today. The faster rotation mirror decreasing cloud cover and decreasing humidity. Thus, it is therefore entirely possible that these parameters in some ways are related. Much is still to be learned about global cloud cover.

8.1 Some reflections

The principal question was this: Are we currently in a climate crisis?
1. The observed average global air temperature change during the last 40+ years is about
+0.16°C per decade. If unchanged, the additional average global air temperature increase
by year 2100 will be about +1.15°C. However, part of the temperature increase reported may be caused by administrative changes, and the real future increase may therefore be smaller.

2. Tide gauges along coasts indicate a typical global sea level increase of about 1-2 mm/yr.
Coastal sea level change rate last 100 year has essential been stable, but with periodic variations. If unchanged, global sea level at coasts will typically increase 8-16 cm by year 2100, although many locations in regions affected by glaciation 20,000 years ago, will experience a relative sea level drop.

3. Since 2004 the global oceans above 1900 m depth have on average warmed about 0.037°C
(do not overinterpret). The maximum warming (about 0.2 °C, 0-100 m depth) mainly affects oceans near Equator, where incoming solar radiation is at maximum.

If we look at the Earth’s climate on geological time scales of millions of years, it is surprisingly
stable. In most periods it is stable and warm – about 25 oC on average, and in some periods, it is
about 10 degrees colder, as we observe now. It seems that the planet has a thermostat that keeps
the climate between these limiting temperatures. Today, our planet is well situated in between
these limits, and there is no reason to think that we are in a climate crisis.

8.2 Nature provides us with simple answers

In a simple way, observed data shows us what really controls the global air temperature. We just need to use our common sense and examine the sequence of temperature changes. Measurements (Figure 12) tell us that the global temperature signal originates at the ocean surface. Two weeks later the signal is recorded by satellites in the lower atmosphere. The land surface air temperature also follows the ocean surface temperature with a delay of two months, and 20 months later the signal is recorded in the ocean at 200 m depth. This sequence was first described by Humlum et al. (2012) and demonstrates the key role for ocean surface temperature in controlling atmospheric temperatures.

Figure 12:The sequence of global climate signal from the sea surface (SST) to the deep ocean.

The hypothetical CO2 temperature signal originates in the upper troposphere, and – if dominant –
we would see the signal in the satellite data from the lower atmosphere, before we see the signal
arriving at the ocean surface. Measurements show that the opposite is the case (Figure 12). To the
degree CO2 influences atmospheric temperatures, its effect is clearly subordinate in relation to
other influences.

9. Climate Change: importance of oceans

I have two overall conclusions and one suggestion for what should be the future main climate
research focus:

1. Observed data do not support the notion of a climate crisis but reveals many and partly
recurrent natural variations.
2. Ocean surface temperature controls the atmospheric temperature.

The principal climate research question therefore is this: What controls the ocean surface temperature? Presumably, the Sun is the key answer, modulated by the global cloud cover.

Source: Nelson and Nelson (2024) Decoupling CO2 from Climate Change

Primary Error Impairing Electric Power Systems

Bryan Leyland explains the basic mistake threatening society’s energy platform in his article at Climate Depot. Electricity Markets & Engineering Realities.  Text in italics with my bolds and added images.

‘It is telling that while [solar & wind] developers routinely claim their energy is now the cheapest available, they never argue that subsidies are therefore no longer needed’

The prime objective of any modern power system is to deliver a reliable and economic supply over the long term, whereas the prime objective of any market system is to maximize profit. For electricity markets to work, their rules must reward those who best provide reliable, affordable power.

Many electricity systems are managed by markets that focus on minimizing day-to-day prices, operating on the blind assumption that low prices today will guarantee a reliable supply tomorrow. This assumption is wrong. A power system is a complex, interconnected machine that forms the lifeblood of a modern economy. It must deliver stable power at the lowest cost, not just today, but decades into the future. Systems governed by short-term markets have repeatedly failed to do this.

The fundamental error is treating electricity as a commodity
like any other. It is not.

Electricity must be generated at a rate that exactly matches demand, second by second, while keeping frequency and voltage within tight limits. The system must survive major disturbances — generator failures, transmission faults, and the rapid fluctuations inherent in wind and solar output. When it cannot, catastrophic cascading collapse becomes inevitable, as Spain recently demonstrated.

TSO data shows the point just after 12:30 on Monday 28 April when Spain’s electricity grid collapsed. When the collapse occurred, the Spanish electrical grid had almost 80% renewable generation, 11% nuclear, and only 3% natural gas. There was practically no base generation or physical inertia to absorb the shock that was generated. Source: Red Eléctrica

Any system that subjects its customers to
price spikes, blackouts, and unstable supply is
incompatible with a functioning modern economy.

Current plans for future power supply increasingly rely on “demand side management” — a phrase that amounts to an admission that, when generating capacity falls short, consumers will be forced to reduce consumption. This ignores hard lessons from unreliable systems elsewhere: when electricity is scarce, many businesses don’t curtail operations — they shut up shop or buy diesel generators. The latter results in higher costs and higher emissions, the opposite of what was intended.

An ideal power system is built around reliability, security, stability,
and long-term least-cost design for the system as a whole.

These qualities can only be achieved through rigorous engineering — careful long-term planning, comprehensive analysis of worst-case conditions, and the kind of disciplined foresight that experienced power engineers bring. When a system works well, success is invisible: the lights stay on, business operates efficiently, and everyone’s expectations are quietly met. Failure, by contrast, is expensive and political dynamite.

Other factors — profit, market share, political targets, public perception — are legitimate considerations, but they are secondary. When they dominate over providing a reliable and economical supply, problems follow.

Short-term electricity markets are structured to optimize generation based on prices set by generators – the organizations that also control the supply. When there is surplus capacity, prices crash to zero. When there is a shortage, prices spike. As two departing New Zealand electricity executives openly acknowledged, the way to make money in the local market is to keep the system on the edge of shortage. This creates a perverse incentive: underinvestment in capacity becomes a profit strategy. High prices and forced demand reductions become routine features rather than emergency exceptions.

Short-term markets place little value on long-term resilience,
adequate reserve capacity, energy storage, or system stability.

The result is chronic underinvestment in precisely the assets that keep systems secure. The growing concentration on intermittent wind and solar compounds this problem, which is exacerbated by the fact that intermittent generation gets paid at the same rate as reliable generation. While wind and solar generation is often cheap at the station gate, the full system cost — backup capacity, storage, grid reinforcement — is borne by consumers, not by the owners of intermittent plant.

Multiple independent analyses confirm the pattern: the higher the share of wind and solar on a system, the higher the ultimate cost to consumers. This fact has escaped many industry leaders in New Zealand.

Wind and solar development in most countries is driven heavily by political incentives and substantial subsidies. It is telling that while developers routinely claim their energy is now the cheapest available, they never argue that subsidies are therefore no longer needed. Without those subsidies, intermittent renewables would play a modest role in large-scale power generation.

When providing a reliable and economic supply is no longer treated as
prime requirements, the risks don’t disappear — they are simply deferred.

Language shifts to conceal the retreat: “reliability” becomes “acceptable risk”; shortages become “price signals”; engineering constraints become “obstacles to be managed.” The system drifts, steadily and quietly, away from everything that underpins it.

The solution is not to abandon markets, but to redesign them around what the power system and the economy actually need. Long-term system performance — not short-term price — must guide both investment and operation. Engineers must be empowered to speak plainly about risks ahead, and their warnings must be taken seriously before failures occur rather than after.

If we want a reliable and affordable power system, we must make that a non-negotiable requirement. Markets should be the enabler of that goal, not the driver that overrides it. Ignore this reality, and high prices and shortages are not a risk — they are a certainty.

Bryan Leyland MSc, DistFEngNZ, FIMechE, FIEE(rtd) is a power systems engineer with 65 years experience in New Zealand and in many overseas countries.

Super El Nino Coming! Or not.

Many headlines proclaiming lots of warming with the current La Nina ending.  Some examples from the usual suspects:

El Niño is coming, chances rising it will be historically strong,  CNN
What Makes This Year’s Super El Niño the Strongest in 140 Years?,  Science Times
Weather experts warn of ‘super’ El Niño. Here’s what could happen,. USA Today
Here’s What The Super El Niño Means In Your State, Weather.com

After all, warmists need warming to justify their narrative, and people attending outdoor sporting events in NH are noticing how cool it is presently.  So hope abounds for a great reversal in coming months, while leaving unstated that oceanic cycles are a natural climate driver unaffected by CO2 emissions.

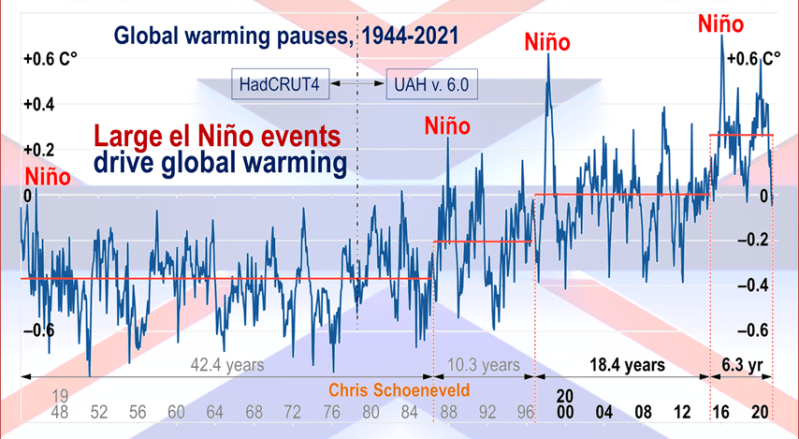
Importantly, the theory of human-caused global warming asserts that increasing CO2 in the atmosphere changes the baseline and causes systemic warming in our climate. On the contrary, the graph above shows all of the warming since 1947 was episodic, coming from three brief El Nino events associated with oceanic cycles. And in 2024 we saw an amazing episode with a temperature spike driven by ocean air warming in all regions, along with rising NH land temperatures, now dropping well below its peak.

Is a Super El Nino Coming?  Yes and No.

The certainty in the headlines is speculative and exaggerated.  The Climate Prediction Center is more circumspect and unbiased.  The forecast is here: ENSO Alert System Status: El Niño Watch  Synopsis in italics with my bolds and added images.

El Niño is likely to emerge soon (82% chance in May-July 2026)
and continue through Northern Hemisphere winter 2026-27
(96% chance in December 2026-February 2027).

In the past month, ENSO-neutral conditions continued, as indicated by near-average sea surface temperatures (SSTs) in the east-central equatorial Pacific Ocean [Fig. 1].

The latest weekly Niño-3.4 index value was +0.4°C, with the westernmost (Niño-4) and easternmost (Niño-1+2) indices at +0.5°C and +1.0°C, respectively [Fig. 2]. The equatorial subsurface temperature index (average from 180°-100°W) increased for the sixth consecutive month [Fig. 3], with widespread, significantly above-average subsurface temperatures across the equatorial Pacific [Fig. 4]. Westerly wind anomalies were observed over the western equatorial Pacific at low levels and were evident over the central and east-central Pacific at upper levels. Convection was near average on the equator near the Date Line and was suppressed around Indonesia [Fig. 5]. Collectively, the coupled ocean-atmosphere system reflected ENSO-neutral conditions.

The North American Multi-Model Ensemble (NMME) average, including the NCEP CFSv2 [Fig. 6], favors El Niño to form by next month and persist through Northern Hemisphere winter 2026-27.

While confidence in the occurrence of El Niño has increased since last month, there is still substantial uncertainty in the peak strength of El Niño, with no strength categorization exceeding a 37% chance [Figs. 7 & 8].

The strongest El Niño events in the historical record are characterized by significant ocean-atmosphere coupling through the summer, and it remains to be seen whether this occurs in 2026. Stronger El Niño events do not ensure strong impacts; they can only make certain impacts more likely (see CPC outlooks for probabilities of seasonal anomalies). In summary, El Niño is likely to emerge soon (82% chance in May-July 2026) and continue through Northern Hemisphere winter 2026-27 (96% chance in December 2026-February 2027).

Warming in Nino 3.4 index in 2026.

This discussion is a consolidated effort of the National Oceanic and Atmospheric Administration (NOAA), NOAA’s National Weather Service, and their funded institutions. Oceanic and atmospheric conditions are updated weekly on the Climate Prediction Center web site (El Niño/La Niña Current Conditions and Expert Discussions). A probabilistic strength forecast is available here. The next ENSO Diagnostics Discussion is scheduled for 11 June 2026.


SCOTUS Tariff Ruling Better Than It Seems


Jeff Childers explains some hidden features of the ruling, overlooked by both cheerleaders and detractors, in his blog article Tariff Turnabout.  Excerpts in italics with my bolds and added images. H/T David A.

SCOTUS struck down Trump’s IEEPA tariffs 6-3. He signed a replacement
in 90 minutes. Why this “devastating loss” was actually
a firewall, a machete, and two shields for conservatives.

Within hours of yesterday’s SCOTUS decision, the New York Times had jubilantly published no fewer than eight euphoric top-of-fold stories, and was still going strong. Democrats were sprinting (or racing their wheelchairs) to podiums to issue slaphappy praises for Justices they’ve long been complaining were Trump’s stooges. One of the Times’s tamer stories bore the gleeful headline, “The Supreme Court’s Declaration of Independence.

The reason progressives were more excited than a new puppy yesterday is that they correctly perceive that President Trump’s tariffs are the economic engine behind America’s booming economy. Stop the tariffs, they reckon, and then the economy will fizzle out— and Trump will become a spent force. It was a good plan. Too bad it failed.

The media’s attention span is measured in picoseconds.
On the other hand, the Supreme Court is playing a long game.

This decision was a gift to the country, wrapped in a leather binder and tied with a bow. I realize that’s a bold claim given all the media’s post-touchdown celebrating, but I will explain why they’re wrong in terms that even Portland, Oregon’s residents can understand.

Far from corporate media’s simplistic analysis, this decision was a firewall, a machete, and two shields— one for President Trump and one for the Court.

In its decision yesterday, the Nation’s Highest Court seemed to hand progressives everything they’d hoped for. It clarified a badly worded trade statute called the International Emergency Economic Powers Act, or IEEPA— the legal engine powering most of Trump’s Tariff Dashboard.

Specifically, they noted that the word “tariff” does not appear anywhere in IEEPA. The majority mused that tariffs can’t just be intuited from the loose statutory language like a fortune teller predicting your Aunt Bethanie will soon make a love connection.

But … despite all the over-the-top rhetoric tossing around overheated phrases like “devastating blow” and “major setback,” there was a grenade in the progressive gift basket. The Supremes did not actually say Trump must shut down the Tariff Dashboard. Just the opposite. In fact, in a dissenting opinion that the President loved —Trump read parts of it aloud to reporters at an afternoon presser— Justice Kavanaugh helpfully listed four other statutes Trump could use to keep the Dashboard humming.

Before the ink was dry on the press room briefings —90 minutes after the SCOTUS order issued— Trump signed a new executive order replacing the IEEPA tariffs with Kavanaugh’s suggested alternative statutes. For good measure, Trump used one of the alternatives to impose a temporary 10% across-the-board tariff placeholder, and still had a little time left over to squeeze out a quick Truth Social post only slightly longer than The Rise and Fall of the Roman Empire.

90 minutes to work up a new executive order? Come on. That was a stage wait.
They obviously had Plan B ready to go without skipping a beat
.

We will focus on a key moment from November’s oral arguments that lifts the curtain, letting us see what’s really happening behind the scenes. In paraphrase, at page 69 in the transcript, Justice Gorsuch asked:

If we let THIS president use IEEPA for tariffs, what stops the NEXT president from declaring a climate emergency and taxing gas-powered pickup trucks out of existence?

Here’s the thing: don’t miss this. When Gorsuch asked him about the peril of future presidents, the DOJ’s lawyer —Trump’s lawyer— agreed. If IEEPA allows Trump tariffing, then a future Democrat president could also use it, for whatever insane progressive agenda they felt like, just by declaring a “state of emergency.” Nobody disputed that; everybody agreed.

The Firewall.

And that, as they say, was that. The ambiguously worded statute was a disaster waiting to happen, like handing a chimpanzee a live grenade, or worse, giving a toddler a permanent marker. When they stripped tariffs from IEEPA, Justices Gorsuch, Roberts, and Barrett weren’t betraying  Trump. They were protecting America from the next Democrat president —a Warren or Newsom— declaring a climate emergency and using IEEPA to impose the Green New Deal by fiat.  So they built a firewall.

And so here’s where we are: while the Court slowly considered it, it let President Trump use IEEPA for almost 8 months to get his Tariff Dashboard up and humming. Headline from Fortune, back in January.

But the firewall was just the appetizer.
Now behold the two shields and the machete.

The Shield for Trump.

The three rock-ribbed conservatives, Thomas, Alito, and Kavanaugh, wrote spirited dissents pre-empting Democrats from complaining that Trump’s use of IEEPA was ‘totally illegal’ and unconstitutional. In other words, three Justices made a forceful, substantive, unqualified case that the President did have tariff authority under IEEPA. Meaning, this was, at worst, a legitimate legal disagreement, and not any lawless power grab.

It neutralized the sting of the majority opinion. Instead of a weaponized decision rebuking Trump as an out-of-control dictator, Democrats got a 6-3 split with a 40-page dissent explaining exactly why the 2025-26 tariffs could have —in good faith— been considered legal. Womp womp.

The dissenters handed Trump an ironclad rhetorical shield
to deflect Democratic criticism over his first eight months of IEEPA tariffs.

The Shield for the Court.

The decision likewise provided SCOTUS cover for new political possibilities. Yesterday’s jubilant headlines praised the Supreme Court’s “independence,” “grit,” and “defiance.” According to corporate media, SCOTUS just handed Trump a “devastating loss.” And President Trump is earning an Oscar playing the wounded victim like nobody’s business. Wall Street Journal, yesterday:

The President vented rage and vexation toward the three conservative Justices who voted against him. Meanwhile, across town, unflappable Treasury Secretary Scott Bessent sang a completely different tune. “Our estimates show that the use of Section 122 authority, combined with potentially enhanced Section 232 and Section 301 tariffs,” the Secretary calmly explained, “will result in virtually unchanged tariff revenue in 2026.”

Across the oceans, foreign countries think nothing will change either. Wall Street Journal headline, this morning:

So the Court earned applause from media midwits —political capital— while not actually harming Trump’s agenda in any way.

The Machete.

The majority’s legal reason for chopping out IEEPA’s tariff power was actually another gift to conservatives— a sharpened machete. Since 2022 or so, the Court has been sharpening a legal rule called the “Major Questions Doctrine” (MQD), which basically says the Executive Branch can’t just ‘read between the lines’ or ‘fill in the gaps’ of statutes, even if they are badly written or ambiguous.

MQD is widely considered a revolutionary tool that could finally clear the ungovernable wilderness of the administrative state— a goal conservatives have longed for since the FDR days.

Even sharper after yesterday’s decision, MQD provides that if a statute doesn’t say something, executive agencies like the EPA or CDC can’t regulate into existence what are essentially new laws. For example, SCOTUS first used the muscular new version of Major Questions to strike down Biden’s OSHA mandate forcing businesses with more than 100 employees to require the jabs.

Had yesterday’s decision swung the other way, had SCOTUS let Trump extrapolate tariffs from IEEPA, it would have undermined the terrific MQD machete, which is one of the Roberts Court’s most important restrictions on future Democrat presidents. After this decision, the MQD is even stronger. Swing away, boys. Chop, chop.

Corporate media has already been calling it “Trump’s Court.” Let’s say the Court planned to rule in the President’s favor on something really big. It might need a loss on the record first, to show the Court isn’t just another rubber stamp on President Trump’s desk. Now consider what else is floating down the SCOTUS pipeline.

Over the next few months, the Court will make several seismic decisions:

  • Birthright citizenship— which could forever end birth tourism.
  • Section 2 of the Voting Rights Act— which could add up to 27 additional Republican House seats.
  • Fed Independence and Firing of Agency Heads— which could give President Trump de facto control of the Federal Reserve.

The birthright case alone could reset the political board. Restricting automatic citizenship to only children of existing citizens would create a “mess,” just like the tariff decision did. And it’s coming The Center Square, yesterday:

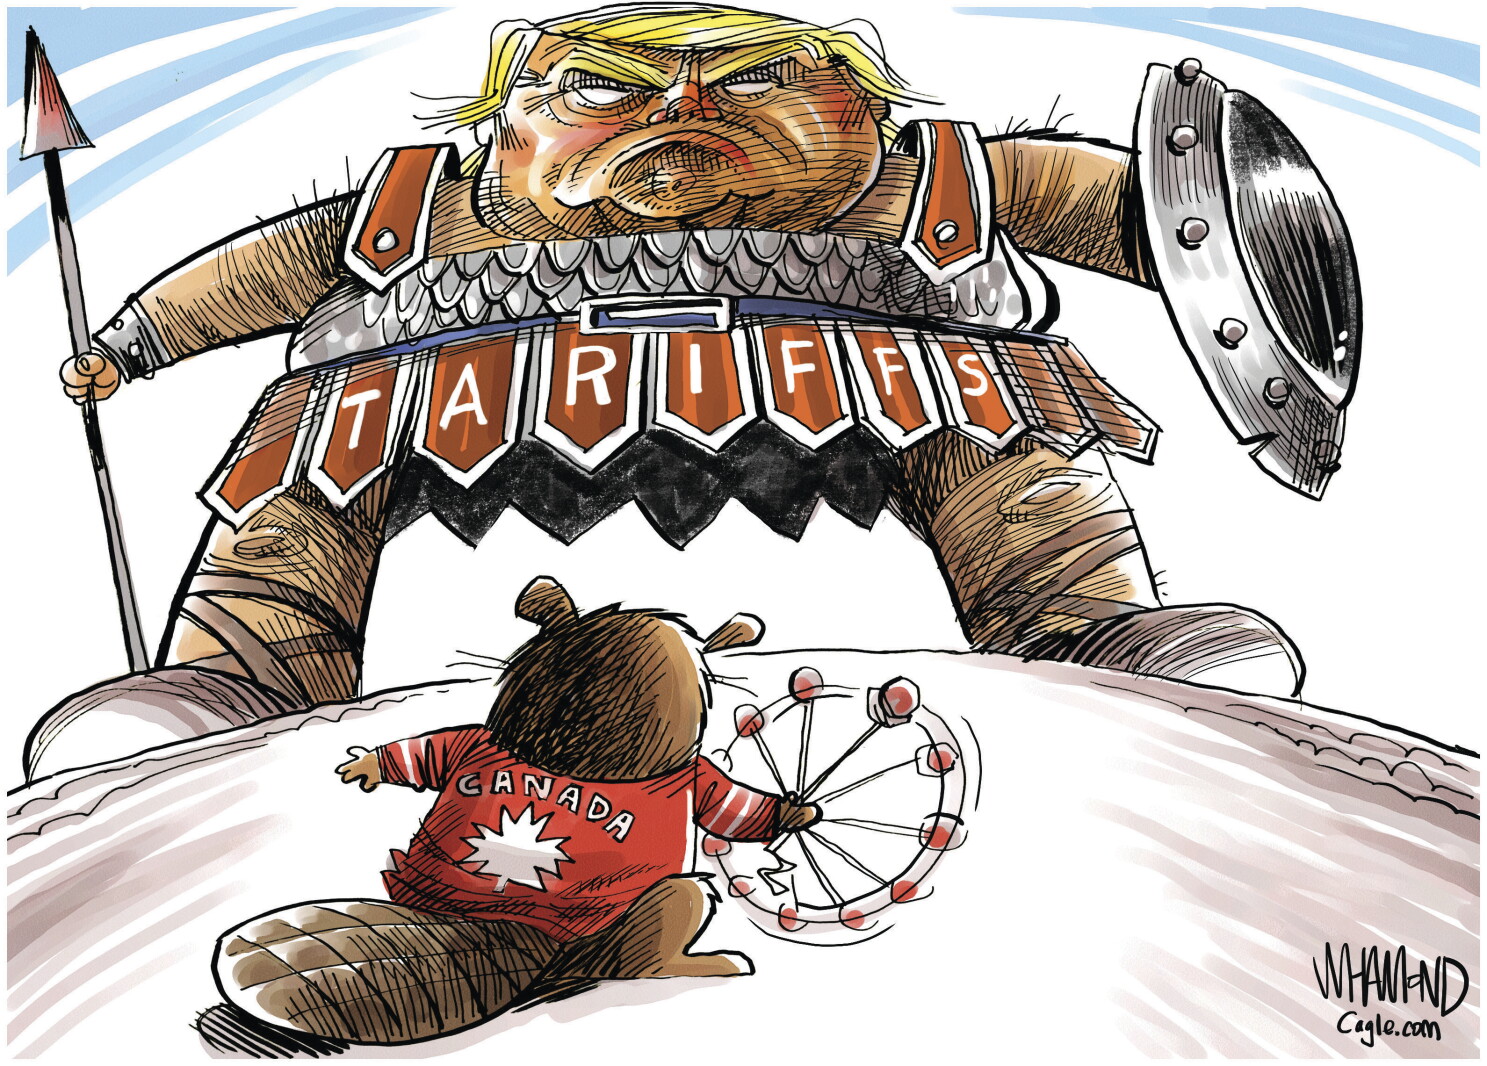
The Democrats’ excitement is destined to be short-lived. Soon, it will be even more obvious that Trump’s tariffs are here to stay. But the lasting effectsthe firewall against future Democrat presidents, a machete to chop through the administrative state, a shield protecting the next few big Trump wins— will be paying off for generations.

Let’s Talk About Fixing World Trade

Matthew Lynn reports on the ongoing breakup and reform of global trade practices in his article Ignore the Outrage. Trump’s Trade Revolution Is Working. Excerpts in italics with my bolds and added images.

America’s allies complain while quietly backing new U.S. policy.

It’s turning into a familiar ritual. President Trump imposes fresh tariffs, often announced on social media late at night, and within seconds the decision is condemned by officials and politicians from Brussels to Paris, Beijing, Berlin, and London.

There are dramatic warnings about how trade wars benefit no one, accompanied by solemn declarations that Europe will not be bullied, and elegies for the “rules-based order.” The financial press dutifully chronicles the “chaos” and “unpredictability” of American trade policy, while CNN books another expert to explain why it cannot possibly work and the Financial Times runs yet another column about how the United States is only damaging itself.

Then, a few weeks later, buried somewhere on page 17, a different story starts to emerge: Germany has agreed to new defense procurement commitments; France is reconsidering agricultural protections; the European Union is suddenly open to renegotiating its digital services tax. Another trade relationship is quietly restructured, and on terms remarkably favorable to Washington. The opposition, it turns out, is mainly just for show. Behind the scenes a new consensus is starting to emerge.

The Trump administration is quietly building a new global trading system
—it’s just that nobody wants to talk about it.

European leaders routinely denounce Trump’s tariffs and “America First” rhetoric with an over-the-top passion that would get them thrown out of drama school. Yet their finance ministers are simultaneously reworking trade agreements in ways that previous American administrations spent decades failing to achieve. The disconnect between the public theater and private reality has become so vast that one might reasonably conclude the confected outrage itself serves a purposeproviding political cover for concessions that would otherwise be impossible to explain to domestic audiences.

A few examples help illustrate what is actually happening. The U.S. has spent years trying to persuade Germany to increase its military spending, to little effect. But over the last 12 months, Germany has ramped up its spending by €80 billion a year. Sure, there is lots of rhetoric about how it will “Buy European” and about how the money will reboot its industrial base. But in reality about 8% of the money will be spent on American kit, including F-35 fighter jets, P-8A Poseidon maritime patrol aircraft, and Tomahawk cruise missiles. It doesn’t really matter who makes the boots. It is the high-tech equipment that really counts, and much of that will be American.

It represents a fundamental shift in German industrial policy, and one that the Obama administration campaigned for in vain, that the Bush administration couldn’t extract, and that decades of NATO summits failed to deliver. Trump got it with a few threatening tweets and warnings about auto tariffs.

Or take a look at France. It has long positioned itself as the defender of European agricultural interests against the marauding Americans with their genetically modified crops and chlorinated chicken. Yet the Common Agricultural Policy, that monument to protectionism and subsidy that has distorted global food markets for generations, is suddenly open for discussion. The reason? It isn’t because France’s politicians have realized that laissez-faire economics originated in their own country. It’s because the alternative—restricted access to the American market—is simply too painful to contemplate.

As another example, the European Union’s digital services tax, a key instrument for extracting revenue from American tech giants, is finally being reconsidered. For years, European politicians treated taxing Apple, Google, and Facebook as both economically sensible and morally righteous. Apparently the firms were “not paying their fair share.” National sovereignty required it and consumers had to be protected. It was simply a coincidence that all the companies that were fined happened to be American. But now, faced with credible retaliation from Washington, the whole scheme is back on the table. The rhetoric about tax justice has been dropped, and the policy has changed.

Across the Channel, the British are now open to paying fairer prices for American pharmaceuticals. It turns out the UK’s state-funded health care system, where prescriptions are either free or bear a fixed price, can afford it after all. Over in the Pacific, Japan has agreed to import more American rice, after insisting for years that it was not to their taste, while the government in Tokyo will underwrite $500 billion of investment in the U.S. Even China, the most protected major economy in the world, has loosened  restrictions. Piece by piece, the tectonic plates of trade are shifting.

These aren’t minor tweaks to existing arrangements. They are fundamental shifts in trading relationships, the kind of structural changes that represent genuine victories for American economic interests. Previous administrations, with all their diplomatic finesse and multilateral commitment, couldn’t secure them, while global institutions, with their emphasis on alliance management and consensus building, got nowhere. Trump’s blunt approach has extracted concessions that diplomatic nuance never could.

That has created an uncomfortable situation for the mainstream commentariat. How can you explain that Trump’s crude, bombastic negotiating style might be getting results when you have insisted it can’t possibly work? And how can you explain how the new tariff regime is working when you have insisted that it will backfire spectacularly? The answer, mostly, has been to not explain it at all—to simply to ignore what is actually happening and continue focusing on the rhetoric.

Europe’s Perfect Storm

The basic logic of realigning global trade has always been sound, even if the tactics and Trump’s style make diplomats wince, because the American market remains indispensable to European and Asian economies. America’s economy isn’t just large; it’s uniquely large in ways that genuinely matter. American consumers spend. They buy imported goods in vast quantities. They don’t save like the Germans or the Chinese. The U.S. market is the ultimate destination for any manufacturer who wants to achieve real scale.

European economies, meanwhile, are facing a perfect storm of challenges. Growth has been anemic for over a decade. The long-term demographic outlook is disastrous, with aging populations creating fiscal pressures that make Greek debt levels look quaint. The regulatory environment has become so stifling that European tech entrepreneurship is essentially a global non-factor. And now the EU faces Chinese competition across virtually every industrial sector, from automobiles to renewable energy to advanced manufacturing.

In this context, the idea of being excluded from American markets—
or even facing significant new barriers—is simply unacceptable.

German car manufacturers cannot survive on European sales alone. French agricultural exporters need American buyers. Italian luxury goods have to be in Miami and Los Angeles malls. Likewise, Vietnamese toys and Korean TVs need to be in Walmart. The leverage is all on one side, and it’s not the European or Asian one.

Trump instinctively understands what the Davos set
refused
to acknowledge for the last 20 years:
trade imbalances on the scale of the 2010s are unsustainable.

You cannot run perpetual surpluses against a trading partner while simultaneously demanding that partner provide your security guarantee, subsidize your defense, and accept restricted access to your own markets. Eventually, the situation will be reset. And when it does, the party with leverage wins.

This is not a particularly sophisticated insight. It’s basic economics and elementary logic. But it’s an insight that decades of trade policy specialists somehow failed to grasp. They convinced themselves that the existing system was stable because it was familiar, that the American willingness to run massive trade deficits while defending global security could somehow last indefinitely. They mistook a temporary arrangement for a permanent equilibrium.

The old consensus rested on several assumptions, none of which could survive serious scrutiny.

First, that trade imbalances don’t really matter because they’re offset by capital flows. Tell that to the workers in Ohio and Michigan who watched their factories close.
Second, that global peace requires accepting unfavorable economic terms. Tell that to the American taxpayers who fund European defense while European governments spend their money on welfare systems Americans can only dream about.
Third, that only multilateral negotiations can produce legitimate trade agreements. Tell that to the countries that have been perfectly happy to negotiate bilateral deals when it suits their interests.

The mock outrage will continue. European politicians will continue denouncing American unilateralism. The editorial pages will continue lamenting the death of the liberal international order. Think tanks will produce papers explaining why Trump’s approach damages American interests.

None of this changes the underlying truth: European and Asian
governments are restructuring trade relationships on American terms.

The irony is that Trump’s supposedly “chaotic” approach may be producing a more balanced and ultimately more durable global trading system than the old consensus ever delivered. Trade relationships that are obviously unbalanced won’t last. They create political pressures that eventually explode. It is better to address those imbalances directly, even if the process is uncomfortable, than to pretend they don’t exist.

Footnote: About SCOTUS Ruling on Trump Tariffs

Treasury Secretary Scott Bessent, speaking in Dallas, echoed Trump in saying that the administration is going to rework the administration’s sweeping import taxes under other legal authorities after the Supreme Court’s ruling earlier today.

“This administration will invoke alternative legal authorities to replace the IEEPA tariffs,” he said. “We will be leveraging Section 232 and Section 301 tariff authorities that have been validated through thousands of legal challenges.”

Bessent added that an estimate calculated by the Treasury Department found that using these other authorities will “result in virtually unchanged tariff revenue in 2026.”