Climate Delusional Disorder (CDD)

WebMD tells What You Need to Know about this condition.  Delusions and Delusional Disorder. Excerpts in italics with my bolds.

Delusions are the main symptom of delusional disorder. They’re unshakable beliefs in something that isn’t true or based on reality. But that doesn’t mean they’re completely unrealistic. Delusional disorder involves delusions that aren’t bizarre, having to do with situations that could happen in real life, like being followed, poisoned, deceived, conspired against, or loved from a distance. These delusions usually involve mistaken perceptions or experiences. But in reality, the situations are either not true at all or highly exaggerated.

People with delusional disorder often can continue to socialize and function normally, apart from the subject of their delusion, and generally do not behave in an obviously odd or bizarre manner. This is unlike people with other psychotic disorders, who also might have delusions as a symptom of their disorder. But in some cases, people with delusional disorder might become so preoccupied with their delusions that their lives are disrupted.

What Are the Complications of Delusional Disorder?

  • People with delusional disorder might become depressed, often as the result of difficulties associated with the delusions.
  • Acting on the delusions also can lead to violence or legal problems. For example, a person with an erotomanic delusion who stalks or harasses the object of the delusion could be arrested.
  • Also, people with this disorder can become alienated from others, especially if their delusions interfere with or damage their relationships.

Treatment most often includes medication and psychotherapy (a type of counseling). Delusional disorder can be very difficult to treat, in part because those who have it often have poor insight and do not know there’s a psychiatric problem. Studies show that close to half of patients treated with antipsychotic medications show at least partial improvement.

Delusional disorder is typically a chronic (ongoing) condition, but when properly treated, many people can find relief from their symptoms. Some recover completely, while others have bouts of delusional beliefs with periods of remission (lack of symptoms).

Unfortunately, many people with this disorder don’t seek help. It’s often hard for people with a mental disorder to know they aren’t well. Or they may credit their symptoms to other things, like the environment. They also might be too embarrassed or afraid to seek treatment. Without treatment, delusional disorder can be a lifelong illness.

An example of CDD

H.Sterling Burnett and James Taylor write at Epoch Times United Nations Misleads About Food Production and Climate Change. Excerpts in italics with my bolds

There is no better way to describe the arguments contained in the U.N. Intergovernmental Panel on Climate Change’s (IPCC) new report, “Climate Change and Land,” released just in time to influence discussions at the United Nations’ 68th Civil Society Conference. Citing anecdotal evidence instead of hard data, IPCC’s new report paints a dark, disturbing picture about the current and future state of crop production and food availability.

“Climate change, including increases in frequency and intensity of extremes, has adversely impacted food security and terrestrial ecosystems as well as contributed to desertification and land degradation in many regions,” the report claims.

“Warming compounded by drying has caused yield declines in parts of Southern Europe. Based on indigenous and local knowledge, climate change is affecting food security in drylands, particularly those in Africa, and high mountain regions of Asia and South America,” the report continues.

Here, climate alarmists in the United Nations are doing nothing more than “pounding the table,” hoping fear will drive the public to demand “climate action now!”

Of course, the fake news media eagerly amplified the alarmist report. For example, an Aug. 8 NBC News headline reads, “Climate change could trigger a global food crisis, new U.N. report says.” Many other major media outlets published similar stories.

The biggest problem is the report’s thesis and “facts” are totally wrong—and that’s quite a problem!

For instance, the United Nations’ own data shows farmers throughout the world are setting new production records virtually every year. In fact, the U.N. Food and Agriculture Organization reports new records were set in each of the past five years for global cereal production, which is composed of the Big Three food staples: corn, wheat, and rice.

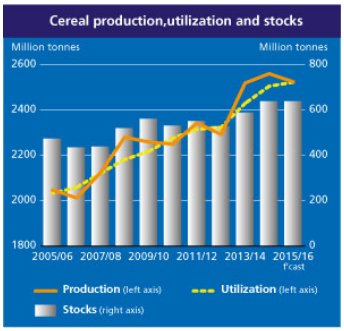
Indeed, World-Grain.com reports in 2016 world cereal production broke records for the third straight year, exceeding the previous record yield, recorded in 2015, by 1.2 percent and topping the record yield in 2014 by 1.5 percent. These facts should not surprise anyone because hundreds of studies and experiments conclusively demonstrate plants do better under conditions of higher carbon dioxide and modestly warmer temperatures.

The ongoing record crop production perfectly illustrates the difference between the Climate Delusion perpetrated by IPCC and other government-funded alarmists and what is actually happening in the real world. To make the news gloomy, IPCC’s report nefariously engages in semantic tricks to give readers a false impression of declining global crop production. The report cites anecdotal evidence crop yields are declining in “parts” of Southern Europe, ignoring copious data showing crop yields are rising across the globe, including throughout Southern Europe.

Instead of highlighting this welcome development, IPCC focuses on what it claims are yield reductions in some small regions of Southern Europe. Readers who are not paying close attention will be led to believe, incorrectly, that crop yields are declining throughout Southern Europe. In reality, the exact opposite is true!

IPCC claims “indigenous and local knowledge” indicates food production is declining “in drylands” in Africa, Asia, and South America. However, such indigenous and local knowledge does not trump objective data, which are readily available to IPCC’s authors and show crop yields are increasing throughout Africa, Asia, and South America as a whole, including in dryland areas.

Tragically, IPCC’s misleading claims result in people who dare to point out crop production continues to set new records being accused of “denying” climate change and attacking science. Climate change is real and record crop production is in fact consistent with it. In fact, record crop production is partly due to climate change.

This is just the latest example of the ongoing Climate Delusion, as radical environmental activists, government bureaucrats, socialists, and a biased news media, looking to transform U.S. society, repeatedly make ridiculous climate claims with no basis in real environmental conditions. They hope the constant drumbeat of authoritative-sounding claims will fool people into stampeding politicians to give governments more power over the economy to combat the false climate crisis.

Fortunately, we can avoid this fate. Factual data showing the truth about global food supplies and other climate conditions are readily available to anyone willing to search the internet. Let’s hope the public accesses the facts. Enacting policies that restrict the use of abundant energy supplies will rob people of choice and harm the economy. This won’t hurt the global elite, but it will result in everyone else living poorer, more precarious lives.

See also Alarmists Anonymous

Northwest Passage Update 2019 08 28

Update on Northwest Passage Traffic August 29, 2019

Background information is reprinted later on.  Above shows the last 10 days of shifting ice concentrations in the NWP choke point, Queen Maud region. Aug. 19 Prince Regent Inlet, top center was plugged, while Peel Sound, top left opened up and allowed passage.  In just a week or so, Prince Regent turned green (<1/3 covered) to blue.  At the same time thick ice dissipated in Franklin Strait, center left, opening the way SW.

Note on the map right edge the reference to Foxe Basin, a body of open water south of Baffin Island.  The channel connecting into Gulf of Boothia is blocked most years, but was open in 2016, and passable now.  This is an alternate NWP route when Bellot Strait is also open.

This is today’s map of vessels in the NWP.  Cargo ships in yellow, Passenger ships in green, yachts in purple.  Note that Peel Sound is the preferred route this year.

Background:  The Outlook in 2007

From Sea Ice in Canada’s Arctic: Implications for Cruise Tourism by Stewart et al. December 2007. Excerpts in italics with my bolds.

Although cruise travel to the Canadian Arctic has grown steadily since 1984, some commentators have suggested that growth in this sector of the tourism industry might accelerate, given the warming effects of climate change that are making formerly remote Canadian Arctic communities more accessible to cruise vessels. Using sea-ice charts from the Canadian Ice Service, we argue that Global Climate Model predictions of an ice-free Arctic as early as 2050-70 may lead to a false sense of optimism regarding the potential exploitation of all Canadian Arctic waters for tourism purposes. This is because climate warming is altering the character and distribution of sea ice, increasing the likelihood of hull-penetrating, high-latitude, multi-year ice that could cause major pitfalls for future navigation in some places in Arctic Canada. These changes may have negative implications for cruise tourism in the Canadian Arctic, and, in particular, for tourist transits through the Northwest Passage and High Arctic regions.

The most direct route through the Northwest Passage is via Viscount Melville Sound into the M’Clure Strait and around the coast of Banks Island. Unfortunately, this route is marred by difficult ice, particularly in the M’Clure Strait and in Viscount Melville Sound, as large quantities of multi-year ice enter this region from the Canadian Basin and through the Queen Elizabeth Islands.

As Figure 5 illustrates, difficult ice became particularly evident, hence problematic, as sea-ice concentration within these regions increased from 1968 to 2005; as well, significant increases in multi-year ice are present off the western coast of Banks Island as well. Howell and Yackel (2004) illustrated that ice conditions within this region during the 1969–2002 navigation seasons exhibited greater severity from 1969 to1979 than from 1991 to 2002. This variability likely is a reflection of the extreme light-ice season present in 1998(Atkinson et al., 2006), from which the region has since recovered. Cruise ships could use the Prince of Wales Strait to avoid the choke points on the western coast of Banks Island, but entry is difficult; indeed, Howell and Yackel (2004) showed virtually no change in ease of navigation from 1969 to 2002.

An alternative, longer route through the Northwest Passage passes through either Peel Sound or the Bellot Strait. The latter route potentially could avoid hazardous multi-year ice in Peel Sound, but its narrow passageway makes it unfeasible for use by larger vessels. Regardless of which route is selected, a choke point remains in the vicinity of the Victoria Strait (Fig. 5). This strait acts as a drain trap for multi-year ice that has entered the M’Clintock Channel region and gradually advances south-ward (Howell and Yackel, 2004; Howell et al., 2006). While Howell and Yackel (2004) showed slightly safer navigation conditions from 1991 to 2002 compared to 1969 to 1990, they attributed this improvement to the anomalous warm year of 1998 that removed most of the multi-year ice in the region. From 2000 to 2005, when conditions began to recover from the 1998 warming, atmospheric forcing was insufficient to break up the multi-year ice that entered the M’Clintock Channel. Instead the ice became mobile, flowing southward into the Victoria Strait as the surrounding first-year ice broke up earlier (Howell et al., 2006).

During the past 20 years, cruises gradually have become an important element of Canadian Arctic tourism, and currently there seems to be consensus about the cruise industry’s inevitable growth, especially in the vicinity of Baffin Bay. However, we have stressed the likelihood that sea-ice hazards will continue to exist and will present ongoing navigational challenges to tour operators, particularly those operating in the western regions of the Canadian Arctic.

Fast Forward to Summer of 2018:  Northwest Passage Proved Impassable

August 23, 2018 . At least 22 vessels are affected and several have turned back to Greenland.

Reprinted from post on September 3, 2018:  News today from the Northwest Passage blog that S/V CRYSTAL has given up after hanging around Fort Ross hoping for a storm or melting to break the ice barrier blocking their way west.
20180902-1025_crystal

As the vessel tracker shows, they have been forced to Plan C, which is returning to Greenland and accept that the NW Passage is closed this year. The latest ice chart gave them no hope for getting through.  Note yachts can sail through green (3/10), so the hope is for red to yellow to green.  But that did not happen last year.
20180902180000_wis38ct_0010210949

The image below shows the ice with which they were coping.
DCIM100GOPROGOPR5778.

More details at NW Passage blog 20180902 S/V CRYSTAL and S/V ATKA give up and retreat back to Greenland – Score ICE 3 vs YACHTS 0

Current Situation in Canadian Arctic Archipelago

The current ice map of Queen Maude region shows the difference between 2019 and last year.

Remembering that yachts need at most 1-3/10 ice conditions (light green), it is showing Peel Sound on the left side is open now, but was the obstruction last year.  Not shown but also important is open water in Barrow Strait allowing access to Peel Sound from the north.  Conversely, on the top right Prince Regent Inlet is plugged at the top and impassable for now, and perhaps for the year.

As reported at the Northwest Passage Blogspot, yachts are taking the Peel Sound route this year, rather than using Prince Regent Inlet and Bellot Strait, due to ice conditions. Excerpts in italics with my bolds.

Peel Sound, With Trepidation
by Randall
August 16, 2019
Days at Sea: 262
Over the last few days, charts have shown a significant reduction in ice concentrations in Peel, but there is still ice, lots of ice. One hundred miles into the Sound from the N, there is a band of 4-6/10ths ice that is sixty-five miles long and covers both the eastern and western shores. Another one hundred miles below that is a large band of 1-3/10ths ice. Below that there is open water, but it is threatened by the heavy ice feeding in from M’Clintock Channel.

Add to this an imminent change in the weather. Long range forecasts are calling for a switch from these long-running E winds to SW winds and then strong southerlies that could scramble the current ice configuration.
Add to this a paucity of anchorages in Peel. Two of the best on the W coast are icebound. The next, False Strait, is just above Bellot Strait and 165 miles from the opening.

In the evening I reach out to the ice guide, Victor Wejer, for a consult on anchorages. Mo needs a place to hide if things go badly. I show him the areas I’ve chosen.

“This is a subject I would like to avoid,” he replies. “It is not written in stone that you must take the entirety of Peel in one go, but it is the usual way. Read the Canadian Sailing Directions. The height of Somerset Island does weird things to the wind; it can go from calm to gale in an instant. Most of what look like anchorages on the chart are just not safe.”

“As to ice,” he continues, “this is also difficult. Peel is narrow and fed from M’Clintock. Most sailboat crews fight tooth and ice pole to get through. Consider that Matt Rutherford chose Prince Regent. But for you there may not be an option. Regent will not be clear for a long time; maybe not at all this year.”

By now four boats are through Peel, below Bellot Strait and on their way to Gjoa Haven. Yellow-hulled Breskell is one of them, but it has taken her four days to transit 200 miles, and I can tell from the way Olivier writes his encouraging emails that he has his doubts about doing it solo.

MO IS THROUGH THE ICE!
by Randall
August 19, 2019
1845 local
70 32S 97 27W
Larsen Sound
The Arctic

Just a quick note to report that Mo is through the ice and sailing fast on a N wind for Cambridge Bay, 235 miles SW.

I have been pushing to get to Alioth’s position for two days. She has a busted gear box and can’t make more than three knots under power. She has been hove to at the head of our last major ice plug waiting for an escort as she’d have to sail through, a tricky business.

We’ve all been sweating bullets over this last 30 miles of ice, and for four days I’ve been underway and hand steering for 18 to 20 hours a day through 3 – 5/10ths ice to get here. Only a few hours sleep a night this last week.

As it turns out, today was a piece of cake. We saw huge ice floes the size of city blocks but with wide lanes in between. Alioth and another boat, Mandregore, sailed downwind without trouble with Mo bringing up the rear under power just in case.

El Nino’s Cold Tongue Baffles Climate Models


This post is prompted by an article published by Richard Seager et al. at AMS Journal Is There a Role for Human-Induced Climate Change in the Precipitation Decline that Drove the California Drought? Excerpts in italics with my bolds.

Overview

The recent California drought was associated with a persistent ridge at the west coast of North America that has been associated with, in part, forcing from warm SST anomalies in the tropical west Pacific. Here it is considered whether there is a role for human-induced climate change in favoring such a west coast ridge. The models from phase 5 of the Coupled Model Intercomparison Project do not support such a case either in terms of a shift in the mean circulation or in variance that would favor increased intensity or frequency of ridges. The models also do not support shifts toward a drier mean climate or more frequent or intense dry winters or to tropical SST states that would favor west coast ridges. However, reanalyses do show that over the last century there has been a trend toward circulation anomalies over the Pacific–North American domain akin to those during the height of the California drought.

Position of the Warm Pool in the western Pacific under La Niña conditions, and the convergence zone where the Warm Pool meets nutrient-enriched waters of the eastern equatorial Pacific. Tuna and their prey are most abundant in this convergence zone 21,48 (source: HadISST) 109 .

First we plot together the history of California winter precipitation and Arctic sea ice anomaly in terms of area covered by ice at the annual minimum month of September and also as the November through April winter average (Fig. 9, top). While all three are of course negative during the drought years there is no year to year relationship between these quantities. Next we composite 200-mb height anomalies, U.S. precipitation, and sea ice concentration for, during the period covered by sea ice data, the driest 15% of California winters and subtract the climatological winter values (Fig. 9, bottom). As in Seager et al. (2015), the composites show that when California is dry the entire western third of the United States tends to be dry and that there is a high pressure ridge located immediately off the west coast, which does not appear to be connected to a tropically sourced wave train. There also tends to be a trough over the North Atlantic, similar to winter 2013/14. There are notable localized sea ice concentration anomalies with increased ice in the Sea of Okohtsk, reduced ice in the Bering Sea, and increased ice in Hudson Bay and Labrador Sea, though the anomalies are small. These ice anomalies are consistent with atmospheric forcing. The Sea of Okhotsk and Hudson Bay/Labrador Sea anomalies appear under northerly flow that would favor cold advection and increased ice. The Bering Sea anomaly appears under easterly flow that would drive ice offshore. As shown by Seager et al. (2015), the dry California winters are also associated with North Pacific SST anomalies forced by the atmospheric wave train and the sea ice anomalies appear part of this feature rather than as causal drivers of the atmospheric circulation anomalies.

These analyses do not support the idea that variations in sea ice extent influence the prevalence of west coast ridges or dry winters in California.

Source: NASA

On the basis of the above analysis we conclude that the occurrence of persistent ridges at the west coast is more connected to SST anomalies than it is to sea ice anomalies. The CMIP5 model ensemble lends no support to the idea that ridge-inducing SST patterns become more likely as a result of rising GHGs. However, the models could be wrong so we next examine whether trends in observed SSTs lend any support to this idea. Trends were computed by straightforward linear least squares regression.

A number of features stand out in these trends regardless of the time period used.

  • Amid near-ubiquitous warming of the oceans the central equatorial Pacific stands out as a place that has not warmed.
  • The west–east SST gradient across the tropical Pacific has strengthened as the west Pacific has warmed.
  • Increased reanalysis precipitation over the Indian Ocean–Maritime Continent–tropical west Pacific and reduced reanalysis precipitation over the central equatorial Pacific Ocean were found.
  • Tropical geopotential heights have increased at all longitudes.
  • A trend toward a localized high pressure ridge extending from the subtropics toward Alaska across western North America.

These associations in the trends—a strengthened west–east SST gradient across the tropical Pacific and localized high pressure at the North American west coast—are in line with every piece of evidence based on observations and SST-forced models presented so far that there is a connection between drought-inducing circulation anomalies and tropical Pacific SSTs. The mediating influence is seen in the precipitation trends that show enhanced zonal gradients of tropical Indo-Pacific precipitation and a marked increase centered over the Maritime Continent region.

Conclusions and discussion

We have examined whether there is any evidence, observational and/or model based, that the precipitation decline that drove the California drought was contributed to by human-driven climate change. Findings are as follows:

  • The CMIP5 model ensemble provides no evidence for mean drying or increased prevalence of dry winters for California or a shift toward a west coast ridge either in the mean or as a more common event. They also provide no evidence of a shift in tropical SSTs toward a state with an increased west–east SST gradient that has been invoked as capable of forcing a west coast ridge and drought.
  • Analysis of observations-based reanalyses shows that west coast ridges, akin to that in winter 2013/14, are related to an increased west–east SST gradient across the tropical Pacific Ocean and have repeatedly occurred over past decades though as imperfect analogs.
  • SST-forced models can reproduce such ridges and their connection to tropical SST anomalies.  Century-plus-long reanalyses and SST-forced models indicate a long-term trend toward circulation anomalies more akin to that of winter 2013/14.
  • The trends of heights and SSTs in the reanalyses also show both an increased west–east SST gradient and a 200-mb ridge over western North America that, in terms of association between ocean and atmospheric circulation, matches those found via the other analyses on interannual time scales.
  • However, SST-forced models when provided the trends in SSTs create a 200-mb ridge over the central North Pacific and, in general, a circulation pattern that cannot be said to truly match that in reanalyses.

So can a case be made that human-driven climate change contributed to the precipitation drop that drives the drought? Not from the simulations of historical climate and projections of future climate of the CMIP5 multimodel ensemble.

These simulations show no current or future increase in the likelihood or extremity of negative precipitation, precipitation minus evaporation, west coast ridges, or ridge-forcing tropical SST patterns. However, when examining the observational record a case can be made that the climate system has been moving in a direction that favors both a ridge over the west coast, which has a limited similarity to that observed in winter 2013/14, the driest winter of the drought, and a ridge-generating pattern of increased west–east SST gradient across the tropical Pacific Ocean with warm SSTs in the Indo–west Pacific region. This observations-based argument then gets tripped up by SST-forced models, which know about the trends in SST but fail to simulate a trend toward a west coast ridge. On the other hand, idealized modeling indicates that preferential warming in the Indo–west Pacific region does generate a west coast ridge.

To make the argument we outline above requires rejecting the CMIP5 ensemble as a guide to how tropical climate responds to increased radiative forcing since this tropical ocean response is at odds with what they do. To do so follows in the footsteps of Kohyama and Hartmann (2017, p. 4248), who correctly point out that “El Niño–like mean-state warming is only a ‘majority decision’ based on currently available GCMs, most of which exhibit unrealistic nonlinearity of the ENSO dynamics” (see also Kohyama et al. 2017). The implications of changing tropical SST gradients would extend far beyond just California and include most regions of the world sensitive to ENSO-generated climate anomalies.

We believe that the current state of observational information, analysis of it, and climate modeling does not allow a confident rejection of the CMIP5 model responses and/or a confident assertion of human role in the precipitation drop of the California drought. We also believe that for the same reasons a human role cannot be excluded.

Comment:

The researchers set out to prove man-made global warming contributes to droughts in California, but their findings put them in a quandry.  The models include CO2 forcings, yet do not predict the conditions resulting in west coast droughts,   They have to admit the models are wrong in this respect (what else do the models get wrong?).  They cling to the hope that global warming can be tied to droughts, but have to admit there is no evidence from the failed models.

Postscript:

(a) Annual variation (Annual RMSE) of SST and Chl-a globally (units are °C/decade for SST and log(mg/m3/decade) for Chl-a). (b) The pattern of annual variation in the Bonney Upwelling, Southern Australia. (c) The pattern of annual variation in the the Florida Current, South East USA.


A separate study is Global patterns of change and variation in sea surface temperature and chlorophyll by Piers K. Dunstan et. al.

The blue tongue shows up as an equatorial pacific region that shows little variability over the 14 year period of study.  From the article:

The interaction between annual variation in SST and Chl-a provides insights into how and where linkages occur on annual time scales. Our analysis shows strong latitudinal bands associated with variation in seasonal warming (Fig. 4a). The equatorial Pacific, Indian and Atlantic Oceans are all characterised by very low annual RMSE for both SST and Chl-a. The mid latitudes of each ocean basin have higher variance in SST and/or Chl-a.

Closing the Endangered Species Piggy Bank

By Ronald W. Opsahl writes August 26, 2019, at Real Clear Policy Trump’s Environmental Reforms: Good for the Environment, Bad for Lawyers.  Excerpts in italics with my bolds.

Between 2016 and 2018, environmental groups filed over 170 lawsuits alleging violations of the Endangered Species Act, making the ESA one of the most abused environmental laws in the United States. On Monday, the Trump Administration announced much needed revisions to regulations of the ESA.

The response of leading environmentalist groups was entirely predictable. They immediately threatened lawsuits. Indeed, lawsuits make up the core business plan of many purported wildlife conservation groups. They sue the U.S. Fish and Wildlife Service (FWS) for alleged violations of the ESA, and often force agency decisions that do not actually benefit any species.

These groups then seek, and frequently succeed, to recover their attorneys’ fees from the federal government, drawing limited funding away from actual species conservation and into their war chests to fund additional ESA litigation. And the cycle goes on and on.

Major environmentalist groups not only earn money directly from litigation, but they also use lawsuits as a fundraising tool, rallying their donors by claiming to “fight” for endangered and threatened species in the courts, even when those lawsuits do little to promote actual conservation.

Big Environmentalism is doing brisk business these days. Since these groups essentially earn a living by abusing the ESA, they have a lot invested in the status quo. ESA reform is a genuine threat to their business model. They characterized Trump’s proposed reforms as a rollback of protections for species at risk of extinction, but it is actually a rollback of their lucrative legal work that terrifies them.

The Trump Administration is proposing three main changes. The change attracting the greatest criticism involves presenting the public with the economic impacts of listing decisions. It is true that listing decisions under the ESA are supposed to be based upon scientific evidence, without regard to economic impact. However, there is no prohibition on preparing and disclosing the potential economic impacts that would result from listing a species. In fact, officials are required by law to consider economic impacts whenever they designate a critical habitat for a species.

Environmentalists may want to keep the public blind to economic impacts, but that could hardly be said to be in the public’s interest. Too often, environmentalists seek critical habitat designations under the pretense of conserving species, but in fact their true intent is to prevent any resource development.

A second revision raising environmentalist ire is the elimination of its so-called “blanket rule,” which automatically affords threatened species the same protections granted to endangered species. Instead, going forward, FWS will evaluate the threats to newly listed threatened species, and tailor the conservation measures to each species’ needs.

Tailored conservation is smarter conservation. The National Marine Fisheries Service, the federal agency responsible for protecting marine species under the ESA, has never employed the “blanket rule” and has always tailored protections to species’ needs. Furthermore, the “blanket rule” is not provided for by the text of the ESA. Thus, the proposed changes would bring the government’s application of the ESA back into alignment with the Congress’ actual intent.

A third proposed revision to the regulations would clear up some disputed language in the law. Under the ESA, a species may be listed as threatened if it is at risk of becoming endangered in the “foreseeable future.” Previously, the term was undefined, leading to numerous lawsuits intended to force the agency to list species as threatened based upon little more than speculation.

Unfortunately, the weaponization of the ESA will continue until the law is fundamentally changed to eliminate the big dollar incentives that lead to endless litigation in the name of “species conservation.” More reform is needed to curb the rampant abuses of the law by environmental groups. Until then, the “sue and settle” approach will continue clogging up the courts, consuming vast federal resources in endless lawsuits, and taking those resources away from the real work of conservation.

Nevertheless, the proposed reforms are a step in the right direction. The Trump Administration’s ESA rule revision takes power out of the hands of lawyers and puts it back in the hands of scientists and trained wildlife management officials—where it belongs.

Ronald W. Opsahl is an attorney with Mountain States Legal Foundation, specializing in natural resources law, and is a trained wildlife biologist.

Sobering Facts about Global Warming

A Short List Of Facts Global Warming Alarmists Don’t Want To Face  by Issues and Insights Editorial Board.  Excerpts in italics with my bolds.

Democrats nearly had a brawl last week in California after the party’s Resolutions Committee rejected a proposed climate debate among Democratic presidential candidates. Global warming so fully occupies the thinking of some that there’s no room for information that will contradict their faith.

If they’d only open their minds they’d see:

The U.S. hasn’t warmed since 2005. America isn’t the entire world. But the alarmists gleefully point out regional heatwaves and the “hottest day on record” when cities endure summer scorchers. So let’s look at the data. The U.S. Climate Reference Network, “a sophisticated climate-observing network specifically designed and deployed for quantifying climate change on a national scale,” has found there’s been no warming in the U.S. going back to 2005.

In fact, says meteorologist Anthony Watts, the “little known data from the state-of-the-art” operation, “(which never seems to make it into NOAA’s monthly ‘state of the climate’ reports) show that for the past nine months, six of them were below normal.”

The data also tell us 2019’s average has been cooler than 2005’s, the first year of the data set.

Man’s carbon dioxide emissions are not burning down the Amazon. Empty-headed celebrities and activists have had quite a virtue-signaling feast tweeting photos from fires three decades ago, fires in Europe, and fires in the U.S. Yes, we’ve seen the claims that there are 80% more fires this year than last in South America, but we’ve also seen this from the New York Times:

“The majority of these fires were set by farmers preparing Amazon-adjacent farmland for next year’s crops and pasture.”

Of course that’s a disposable detail because it doesn’t fit the narrative.

Carbon dioxide increases historically lag temperature increases. “In 1985, ice cores extracted from Greenland revealed temperatures and CO2 levels going back 150,000 years,” writes author Joanne Nova. “Temperature and CO2 seemed locked together. It was a turning point — the ‘greenhouse effect’ captured attention. But, in 1999 it became clear that carbon dioxide rose and fell after temperatures did. By 2003, we had better data showing the lag was 800 ± 200 years. CO2 was in the back seat.”

Of course the climate crusaders have written at great length to tell us it’s all just a myth. This time, they say, the warming (which is in doubt) is caused by man. It just has to be. All those other warming periods, the alarmists tell us, can be explained by natural events, such as Earth’s orbit around the sun, which, incidentally, we have mentioned as one of many factors that influence climate changes.

Less than 5% of carbon dioxide emissions are produced by man. Web searches turn up what seems like an endless list of stories and blog posts reporting that CO2 levels in the atmosphere have reached or exceeded 415 parts per million. This has been almost universally treated as the tip of an imminent disaster, as man has pushed greenhouse gas emissions beyond a dangerous threshold. But has he?

The United Nation’s Intergovernmental Panel on Climate Change “agrees today’s annual human carbon dioxide emissions are 4.5 ppm (parts per million) per year and nature’s carbon dioxide emissions are 98 ppm per year,” says climate scientist Ed Berry. “Yet, the IPCC claims human emissions have caused all the increase in carbon dioxide since 1750, which is 30% of today’s total.

“How can human carbon dioxide, which is less than 5% of natural carbon dioxide, cause 30% of today’s atmospheric carbon dioxide? It can’t.”

Don’t like Berry’s numbers? Consider another set of figures from the IPCC’s Fourth Assessment Report, which says that of the 750 gigatons of CO2 which travel through the carbon cycle every year, only 29 gigatons, or less than 4%, are produced by man.

Is it possible for such a small portion to have such a great influence? Despite what the hysterics tell us, it’s an unanswered question.

There are many other unanswered questions about climate, as well. An honest person would admit that they might remain unanswered forever. An alarmist, however, has his mind made up — and closed down.

See also Alarmists Anonymous


Greenland Glaciers: History vs. Hysteria

The modern pattern of environmental scares started with Rachel Carson’s Silent Spring claiming chemical are killing birds, only today it is windmills doing the carnage. That was followed by ever expanding doomsday scenarios, from DDT, to SST, to CFC, and now the most glorious of them all, CO2. In all cases the menace was placed in remote areas difficult for objective observers to verify or contradict. From the wilderness bird sanctuaries, the scares are now hiding in the stratosphere and more recently in the Arctic and Antarctic polar deserts. See Progressively Scaring the World (Lewin book synopsis)

The advantage of course is that no one can challenge the claims with facts on the ground, or on the ice. Correction: Scratch “no one”, because the climate faithful are the exception. Highly motivated to go to the ends of the earth, they will look through their alarmist glasses and bring back the news that we are indeed doomed for using fossil fuels.

A recent example is a team of researchers from Dubai (the hot and sandy petro kingdom) going to Greenland to report on the melting of Helheim glacier there.  The article is NYUAD team finds reasons behind Greenland’s glacier melt.  Excerpts in italics with my bolds.

First the study and findings:

For the first time, warm waters that originate in the tropics have been found at uniform depth, displacing the cold polar water at the Helheim calving front, causing an unusually high melt rate. Typically, ocean waters near the terminus of an outlet glacier like Helheim are at the freezing point and cause little melting.

NYUAD researchers, led by Professor of Mathematics at NYU’s Courant Institute of Mathematical Sciences and Principal Investigator for NYU Abu Dhabi’s Centre for Sea Level Change David Holland, on August 5, deployed a helicopter-borne ocean temperature probe into a pond-like opening, created by warm ocean waters, in the usually thick and frozen melange in front of the glacier terminus.

Normally, warm, salty waters from the tropics travel north with the Gulf Stream, where at Greenland they meet with cold, fresh water coming from the polar region. Because the tropical waters are so salty, they normally sink beneath the polar waters. But Holland and his team discovered that the temperature of the ocean water at the base of the glacier was a uniform 4 degrees Centigrade from top to bottom at depth to 800 metres. The finding was also recently confirmed by Nasa’s OMG (Oceans Melting Greenland) project.

“This is unsustainable from the point of view of glacier mass balance as the warm waters are melting the glacier much faster than they can be replenished,” said Holland.

Surface melt drains through the ice sheet and flows under the glacier and into the ocean. Such fresh waters input at the calving front at depth have enormous buoyancy and want to reach the surface of the ocean at the calving front. In doing so, they draw the deep warm tropical water up to the surface, as well.

All around Greenland, at depth, warm tropical waters can be found at many locations. Their presence over time changes depending on the behaviour of the Gulf Stream. Over the last two decades, the warm tropical waters at depth have been found in abundance. Greenland outlet glaciers like Helheim have been melting rapidly and retreating since the arrival of these warm waters.

Then the Hysteria and Pledge of Allegiance to Global Warming

“We are surprised to learn that increased surface glacier melt due to warming atmosphere can trigger increased ocean melting of the glacier,” added Holland. “Essentially, the warming air and warming ocean water are delivering a troubling ‘one-two punch’ that is rapidly accelerating glacier melt.”

My comment: Hold on.They studied effects from warmer ocean water gaining access underneath that glacier. Oceans have roughly 1000 times the heat capacity of the atmosphere, so the idea that the air is warming the water is far-fetched. And remember also that long wave radiation of the sort that CO2 can emit can not penetrate beyond the first millimeter or so of the water surface. So how did warmer ocean water get attributed to rising CO2? Don’t ask, don’t tell.  And the idea that air is melting Arctic glaciers is also unfounded.

Consider the basics of air parcels in the Arctic.

The central region of the Arctic is very dry. Why? Firstly because the water is frozen and releases very little water vapour into the atmosphere. And secondly because (according to the laws of physics) cold air can retain very little moisture.

Greenland has the only veritable polar ice cap in the Arctic, meaning that the climate is even harsher (10°C colder) than at the North Pole, except along the coast and in the southern part of the landmass where the Atlantic has a warming effect. The marked stability of Greenland’s climate is due to a layer of very cold air just above ground level, air that is always heavier than the upper layers of the troposphere. The result of this is a strong, gravity-driven air flow down the slopes (i.e. catabatic winds), generating gusts that can reach 200 kph at ground level.

Arctic air temperatures

Some history and scientific facts are needed to put these claims in context. Let’s start with what is known about Helheim Glacier.

Holocene history of the Helheim Glacier, southeast Greenland

Helheim Glacier ranks among the fastest flowing and most ice discharging outlets of the Greenland Ice Sheet (GrIS). After undergoing rapid speed-up in the early 2000s, understanding its long-term mass balance and dynamic has become increasingly important. Here, we present the first record of direct Holocene ice-marginal changes of the Helheim Glacier following the initial deglaciation. By analysing cores from lakes adjacent to the present ice margin, we pinpoint periods of advance and retreat. We target threshold lakes, which receive glacial meltwater only when the margin is at an advanced position, similar to the present. We show that, during the period from 10.5 to 9.6 cal ka BP, the extent of Helheim Glacier was similar to that of todays, after which it remained retracted for most of the Holocene until a re-advance caused it to reach its present extent at c. 0.3 cal ka BP, during the Little Ice Age (LIA). Thus, Helheim Glacier’s present extent is the largest since the last deglaciation, and its Holocene history shows that it is capable of recovering after several millennia of warming and retreat. Furthermore, the absence of advances beyond the present-day position during for example the 9.3 and 8.2 ka cold events as well as the early-Neoglacial suggest a substantial retreat during most of the Holocene.

Quaternary Science Reviews, Holocene history of the Helheim Glacier, southeast Greenland
A.A.Bjørk et. Al. 1 August 2018

The topography of Greenland shows why its ice cap has persisted for millenia despite its southerly location.  It is a bowl surrounded by ridges except for a few outlets, Helheim being a major one.

And then, what do we know about the recent history of glacier changes. Two Decades of Changes in Helheim Glacier

Helheim Glacier is the fastest flowing glacier along the eastern edge of Greenland Ice Sheet and one of the island’s largest ocean-terminating rivers of ice. Named after the Vikings’ world of the dead, Helheim has kept scientists on their toes for the past two decades. Between 2000 and 2005, Helheim quickly increased the rate at which it dumped ice to the sea, while also rapidly retreating inland- a behavior also seen in other glaciers around Greenland. Since then, the ice loss has slowed down and the glacier’s front has partially recovered, readvancing by about 2 miles of the more than 4 miles it had initially ­retreated.

NASA has compiled a time series of airborne observations of Helheim’s changes into a new visualization that illustrates the complexity of studying Earth’s changing ice sheets. NASA uses satellites and airborne sensors to track variations in polar ice year after year to figure out what’s driving these changes and what impact they will have in the future on global concerns like sea level rise.

Since 1997, NASA has collected data over Helheim Glacier almost every year during annual airborne surveys of the Greenland Ice Sheet using an airborne laser altimeter called the Airborne Topographic Mapper (ATM). Since 2009 these surveys have continued as part of Operation IceBridge, NASA’s ongoing airborne survey of polar ice and its longest-running airborne mission. ATM measures the elevation of the glacier along a swath as the plane files along the middle of the glacier. By comparing the changes in the height of the glacier surface from year to year, scientists estimate how much ice the glacier has lost.

The animation begins by showing the NASA P-3 plane collecting elevation data in 1998. The laser instrument maps the glacier’s surface in a circular scanning pattern, firing laser shots that reflect off the ice and are recorded by the laser’s detectors aboard the airplane. The instrument measures the time it takes for the laser pulses to travel down to the ice and back to the aircraft, enabling scientists to measure the height of the ice surface. In the animation, the laser data is combined with three-dimensional images created from IceBridge’s high-resolution camera system. The animation then switches to data collected in 2013, showing how the surface elevation and position of the calving front (the edge of the glacier, from where it sheds ice) have changed over those 15 years.

Helheim’s calving front retreated about 2.5 miles between 1998 and 2013. It also thinned by around 330 feet during that period, one of the fastest thinning rates in Greenland.

“The calving front of the glacier most likely was perched on a ledge in the bedrock in 1998 and then something altered its equilibrium,” said Joe MacGregor, IceBridge deputy project scientist. “One of the most likely culprits is a change in ocean circulation or temperature, such that slightly warmer water entered into the fjord, melted a bit more ice and disturbed the glacier’s delicate balance of forces.”

Comment:

Once again, history is a better guide than hysteria.  Over time glaciers advance and retreat, and incursions of warm water are a key factor.  Greenland ice cap and glaciers are part of the the Arctic self-oscillating climate system operating on a quasi-60 year cycle.

Outlook: Northwest Passage Less Icy in 2019

Background:  The Outlook in 2007

From Sea Ice in Canada’s Arctic: Implications for Cruise Tourism by Stewart et al. December 2007. Excerpts in italics with my bolds.

Although cruise travel to the Canadian Arctic has grown steadily since 1984, some commentators have suggested that growth in this sector of the tourism industry might accelerate, given the warming effects of climate change that are making formerly remote Canadian Arctic communities more accessible to cruise vessels. Using sea-ice charts from the Canadian Ice Service, we argue that Global Climate Model predictions of an ice-free Arctic as early as 2050-70 may lead to a false sense of optimism regarding the potential exploitation of all Canadian Arctic waters for tourism purposes. This is because climate warming is altering the character and distribution of sea ice, increasing the likelihood of hull-penetrating, high-latitude, multi-year ice that could cause major pitfalls for future navigation in some places in Arctic Canada. These changes may have negative implications for cruise tourism in the Canadian Arctic, and, in particular, for tourist transits through the Northwest Passage and High Arctic regions.

The most direct route through the Northwest Passage is via Viscount Melville Sound into the M’Clure Strait and around the coast of Banks Island. Unfortunately, this route is marred by difficult ice, particularly in the M’Clure Strait and in Viscount Melville Sound, as large quantities of multi-year ice enter this region from the Canadian Basin and through the Queen Elizabeth Islands.

As Figure 5 illustrates, difficult ice became particularly evident, hence problematic, as sea-ice concentration within these regions increased from 1968 to 2005; as well, significant increases in multi-year ice are present off the western coast of Banks Island as well. Howell and Yackel (2004) illustrated that ice conditions within this region during the 1969–2002 navigation seasons exhibited greater severity from 1969 to1979 than from 1991 to 2002. This variability likely is a reflection of the extreme light-ice season present in 1998(Atkinson et al., 2006), from which the region has since recovered. Cruise ships could use the Prince of Wales Strait to avoid the choke points on the western coast of Banks Island, but entry is difficult; indeed, Howell and Yackel (2004) showed virtually no change in ease of navigation from 1969 to 2002.

An alternative, longer route through the Northwest Passage passes through either Peel Sound or the Bellot Strait. The latter route potentially could avoid hazardous multi-year ice in Peel Sound, but its narrow passageway makes it unfeasible for use by larger vessels. Regardless of which route is selected, a choke point remains in the vicinity of the Victoria Strait (Fig. 5). This strait acts as a drain trap for multi-year ice that has entered the M’Clintock Channel region and gradually advances south-ward (Howell and Yackel, 2004; Howell et al., 2006). While Howell and Yackel (2004) showed slightly safer navigation conditions from 1991 to 2002 compared to 1969 to 1990, they attributed this improvement to the anomalous warm year of 1998 that removed most of the multi-year ice in the region. From 2000 to 2005, when conditions began to recover from the 1998 warming, atmospheric forcing was insufficient to break up the multi-year ice that entered the M’Clintock Channel. Instead the ice became mobile, flowing southward into the Victoria Strait as the surrounding first-year ice broke up earlier (Howell et al., 2006).

During the past 20 years, cruises gradually have become an important element of Canadian Arctic tourism, and currently there seems to be consensus about the cruise industry’s inevitable growth, especially in the vicinity of Baffin Bay. However, we have stressed the likelihood that sea-ice hazards will continue to exist and will present ongoing navigational challenges to tour operators, particularly those operating in the western regions of the Canadian Arctic.

Fast Forward to Summer of 2018:  Northwest Passage Proved Impassable

August 23, 2018 . At least 22 vessels are affected and several have turned back to Greenland.

Reprinted from post on September 3, 2018:  News today from the Northwest Passage blog that S/V CRYSTAL has given up after hanging around Fort Ross hoping for a storm or melting to break the ice barrier blocking their way west.
20180902-1025_crystal

As the vessel tracker shows, they have been forced to Plan C, which is returning to Greenland and accept that the NW Passage is closed this year. The latest ice chart gave them no hope for getting through.  Note yachts can sail through green (3/10), so the hope is for red to yellow to green.  But that did not happen last year.
20180902180000_wis38ct_0010210949

The image below shows the ice with which they were coping.
DCIM100GOPROGOPR5778.

More details at NW Passage blog 20180902 S/V CRYSTAL and S/V ATKA give up and retreat back to Greenland – Score ICE 3 vs YACHTS 0

Current Situation in Canadian Arctic Archipelago

The current ice map of Queen Maude region shows the difference between 2019 and last year.

Remembering that yachts need at most 1-3/10 ice conditions (light green), it is showing Peel Sound on the left side is open now, but was the obstruction last year.  Not shown but also important is open water in Barrow Strait allowing access to Peel Sound from the north.  Conversely, on the top right Prince Regent Inlet is plugged at the top and impassable for now, and perhaps for the year.

As reported at the Northwest Passage Blogspot, yachts are taking the Peel Sound route this year, rather than using Prince Regent Inlet and Bellot Strait, due to ice conditions. Excerpts in italics with my bolds.

Peel Sound, With Trepidation
by Randall
August 16, 2019
Days at Sea: 262
Over the last few days, charts have shown a significant reduction in ice concentrations in Peel, but there is still ice, lots of ice. One hundred miles into the Sound from the N, there is a band of 4-6/10ths ice that is sixty-five miles long and covers both the eastern and western shores. Another one hundred miles below that is a large band of 1-3/10ths ice. Below that there is open water, but it is threatened by the heavy ice feeding in from M’Clintock Channel.

Add to this an imminent change in the weather. Long range forecasts are calling for a switch from these long-running E winds to SW winds and then strong southerlies that could scramble the current ice configuration.
Add to this a paucity of anchorages in Peel. Two of the best on the W coast are icebound. The next, False Strait, is just above Bellot Strait and 165 miles from the opening.

In the evening I reach out to the ice guide, Victor Wejer, for a consult on anchorages. Mo needs a place to hide if things go badly. I show him the areas I’ve chosen.

“This is a subject I would like to avoid,” he replies. “It is not written in stone that you must take the entirety of Peel in one go, but it is the usual way. Read the Canadian Sailing Directions. The height of Somerset Island does weird things to the wind; it can go from calm to gale in an instant. Most of what look like anchorages on the chart are just not safe.”

“As to ice,” he continues, “this is also difficult. Peel is narrow and fed from M’Clintock. Most sailboat crews fight tooth and ice pole to get through. Consider that Matt Rutherford chose Prince Regent. But for you there may not be an option. Regent will not be clear for a long time; maybe not at all this year.”

By now four boats are through Peel, below Bellot Strait and on their way to Gjoa Haven. Yellow-hulled Breskell is one of them, but it has taken her four days to transit 200 miles, and I can tell from the way Olivier writes his encouraging emails that he has his doubts about doing it solo.

MO IS THROUGH THE ICE!
by Randall
August 19, 2019
1845 local
70 32S 97 27W
Larsen Sound
The Arctic

Just a quick note to report that Mo is through the ice and sailing fast on a N wind for Cambridge Bay, 235 miles SW.

I have been pushing to get to Alioth’s position for two days. She has a busted gear box and can’t make more than three knots under power. She has been hove to at the head of our last major ice plug waiting for an escort as she’d have to sail through, a tricky business.

We’ve all been sweating bullets over this last 30 miles of ice, and for four days I’ve been underway and hand steering for 18 to 20 hours a day through 3 – 5/10ths ice to get here. Only a few hours sleep a night this last week.

As it turns out, today was a piece of cake. We saw huge ice floes the size of city blocks but with wide lanes in between. Alioth and another boat, Mandregore, sailed downwind without trouble with Mo bringing up the rear under power just in case.

Which Comes First: Story or Facts?


Facts vs Stories is written by Steven Novella at Neurologica. Excerpts in italics with my bolds.

There is a common style of journalism, that you are almost certainly very familiar with, in which the report starts with a personal story, then delves into the facts at hand often with reference to the framing story and others like it, and returns at the end to the original personal connection. This format is so common it’s a cliche, and often the desire to connect the actual new information to an emotional story takes over the reporting and undermines the facts.

This format reflects a more general phenomenon – that people are generally more interested in and influenced by a good narrative than by dry facts. Or are we? New research suggests that while the answer is still generally yes, there is some more nuance here (isn’t there always?). The researchers did three studies in which they compared the effects of strong vs weak facts presented either alone or embedded in a story. In the first two studies the information was about a fictitious new phone. The weak fact was that the phone could withstand a fall of 3 feet. The strong fact was that the phone could withstand a fall of 30 feet. What they found in both studies is that the weak fact was more persuasive when presented embedded in a story than alone, while the strong fact was less persuasive.

They then did a third study about a fictitious flu medicine, and asked subjects if they would give their e-mail address for further information. People are generally reluctant to give away their e-mail address unless it’s worth it, so this was a good test of how persuasive the information was. When a strong fact about the medicine was given alone, 34% of the participants were willing to provide their e-mail. When embedded in a story, only 18% provided their e-mail.  So, what is responsible for this reversal of the normal effect that stories are generally more persuasive than dry facts?

The authors suggest that stories may impair our ability to evaluate factual information.

This is not unreasonable, and is suggested by other research as well. To a much greater extent than you might think, cognition is a zero-sum game. When you allocate resources to one task, those resources are taken away from other mental tasks (this basic process is called “interference” by psychologists). Further, adding complexity to brain processing, even if this leads to more sophisticated analysis of information, tends to slow down the whole process. And also, parts of the brain can directly suppress the functioning of other parts of the brain. This inhibitory function is actually a critical part of how the brain works together.

Perhaps the most dramatic relevant example of this is a study I wrote about previously in which fMRI scans were used to study subjects listening to a charismatic speaker that was either from the subjects religion or not. When a charismatic speaker that matched the subject’s religion was speaking, the critical thinking part of the brain was literally suppressed. In fact this study also found opposite effects depending on context.

The contrast estimates reveal a significant increase of activity in response to the non-Christian speaker (compared to baseline) and a massive deactivation in response to the Christian speaker known for his healing powers. These results support recent observations that social categories can modulate the frontal executive network in opposite directions corresponding to the cognitive load they impose on the executive system.

So when listening to speech from a belief system we don’t already believe, we engaged our executive function. When listening to speech from within our existing belief system, we suppressed our executive function.

In regards to the current study, is something similar going on? Does processing the emotional content of stories impair our processing of factual information, which is a benefit for weak facts but actually a detriment to the persuasive power of strong facts that are persuasive on their own?

Another potential explanation occurs to me, however (showing how difficult it can be to interpret the results of psychological research like this). It is a reasonable premise that a strong fact is more persuasive on it’s own than a weak fact – being able to survive a 3 foot fall is not as impressive as a 30 foot fall. But, the more impressive fact may also trigger more skepticism. I may simply not believe that a phone could survive such a fall. If that fact, however, is presented in a straightforward fashion, it may seem somewhat credible. If it is presented as part of a story that is clearly meant to persuade me, then that might trigger more skepticism. In fact, doing so is inherently sketchy. The strong fact is impressive on its own, why are you trying to persuade me with this unnecessary personal story – unless the fact is BS.There is also research to support this hypothesis. When a documentary about a fringe topic, like UFOs, includes the claim that, “This is true,” that actually triggers more skepticism. It encourages the audience to think, “Wait a minute, is this true?” Meanwhile, including a scientists who says, “This is not true,” may actually increase belief, because the audience is impressed that the subject is being taken serious by a scientist, regardless of their ultimate conclusion. But the extent of such backfire effects remains controversial in psychological research – it appears to be very context dependent.

I would summarize all this by saying that – we can identify psychological effects that relate to belief and skepticism. However, there are many potential effects that can be triggered in different situations, and interact in often complex and unpredictable ways. So even when we identify a real effect, such as the persuasive power of stories, it doesn’t predict what will happen in every case. In fact, the net statistical effect may disappear or even reverse in certain contexts, because it is either neutralized or overwhelmed by another effect. I think that is what is happening here.

What do you do when you are trying to be persuasive, then? The answer has to be – it depends? Who is your audience? What claims or facts are you trying to get across? What is the ultimate goal of the persuasion (public service, education, political activism, marketing)? I don’t think we can generate any solid algorithm, but we do have some guiding rules of thumb.

First, know your audience, or at least those you are trying to persuade. No message will be persuasive to everyone.

If the facts are impressive on their own, let them speak for themselves. Perhaps put them into a little context, but don’t try to wrap them up in an emotional story. That may backfire.

Depending on context, your goal may be to not just provide facts, but to persuade your audience to reject a current narrative for a better one. In this case the research suggests you should both argue against the current narrative, and provide a replacement that provides an explanatory model.

So you can’t just debunk a myth, conspiracy theory, or misconception. You need to provide the audience with another way to make sense of their world.

When possible find common ground. Start with the premises that you think most reasonable people will agree with, then build from there.

Now, it’s not my goal to outline how to convince people of things that are not true, or that are subjective but in your personal interest. That’s not what this blog is about. I am only interested in persuading people to portion their belief to the logic and evidence. So I am not going to recommend ways to avoid triggering skepticism – I want to trigger skepticism. I just want it to be skepticism based on science and critical thinking, not emotional or partisan denial, nihilism, cynicism, or just being contrarian.

You also have to recognize that it can be difficult to persuade people. This is especially true if your message is constrained by facts and reality. Sometimes the real information is not optimized for emotional appeal, and it has to compete against messages that are so optimized (and are unconstrained by reality). But at least know the science about how people process information and form their beliefs is useful.

Postscript:  Hans Rosling demonstrates how to use data to tell the story of our rising civilization.

Bottom Line:  When it comes to science, the rule is to follow the facts.  When the story is contradicted by new facts, the story changes to fit the facts, not the other way around.

See also:  Data, Facts and Information

Yes, Global Warming is a matter of opinion in Canada

Canada Survey Mostly Human

The map above shows the results of a survey in 2015 to measure the distribution of public opinion regarding global warming.  A previous post is reprinted below explaining the methods.  This post is about the media ruckus due to Elections Canada reminding environmental activists that climate advocacy during the upcoming Parlimentary campaign could be partisan politicking.  From the Star:

Ghislain Desjardins, a spokesman for Elections Canada, confirmed in an interview with me on Monday that yes, environmental groups were warned in a recent webinar that what they see as a fact — climate change — could become seen as a matter of mere belief in the heat of an election campaign. That’s a real possibility, since Bernier has used social media to muse along those lines in the past.

Elections Canada stresses that no one is gagging the environmentalists from stating the facts on climate change before or during the campaign. But if the existence of climate change becomes an election issue, some charities will have to be very careful about what they say in any advertising. Otherwise, they may be forced to register as “third parties” in the campaign, which could put their charitable status at risk.

Beliefs, however, aren’t the same as facts. That distinction is going to be important, if not crucial in this fall’s campaign — on climate change, but also on potentially hot topics such as immigration or refugee policy.

Thanks to Elections Canada and a warning it recently delivered to environmental activists, we’re seeing just how shaky the ground may get between facts and beliefs when the official campaign gets under way in a few weeks.

As the map above shows, it is a minority in most of Canada thinking that the earth is warming due mostly to human activity.  Below is a post explaining how this finding was obtained.

Update August 20, 2019

See also Lorrie Goldstein writing in Toronto Sun For climate alarmists ‘free speech’ exists only for them
Ironically, in 2015 the environmental charity, Ecojustice, urged Canada’s Competition Bureau, on behalf of six “prominent” Canadians, including former Ontario NDP leader and UN ambassador Stephen Lewis, to investigate Friends of Science, the International Climate Science Coalition and the Heartland Institute for climate denial.

A woman walks past a map showing the elevation of the sea in the last 22 years during the World Climate Change Conference 2015 near Paris. A new study asked 5,000 Canadians their opinions on the cause of climate change. (Stephane Mahe/Reuters)

As a Canadian living near Montreal, I was of course curious about this survey:
The distribution of climate change public opinion in Canada
Mildenberger et al. 2015 (here)

CBC created some controversy by switching headlines on its report of the findings.
First the title was:
Climate change: Majority of Canadians don’t believe it’s caused by humans
Then it changed to:
Canadians divided over human role in climate change, study suggests

I’m wondering what really was learned from this survey.

What Was Asked and Answered

With any survey, it is important to look at the actual questions asked and answered. While we do not have access to specific responses, the script for the telephone interviews is available. The first two questions asked about global warming (not climate change).

Survey Questionnaire

1. “From what you’ve read and heard, is there solid evidence that the average temperature on earth has been getting warmer over the past four decades?”
Yes
No
Don’t Know (volunteered)

2. [If yes, solid evidence] “Is the earth getting warmer mostly because of human activity such as burning fossil fuels or mostly because of natural patterns in the earth’s environment?”

Human Activity
Natural Patterns
Combination (volunteered)
Not sure / Refused (volunteered)

The finding reported in the Study:

Our results reveal, for the first time, the enormous diversity of Canadian climate and energy opinions at the local level.

At the national level, 79% of Canadians believe climate change is happening but only 44% think climate change is caused mostly by human activities.

So the 79% who said there’s solid evidence of warming the last 40 years got a followup question: mostly caused by human activity or mostly natural? Slightly more than half said mostly human, thus a result of 44% believing both that it is warming and that humans are mostly to blame.

Now some people were unwilling to decide between mostly human and mostly natural, and volunteered that it was a combination. This fraction of respondents was recorded as partially human caused, and they added 17% to bring the number up to 61%. The remaining 39% combines people who don’t accept evidence on warming and those who think warming is mostly natural or are uncertain about both issues.

From having done opinion surveys in the past, I suspect that many who were uncertain between human or natural causes didn’t want to say “don’t know”, and instead said it was a “combination”. Thus the group counted as “partially human-caused” is a soft number.

My suspicions are reinforced by a question that was asked and not included in this report: “How much do you feel you know about global warming?” Typically about 25% say they know a lot, 60% say they know a little, and the rest less than a little. As we know from other researchers more climate knowledge increases skepticism for many, so it is likely the soft number includes many who feel they really don’t know.

This process does determine a survey result about the size of the population who believes warming is happening and mostly caused by humans.  Everything else is subject to interpretation, including how much is due to land use, urbanization or fossil fuel emissions.  The solid finding is displayed in the diagram below:

Canada Survey Mostly HumanYes, the map shows I am living in a hotbed of global warming believers around Montreal; well, it is 55%, as high as it gets in Canada.

Responses on Carbon Pricing
Now consider the script for the last two questions on policy options

3. “There is a proposed system called cap and trade where the government issues permits limiting the amount of greenhouse gases companies can put out. If a company exceeds their limit, they will have to buy more permits. If they don’t use all of their permits, they will be able to sell or trade them to others who exceed their cap. The idea is that companies will find ways to put out less greenhouse gases because that would be cheaper than buying permits.

Do you strongly support, somewhat support, somewhat oppose or strongly oppose this type of system for your province?”

Strongly support
Somewhat support
Somewhat oppose
Strongly oppose
Not sure / Refused (volunteered)

4. “Another way to lower greenhouse gas emissions is to increase taxes on carbon based fuels such as coal, oil, gasoline and natural gas. Do you strongly support, somewhat support, somewhat oppose or strongly oppose this type of system?”

Strongly support
Somewhat support
Somewhat oppose
Strongly oppose
Not sure / Refused (volunteered)

And the finding is (from the report):
Despite this variation in core beliefs about climate change, we find widespread public support for climate policies. Support is greatest and most consistent for emissions trading. . . The overall pattern is clear: there is majority support for emissions trading in every Canadian district.

We find larger variation in support for a carbon tax across the country. At the national level, support for carbon taxation at 49% is just below a majority, with opposition at 44%.

Now here is the underlying motivation for the survey: to determine the level of support in the Canadian population for government action to increase the price of carbon-based energy. Not surprisingly, people who mostly know only a little about this like the sound of companies footing the bill for policies, more than the government raising my taxes. With a little more knowledge they will understand that cap and trade increases the cost of energy within all of the products and services they use, and therefore raises the price of pretty much everything. It is a hidden tax completely without accountability.

I described in some detail how this is already at work in Quebec by virtue of the province joining California’s carbon market: https://rclutz.wordpress.com/2015/04/15/quebec-joins-california-carbon-market/

Conclusion

No one should be surprised that those conducting this survey think they know the correct answers and want the population to agree with them. The sponsors include numerous organizations advocating for carbon pricing:

Thanks to the Social Sciences and Humanities Research Council of Canada, the Fonds de Recherche du Québec – Société et Culture, the Skoll Global Threats Fund, the Energy Foundation, and the Grantham Foundation for the Protection of the Environment for financial support. Funding for individual survey waves was provided by the Ministère des Relations internationales et de la Francophonie, the Public Policy Forum, Sustainable Prosperity, Canada 2020, l’Institut de l’énergie Trottier and la Chaire d’études politiques et économiques américaines.

And as we have seen with virtually all marketing-type surveys, opinion-makers know that conducting surveys is itself an intervention to raise awareness and concern about the issue.

Footnote:

Partiicipants were asked in 2015: “From what you’ve read and heard, is there solid evidence that the average temperature on earth has been getting warmer over the past four decades?”

uah-lo-since-1995

Looks to me that the evidence for warming in the first 20 years was solid, but the evidence since 1995 is not.

Global Virtue Replaces Local Accountability

Victor Davis Hanson writes at American Greatness Cosmic Injustice. The article comprises an extensive list of political escape artists, who raise abstract global concerns to distract from their incompetence facing real local problems and suffering. Excerpts in italics with my bolds.

Politicians ignore felonies in their midst, preferring to hector the misdemeanors of the universe

One of the weirdest characteristics of our global politicians and moral censors is their preference to voice cosmic justice rather than to address less abstract sin within their own purview or authority. These progressive virtue mongers see themselves as citizens of the world rather than of the United States and thus can impotently theorize about problems elsewhere when they cannot solve those in their own midst.

Mayors Preach Empathy While NYC Deteriorates

Big-city mayors are especially culpable when it comes to ignoring felonies in their midst, preferring to hector the misdemeanors of the universe. Notice how New York Mayor Bill De Blasio lords over the insidious deterioration of his city while he lectures on cosmic white supremacy.

Mayor Michael Bloomberg used to sermonize to the nation about gun-control, global warming, the perils of super-sized soft drinks, smoking, and fatty-foods in his efforts to virtue signal his moral fides—even as his New York was nearly paralyzed by the 2010 blizzard that trapped millions of his city’s residents in their homes due to inept and incompetent city efforts to remove snow. Or is the “Bloomberg syndrome” worse than that—in the sense that sounding saintly in theory psychologically compensates for being powerless in fact? Or is it a fashion tic of the privileged to show abstract empathy?

Governor Schwarzenegger Goes Green While California Goes Down

In the last years of Arnold Schwarzenegger’s governorship, Arnold more or less gave up on the existential crises of illegal immigration, sanctuary cities, soaring taxes, water shortages, decrepit roads and bridges, homelessness, plummeting public school performance, and a huge exodus out of state of middle-class Californians.

Instead he began to lecture the state, the nation, and indeed the world on the need for massive wind and solar projects and assorted green fantasies. His old enemies, jubilant that they had aborted his early conservative reform agenda, began to praise him both for his green irrelevancies and for his neutered conservatism—to the delight of the outgoing Arnold who was recalibrating his return to celebrity Hollywood.

Where Were the Sheriffs When Shooters Came

More recently, we often see how local sheriffs become media-created philosophers eager to blame supposed national bogeymen for mass shootings in their jurisdictions— killings that sometimes are at least exacerbated by the utter incompetence of local law enforcement chiefs.

Do we remember the horrific 2011 Tucson shooter, the mass-murdering ghoul who mowed down 19 people, killing six and severely wounding Representative Gabby Giffords (D-Ariz.)? Pima County Sheriff Clarence W. Dupnik, without any evidence, immediately claimed that conservative anti-government hate speech had set off the unhinged shooter.

One might have thought from Dupnik’s loud blame-game commentary that supposed outgunned deputies on duty had shot it out with the killer in a running gun battle, and that he was furious that talk radio or right-wingers had somehow impeded him from getting enough bullets or guns to his men to protect the victims from such a right-wing ideologue.

Hardly. This shooter had devoured both the Communist Manifesto and Mein Kampf. He was mentally unstable, drug addled, and without coherent views on contemporary issues, and thus no foot soldier in some vast right-wing conspiracy or any other conspiracy. He was certainly less connected to the Right than the Washington, D.C. shooter who tried to take out much of the Republican House leadership in 2017 was connected to the Left.

Again, no matter. The ubiquitous Dupnik in his efforts to translate his own incompetence and failure to secure the area where Giffords was to speak into media-driven celebrity, in cheap fashion blasted the Tea Party, critics of President Obama, and, of course, Rush Limbaugh as the culprits.

In truth, security in the supermarket parking lot where Giffords and others were shot was nearly nonexistent, a fact Dupnik never really addressed. He seemed unworried that he had not sent out deputies to ensure a U.S. congresswoman’s safety while conducting an open-air meeting with her constituents.

Florida Sheriff Scott Israel sought national media attention for trying to connect the horrific Parkland Florida mass shooting at Marjory Stoneman Douglas High School (17 dead), which took place in his jurisdiction, to the National Rifle Association and Republican politicians in general. But it was Israel’s own Broward County Sheriff’s Office that responded slowly to the killings. In some cases, Israel’s officers exhibited timidity and refused to enter the building to confront the deranged mass shooter.

Before Israel lectured an international television audience on the evils of lax gun laws he might have at least ensured that his own sheriffs were willing to risk their lives to protect the endangered innocent.

Dot-Com Wealthy Live High Above the Disasters on Their Doorsteps

If we sometimes wonder why for years saintly Apple, Facebook, and Google have thrived in a sea of homelessness, amid pot-holed streets lined with strapped employees living in their cars, a good indication might be that the cosmic social justice so often voiced as penance by their woke multibillionaire bosses exempts them from worrying about the disasters in their midst.

Pope Francis Calls for Open Borders from Behind Vatican Walls

Pope Francis recently lambasted a number of European countries and leaders for their apparent efforts to secure their national borders against massive illegal immigration from North Africa and the Middle East. Francis plugged European ecumenicalism and seemed to dismiss the populist and nationalist pushback of millions of Europeans, who see the EU as both anti-democratic and a peril to their own traditions and freedoms as citizens.

However, before Francis chastised the continent for its moral failings, he might have explained to Italians or Greeks worried over their open borders why the Vatican enjoys massive walls to keep the uninvited out and yet why other European countries should not emulate the nation-state Vatican’s successful preemptive fortifications.

Better yet, the pope might have taken a more forceful stance against the decades-long and ongoing legal dilemmas of hundreds of global Catholic Clergy, who have proven to be pedophiles and yet were not turned over to law enforcement. The cosmic idea of a United Europe is easy to preach about, but reining in what is likely an epidemic of child-molesting clergy is messy. Francis’s frequent abstract moralizing is quite at odds with either his inability or unwillingness to reform pathways to the priesthood, some of whose members have ruined thousands of lives.

Politicians Unwilling to Address Concrete Crises

What was lacking in the recent Democratic debates were concrete answers to real problems—as opposed to candidates’ nonstop cosmic virtue signaling. It is easy to blast “white supremacy” and “the gun culture” from a rostrum. But no one on stage seemed to care about the great challenge of our age, the inner-city carnage that takes thousands of young African-American lives each year. The inner-city murdering is tragically almost exclusively a black-on-black phenomenon (even rare interracial homicides are disproportionally committed by African-Americans) that occurs in progressive-run cities with strict gun control laws.

When leaders virtue signal about global or cosmic sin, it is often proof they have no willingness or power to address any concrete crisis. The public tires of such empty platitudes because they also see the culpable trying to divert attention from their own earthly failure by loudly appealing to a higher moral universe.

More mundanely, there is the role of hypocrisy: elites themselves never suffer the consequences of their own ethical inaction while the public never sees any benefit from their moral rhetoric. Illegal immigration is not a personal issue for Pope Francis, and most Europeans have more concrete things to worry about than lectures on populism and nationalism.

Disconnected from Real World Dangers

In the same fashion, New Yorkers in 2011 were worried more about the piles of snow on the sidewalks than they felt threatened by 32-ounce Cokes—while realizing that no snow blocked either the Bloomberg official or private residence.

Note a recent inexplicable Zogby poll that indicated 51 percent of blacks and Hispanics might support Donald Trump. How would such a supposedly counterintuitive result even be possible?

I have a suggestion: minority communities live first-hand with the violence and dangers of the gang gun culture. More policing and incarceration of guilty felons improve their lives. Secure borders mean fewer drug dealers and cartel smugglers in local communities, fewer schools swamped with non-English speakers, and social services not overwhelmed with impoverished non-Americans.

These can all be real concerns for beleaguered minorities. Yet they are virtue-signaled away by progressive elites whose own power and money allow them to navigate around the consequences of their own liberal fantasies that fall on distant others.

Add in a booming economy, rising incomes, and low unemployment for minorities, and the world of shrill yelling on the debate stage about “white privilege” seems some sort of an irrelevant fixation of the elite and privileged, akin to showing off a Gucci bag or Porsche Cayenne—but otherwise nothing to do with dangerous streets, wrecked schools, whizzing bullets, and social services that are becoming inoperative.

The next time a legislator, mayor, or governor rails about plastic straws or the Paris Climate Accord, be assured that his state’s roads are clogged, his public schools failing—and he is clueless or indifferent about it.