Priority 1: Abundant Energy, Not Net Zero (Biggers & Wright)
Lucy Biggers of Free Press interviews US Energy Secretary Chris Wright regarding the paramount role of energy development and access for civil and social wellbeing. For those who prefer reading I provide a transcript lightly edited from the captions with my bolds and added images LB refers to comments from Lucy Biggers and CW to words from Secretary Wright.
LB: Wright has one of the most consequential and least understood jobs in Washington. As Trump’s Secretary of Energy, he oversees the department responsible for shaping America’s energy future, directing billions of dollars in research and development, influencing which technologies are built and scaled, and helping set the policies that will define the country’s energy system for decades to come. Under Wright, the Department of Energy has taken a sharp turn away from the policies of the Biden and Obama administrations.
Instead of a major focus on climate change and a renewables-first agenda that sought to reduce reliance on fossil fuels: “The United States will be 100% clean energy economy with net zero emissions.” Wright has embraced the policy of what he calls energy abundance, an all-of-the-above strategy that prioritizes expanding access to all energy sources, including fossil fuels.
The bet of his administration is that long-term human prosperity depends
not on using less energy, but on producing far more of it.
It’s an approach that has its detractors, but one that the administration has shown it’s not scared to pursue. As a former climate activist who once believed in climate doomerism and now believes this fear-based narrative left out important parts of the story, I sat down with Secretary Wright to understand what an energy abundance mindset looks like in practice and why he believes it offers a better path forward for America and the whole world.
Secretary Wright, welcome to The Free Press. Thank you so much for being here today.
LB: So for people who aren’t familiar with your worldview, can you kind of explain how you think about energy compared to maybe what we see from the news and the mainstream?
CW: Yeah, but if you’re not in the energy business, I totally get why would people know the energy business? It’s complicated and if your energy system works, why would you even worry about it? I’ve just always looked at how does energy impact the quality of your life or anyone’s life? It is the transformative agent that created the modern world. Human life expectancy was 30 years, 20,000 years ago.

Energy Sources and the Rise of Civilization. Source: Bill Gates
Human life expectancy at birth was 30 years, 200 years ago. It was only really the large-scale arrival of coal that gave so much more energy, that made agriculture more efficient, that allowed people to do things. Ultimately, the arrival of oil that allowed the development of modern medicine, well, average life expectancy at birth today is over 70 years.

That’s energy delivering that. Energy delivers the public health benefits that spread to everyone, but not everyone lives a highly energized life. Only about a billion, Lucy, live like you and I and your listeners. We got climate-controlled rooms, we got lights, we take buses and trains and planes and- Running water. Running water. I mean, that stuff’s awesome.
But only about a billion people have that fully energized life. About seven billion people, I’ve met a lot of them, not all seven billion, but I haven’t met one of them that doesn’t want a lifestyle like you and I. The only road from where we are today to that road is just massively more energy. I’ve been all in on more energy my whole life.
LB: When you entered office, what was the state of our energy system based on your predecessors?
CW: The Department of Energy, where I am, didn’t want to touch hydrocarbons, didn’t want to be photoed with anything associated with hydrocarbon. All of their money was wind, solar, and batteries, which is 3% of global energy, about 3.5% of American energy. Then decarbonization things, like if you did carbon capture at a coal plant. You couldn’t talk about coal plants, but they wanted to look at technologies to capture carbon. In fact, they funded a project that was decarb mac and cheese. Like a giant food company that makes mac and cheese, they were giving them grants, tens of millions of dollars to change their process to reduce the CO2 emissions from the production of mac and cheese.

So just crazy. All it meant is if you did that process, like mac and cheese is a little bit more expensive, and they thought, well, people don’t care. They’ll just pay a higher price. What’s the benefit of minute decarbonization? The honest answer to that is zero. Were they shutting down coal plants? Absolutely. The administration, their scoreboard on energy was shutting down as many coal plants as they could have.

In fact, when we got into office, the plans in place and the resource plans for utilities across the country were, over the next five years, to shut down a net 46 gigawatts of generation. So that’s like 40,000 homes. So 100,000 people. I mean, it’s huge. And they’re shutting down firm generation, meaning that it works 24-7 whether or not the wind is blowing or the sun is shining.

We also think the arrival of AI now, and people want to restore manufacturing here, modern manufacturing. We’re going to have robots and automation. So our projections show we need about 100 gigawatts, which is a huge number of additional generation in the U.S. over the next five years. And we inherited plans that were going to be minus 46. So then we’d have to build 150 to get up to our 100. So we thought, well, let’s stop digging the hole first. Then we must only build 100 instead of building 150.
LB: The Trump administration is represented in the media by most of our outlets. The headline, they’re saying, oh, they defunded renewables. Isn’t this so evil? Bring people over to how you see it.
CW: I say energy is just about humans and math. We produce energy to make people’s lives better. And of course, environmental impacts factor into that. Clean air, clean water, beautiful wilderness. We care. If you become wealthy humans, you care about all those things. And so to me, it’s just about doing the math. And as I mentioned, the world has spent $10 trillion on wind, solar, batteries, and the transmission to connect these remote resources. And it’s 3% of global energy.

And if you have high concentrations of renewables, like the countries that have led in this, Germany, the United Kingdom, and Denmark, they have the largest percent of those resources. They have the three most expensive electricity prices in the world. I mean, it is massive. And of course, what it did, for example, in England, it just deindustrialized the country. The government had to step in about a year and a half ago to stop the closure of the last steel furnace in the country.

This is the fifth largest economy in the world. And the birthplace of the Industrial Revolution was not going to make one scrap of steel in their country. You cannot have a modern world without steel, cement, plastics, and fertilizer. Vaclav Smil, the greatest energy scholar of our time, calls them the four pillars of the modern world. We use 20% of energy, global energy, just to produce those four materials. But if you want any of the things you’ve got in your life, you can’t survive without those four materials. But they’re energy intensive to make.

So in the United Kingdom, they have the largest reduction in greenhouse gases. They’re very proud of that. They’ve reduced their greenhouse gas emissions by about 40%. What they don’t tell you is they’ve reduced the total energy production in their country by about 40%. So they’ve just exported all their industry. It used to be in a natural gas powered plant in the Midlands of England. Now its same product is built in a coal fired power plant in China, loaded on a diesel powered ship that ships halfway around the world, delivers it to a dock, and it’s loaded on a truck, and they deliver it to their house. And they call that green. That’s clean and green.
You’re just moving emissions. That’s not reducing emissions.
That’s just impoverishing people and sending jobs out of your country.
There’s roles for solar. Remote African villages to charge cell phones. There’s going to be power in space. We use solar panels in space. So there’s roles for it. But is the world ever going to run on solar panels and wind turbine? Absolutely not. Two reasons of that. England, as I said, has gone so crazy. They’ve tripled their electricity prices. They plummeted their industry. You know what percent of energy in this wind, solar gone wild country? 6% of the primary energy. That’s like the peak. When the sun’s shining and the wind’s blowing perfectly. But they have so much that their total energy is still only 6%. England, that went crazy on this, gets 75% of its energy from oil and natural gas.

You can’t run a country or a modern world. You can run an electricity grid some of the time without them. But electricity is just one slice of energy. In fact, to build solar panels or to build wind turbines or to build batteries are massively hydrocarbon intensity, which is why most of it’s built in China. You need lots of high temperature heat, lots of energy in manufacturing, lots of energy used in the mining of it. And then the materials themselves, they’re made out of hydrocarbons.
LB: Those blades, giant wind turbine, those are oil. I think for most people, the big thing on their mind when it comes to our energy system is climate change in our energy system. So I really want to hear from you. How do you factor in climate change when you’re making decisions?
CW: Yeah. So look, I’ve been fascinated by climate change for 25 years. And the more you look into it, it’s a real thing. We’ve increased atmospheric CO2 concentration from a little less than 0.03% to a little more than 0.04%. 50% increase. So it’s not nothing. It does absorb infrared radiation. It is contributing to the warming of the planet and will continue to for quite some time. So it’s a real issue. It’s just not even remotely close to the world’s biggest problem.

I mean, if you were honest, it wouldn’t make a top 10 list. And so they used to try to sell people fear about: it’s so hot and we’re not going to be able to go outside. It’s so crazy. I mean, if it’s warmed in Fahrenheit 2 degrees over the last 125 years, we can change the room you and I are in by 2 degrees and I wouldn’t even notice. Maybe you might, but I’m not that sensitive. I wouldn’t even notice 2 degrees in like 20 minutes. So 120 years, it’s not nothing, but it’s not that big of a deal.

That turned out to be a tougher sell. So they moved it to extreme weather because hurricanes and tornadoes, these things are terrifying and they are big. But of course, and it’s in the IPCC (intergovernmental panel on climate change) reports, there’s no trends in the increasing in the frequency or intensity of hurricanes, of tornadoes, of floods, of drought. And so then it was about deaths from them.

My Mind is Made Up, Don’t Confuse Me with the Facts. H/T Bjorn Lomborg, WUWT
And of course there is a massive trend there. We went from 500,000 people a year on average dying back in the 1920s from extreme weather globally. That’s massive. Last year, just under 10,000 deaths. So from 500,000 down to 10,000, that’s a 98% decline. And we have four times more people in the world.
So the thing about extreme weather is awesome. Hydrocarbons and great energy have just made life so much safer. And those 10,000 deaths are still tragic. And they’re in low income countries that don’t have modern construction and modern energy to make them robust and safe from that weather. More hydrocarbons, more hydrocarbons are what’s going to save those 10,000 lives. We still have death from extreme weather, not less hydrocarbons in theory to change the weather because it doesn’t.
LB: It will slightly change the rate at which the planet’s warming, but no one noticed that. You hear net zero, I think was this big thing everyone wanted to go for for a while. Explain what are the follies of net zero and the downsides of that.

CW: This comes from the Paris Climate Gathering, this Congress of the parties of the annual climate gathering. And it actually came from activists. This was not a scientific thing. Even in the Intergovernmental Panel on Climate Change, they do their own economics. Their own 2050 is a colossally bad idea that the cost to achieve it is something like 10 times the potential benefits and reduce climate damage. William Nordhaus, who won the Nobel Prize on climate economics, did an economic analysis of this, saying you should only reduce greenhouse gas emissions in areas where the cost to reduce them is less than the benefits you gain.

It’s just sort of how we look at everything else in life. I wouldn’t spend $10 for something I valued at 50 cents, but that’s what we do in the climate world. We spend $10 for maybe a quarter or a nickel or a dime of potential benefits. Net zero 2050 is really just a massive human impoverishment program.
LB: And then you have your own 2050 goal, which would be end energy poverty by 2050. Yeah, people want a passionate, aggressive goal.
CW: It’s realistic that we could massively reduce and effectively end energy poverty by 2050. And to give a little color on that, there’s about 2 billion people, a quarter of humanity, that still cook their daily meals and heat their homes or huts burning wood. Could be agricultural waste or dung, but it’s mostly wood indoors, just like all of our ancestors did.

Just like I do when we go camping in the woods when you can build a wood fire. If you’re high on glaciated mountains, you carry propane, you’re in the modern world. But in these 2 billion people that live that way, the World Health Organization estimates 2 to 3 million deaths from the indoor air pollution from burning that, from particulate matter. These are low temperature fires. It’s incomplete combustion. You’ve got smoke and particulates in the air.
That’s why I launched a Bettering Human Lives Foundation to make small loans to businesses that are delivering clean cooking fuels. To me, that is the biggest global energy challenge by far. Climate change isn’t even on the map compared to clean cooking fuels. We can save 2 to 3 million lives a year with technologies we already have today. And as we are customers in Africa, that’s neat. Maybe it’s going to make them live longer, but that’s not their motivation at all. Their motivation is it liberates women. Women do all the manual labor in traditional societies. And if you’re in Africa or South Asia, the women are getting up before the sun is up to gather wood, to start the fire, to cook the morning meals. Then they tamp the fire down. They don’t want to put it out, but they tamp it down so it won’t consume too much wood. They tend to that fire.
And then at the end of the day to cook the evening meal, they’ve got to stoke it back up. They just spend hours over this fire and gathering wood. Pretty much limits their life possibilities. And of course, the children are with them as well. They’re all suffering these health impacts. But for our customers there, it’s about liberation of women. You get a propane cookstove and you open the knob and you light the thing. You can cook. You can leave it on at low level and heat it at night. You can turn it on and off in like a flip of twisting a little knob. It’s just game changing.

I was at an event four or five years ago. There was a COP in Glasgow, COP 21. I don’t know, it was several years ago. 19 of the wealthiest nations in the world, the European nations, the United States, Canada, all pledged that they would no longer lend to the developing world for anything related to hydrocarbons. Think about that. In the United States, all of our countries run on hydrocarbons over 85% of our energy. Even in England, just oil and gas are 75%.
But they thought they were doing a good thing to pledge that they would not help those two billion people that want better lives and longer lives and healthier lives and liberated lives, that they would stand in the way of that. They thought they were proud of that. That was repulsive to me. I aggressively called this out, including the guy who was behind it, who later denied, we didn’t do that. But we did do that.

LB: You look in the US, I think, luckily, we’ve missed out on most of the insanity. But you have California, which I think has doubled down a lot. They have $8 gas in some places. They have the second highest electricity bills in the country. It is crazy what happens in California.
CW: Yeah, California, they used to have similar electricity prices to Florida. Today, they’re more than twice as high as Florida. Just in the last 15 years, this has been driven. Here’s another funny fact. Even though they have way more people than Florida, California produces 20% less electricity than Florida does, but at a way higher cost.

They have declining electricity production. Maybe most telling, they have the highest adjusted poverty rate of any state in the nation. Just because people that make a wage that would be not a bad lifestyle wage in middle America, it’s just very hard to live in California, to pay very high utility bills, to pay very high gasoline, to fill your truck, to go to your job.
They’ve made life really rough in California for low-income people, which has been my passion. What we want energy to do is to lift people up, give them broader life opportunities, longer lives, higher quality lives. Enjoy the wonderful things you and I enjoy, Lucy, and in our own country. California just pedals hard against that. They keep just so many millions of people needlessly in poverty 
As he said, on a climate perspective, they don’t even move the needle. California gets a greater percent of its energy from oil and gas than the rest of the country as a whole. 76% of all the energy consumed in California comes from oil and gas. It’s not like they’ve gotten rid of oil and gas. They’ve just made them more expensive. They’ve just made it harder for people to pay their bills. They’re not changing at all global greenhouse gas emissions. The biggest source of electricity, all the money is in the electricity sector. It’s just one sector of energy. But what’s the biggest source of electricity in California? It’s natural gas.
LB: What’s the second biggest source imported from other states? Have you done the numbers or have other people done the numbers? If we were even to go to net zero, say the dream is accomplished, we accomplish this utopia, what is it?
CW: It would prevent 0.1 degrees of warming, maybe, hypothetically. If the US did, yes. I did this. if the whole US went net zero, you wouldn’t quite get to 0.1 degrees C reduction in warming. That’s like a century or more out from here. It’s just nothing. In Colorado, my own state passed a law of it. It wouldn’t even be close to 1,100th of a degree. We couldn’t even measure that difference.
When these states pass these net zero policies, they think they’re saving the climate. All they’re doing is making energy more expensive in their state. Economic activity just moves out of their state. They aren’t even doing the reductions they think they’re doing. Most of it’s just moving emissions from this jurisdiction to that jurisdiction. The atmosphere doesn’t care where the emissions came from.
LB: Offshoring or manufacturing to China and India where these places don’t have the policies that we have. The emissions just move there. Exactly. I would say, yeah, United Kingdom, you could argue their net impact on emissions has been up, not down.

CW: Right, because it’s going to dirtier places. From natural gas manufacturing to coal manufacturing, and then all the massive transport to move the goods back around the world back to the UK. To me, climate change is a real thing. I’m interested in it. The only needle mover so far has been natural gas. If nuclear energy becomes huge, today it’s still less than 5% of global energy, but someday I think it’s going to be 30, 40, 50. It’s going to be a giant percent of global energy. That may be generations from now, but we want to get that ball moving because it can be a giant global energy source.
Wind and solar never can be because they’re very energy intensive to make them. They only work intermittently and they take so much land. They’re only in the electricity sector. All the electricity sector combined around the whole planet delivers 20% of global primary energy. They’re going to top out. You can’t build solar panels and wind turbines without massive hydrocarbons. They’re never going to be meaningful to global energy supply.

Nuclear can be meaningful to global energy supply. It’s just much more energy dense. It works 24-7.
You can get not just electricity, you can get process heat out, which is the biggest and most important form of energy. It’s high temperature process heat to make steel, to make cement, to make aluminum, to make polysilicon, to make plastics, to make all of the materials that make our lives possible.
LB: What is your priority right now as Energy Secretary? Is it grid reliability? Is it affordability? Is it all of the above? What do you think?
CW: It’s all of the above. We better energize our country. People are frustrated because in the Biden administration, electricity prices went up 30% and we didn’t produce any more electricity at the end. We didn’t get any benefit. We just got higher costs. No meaningful movement on greenhouse gas emissions. What we want to do is stop the rise in electricity prices, ultimately see them go down. We want to see a lot of jobs in manufacturing come back to our country. We’re building a new aluminum smelter in the United States. We’re reshoring semiconductor manufacturing.
We’re still going to trade with the rest of the world. All that’s going to happen, but more of this should be built in the United States. With these intelligence factories, data centers, they consume a lot of electricity, but they deliver just massive productivity. They’re going to raise people’s income. They’re going to help us find cures for cancer. They’re going to help us find cures for all sorts of conditions that are death sentences today. Our kids are going to live a longer, healthier life than previous generations because the pace of innovation is going to be unbelievable.
LB: Let’s talk about AI data centers a bit because they seem to be the new enemy number one, kind of like fracking was, I would say, in the 2010s where everyone was freaking out about fracking. Now everyone’s freaking out about AI data centers. They’re guzzling water, electricity. Can you give me the facts on what is the reality of this situation? It’s the same script, the same facts, and the same people, and the same groups. It’s just easy to sell fear, and it’s hard to sell reassurance.
CW: They say they guzzle energy. They’re driving up your electricity prices. The data is actually the opposite. The states with the fastest demand growth with electricity have the best price performance. The states with the fastest rising electricity, like California, Massachusetts, and Maryland, they actually have declining demand for electricity. When you build a new data center, you’ve got to build a new electricity generation together with it, which is what we’re doing right now.
You build more generation than the data center will consume. The data center builders will pre-fund the generation of this. Then we sign these multi-year, three to five-year rate freezes on electricity. I mean, dead in its track, the rise in electricity prices is over. In fact, that’s the start of the pathway. Because they’re adding more to the grid? Because they’re adding more to the grid than they’re going to be consuming from it, and they’re adding reliable, dispatchable sources. The greater percent you have of reliable electricity, the lower your electricity prices are going to have. The more intermittent sources you have, the more kit you have to operate to deliver the same amount of electricity, it’s just more expensive.
LB: You could see places like Apple or Google, these places building these AI data centers, which are private companies, essentially adding to the grid because they need the capacity?
CW: They are doing that today. Google did a great deal in Georgia, signed an agreement up front to build, to invest, to build this new electric generating capacity while they’re building their data center. They got a four-year rate freeze before their data center is even done. Everyone in Georgia that had these huge electricity price rises in the last three, four, five years, they’re not going to have them the next three or four years.
Same thing in Alabama. We did the same thing in Indiana. Now, it’s not statewide yet, but it’s in the regions where these data centers are. The more these data centers go in, the more we’re going to stop all of the rises in electricity. The more we’re going to grow jobs in those areas, particularly blue-collar jobs. By this, making it hard to permit and build stuff in our country, we sent so many of these manufacturing jobs overseas and we stripped our rural communities of a lot of their job base.
This led to opioid and depression and all sorts of social problems, as well as the economic problems.
Data centers and reshoring manufacturing is going to bring
high-paying jobs back to those regions and areas.
In fact, we’re quickly going to go from people struggling, they’ve got good skills, but they can’t find a job. We’re going to have a shortage of people with those skills. I’m going to welcome this because it’s already raising wages and it’s going to get more people in high school to say, hey, maybe I’m good with my hands or I’m super interested in building and repairing things, as most kids are. That’s an awesome career opportunity. I’m going to develop those skills. I’m going to get out of high school and two years later be making $100,000 a year and have a career path to double and triple my income in the next few decades. That’s restoring the American dream to people that don’t live in New York City and are highly successful.
LB: One more thing before we move on from AI data centers is the water. That’s just one thing I hear so much. I believe it’s very overstated, but you’ve seen AOC has a jug of dirty water in Congress. What’s going on with that?
CW: It was the same thing they said with fracking. It’s taking all the water. It’s just complete nonsense. We trotted out the numbers. Golf courses use four times more water than all the fracking in the whole United States. Golf courses use far more water than all the data centers in the United States. In fact, most of the new data centers now are built with these closed-loop cooling systems and they use almost no water. You take these giant data centers. We visited one in Iowa. It’s 600 acres, so almost a square mile, but it’s $55 billion that are being invested in there. 10,000 high-paying jobs. It’s incredibly exciting. That 600-acre data center will use the amount of water equivalent to farming corn on two acres. It’s just a tiny amount of water. The water thing is just, if you can scare people about water, you can scare people. It’s just pure fiction, but it works, but it’s false.
LB: If you’re looking ahead at the energy mix, it’s nuclear, natural gas. What does that mix to you, ideally?

CW: Those are the two biggest drivers for sure. If you want to build new generation today, what’s the most cost-effective? I mean, natural gas just hands down. The United States just has a massive amount of natural gas. 20 years ago, we had 1,000 rigs drilling for natural gas in the United States. We were the biggest importer in the world of natural gas. Today, we’re the largest exporter of natural gas in the world. We’ve more than doubled our production, and we have a little over 100 rigs running for natural gas. Think of that efficiency and technology. Just 90% less drilling rigs, massively more production, and just centuries of gas.
I went to MIT to work on fusion energy. That’s going to come too. That’s what powers the stars. It’s so exciting. We’re going to deliver that too. The challenge is going to be just making those machines cheap enough and economic enough that that makes sense to grow it. But humans are ingenious.
I suspect we’ll figure that out. Fusion will be a major energy source. In another generation or two, it’s coming.
LB: You’re prioritizing energy abundance. You’re rejiggering the entire globe around oil. I do think that the work you’re doing is still commando, but it’s not breaking through to the average person yet. I feel like there’s still this feeling of despair, and things are getting worse, and the AID centers are ruining the planet. Do you think there’ll become a point where what you’re doing will become just impossible to ignore?
CW: I think it’ll be during this administration, because I’ve done a lot to engage in dialogues with Democratic senators and Democratic governors. How much do you hear about climate change from Democrats now? Massively less. When you do, it’s the wackos on the far left. The more moderate Democrats, I was shocked to hear them say climate crisis, and we’re going to prevent this. If you met them at a cocktail party dinner, these are normal people. We’re saying just crazy stuff about climate change. We published a paper last summer from the DOE, an overview of climate change by five awesome climate scientists. We’re bringing out the facts that you talk about, Lucy, straight to the politicians in Washington.
Of course, a lot of them are realizing, they may have gone a little too far on that. The New England governors that didn’t want more natural gas to come to New England, all of them say, yeah, we want that pipeline now. We are changing the Overton window of what’s possible in politics permanently.
If crazy AOC becomes president, that pendulum will swing back, but it will not be able to go back to where it was, because it was just so foolish. Too many people are puncturing that bubble. By making energy more expensive and claiming you’re saving the world from climate change, you’re not moving global greenhouse gas emissions, and climate change is a slow moving thing.
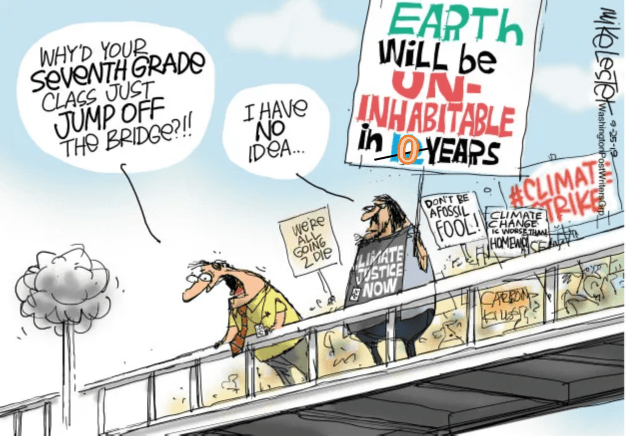
We should stop scaring kids, running around with our heads on fire, preventing young people like you from wanting to have children because they think the world’s falling apart. How do we ever make a world a better place by making young people pessimistic and fearful, and wrongly pessimistic and fearful? That’s just crazy town. What we’re trying to do is engage, engage, engage on those dialogues, on those discussions to make people realize energy matters, cost of energy matters to the quality of people’s lives.
The world just needs massively more energy. I’m not an advocate for one energy source or the other. I’m just an advocate for humans and math. The advantages of oil, gas, and coal today are so compelling, but to me, that’s the excitement. Let’s drive nuclear forward. Let’s make it so it is compelling. It can compete and ultimately displace hydrocarbons. The next generation downhole geothermal that I first worked on 30 years ago and then more recently, that is coming. There’s a 400 megawatt, firm, reliable, dispatchable power plant being built in Utah. Gigawatts of new geothermal power will be developed in the Western United States and could ultimately be deployed in the Eastern U.S. in the near future.
Fusion energy’s coming, you know, any new energy innovations and technology, we’re for all of them. We are still researching in our labs on new solar technologies. We’re truly the ones for whatever works, whatever the mass supports. What we’re not for is subsidizing some energy technologies that we know have a low ceiling, making energy more expensive, and trying to strangle the stuff that actually works and is realiable and affordable. We’re just trying to bring common sense and science back. And by doing that, the world is going to be better energized. Economic opportunities are going to grow Costs are going to go down, and people are going to be more optimistic about their futures. The next generation is going to have the greatest world ever. I can’t wait to see it unfold.

LB: So, you think electricity costs are going to come down? You think that will happen?
CW: They’re going to freeze first, which in inflation-adjusted terms is equivalent to coming down. And then 5 to 10 year down, if we continue these policies, you will start to see electricity prices coming down even in nominal terms.
LB: And $2 gas, is that in my future?
CW: It certainly could be. Gasoline prices are going to continue to lower throughout the Trump administration because we’re growing energy production. We’re just bringing common sense back to the processes to deliver gasoline to your house and all that. In inflation-adjusted terms, gasoline will continue to go down meaningfully in percent of your wallet, percent of you pocketbook, which is really what matters. You know, gasoline prices could be near an all-time low by the end of the Trump administration.


 1. Intermittency is not a rounding error; it is the dominant cost driver. Even with batteries, MTerra is engineered for ~12–13 hours of mid-merit output. The remaining 11–12 hours (and any multi-day typhoon-induced lull) still require dispatchable backup. My own peer-reviewed analysis of ancillary-service burdens shows that adding solar and wind to a reliable grid inflates total system costs by 135–235 % once frequency regulation, inertia, voltage support, and ramping are properly valued. The raw LCOE of ~$40/MWh becomes a delivered cost of ~$500/MWh.


