Magnetic Pole Swapping and Cooling

The Earth’s North magnetic pole has been wandering at 10-year intervals from 1970 to 2020, as seen in this animation from the National Centers for Environmental Information.

This post discusses solar and geologic magnetic pole swapping (not with each other of course) and the implications for humans. First the earth and later on the sun.

What On Earth?

Newsweek chose to report yesterday on earth’s meandering north pole as shown in the cool graphic above. That article (here) aims at sensational possible calamities, including high energy radiation, space particles, ozone depletion and electrical blackouts. A more sober assessment is provided by the conversation Why the Earth’s magnetic poles could be about to swap places – and how it would affect us By Phil Livermore and Jon Mound of U. Leeds.Excerpts below with my bolds.

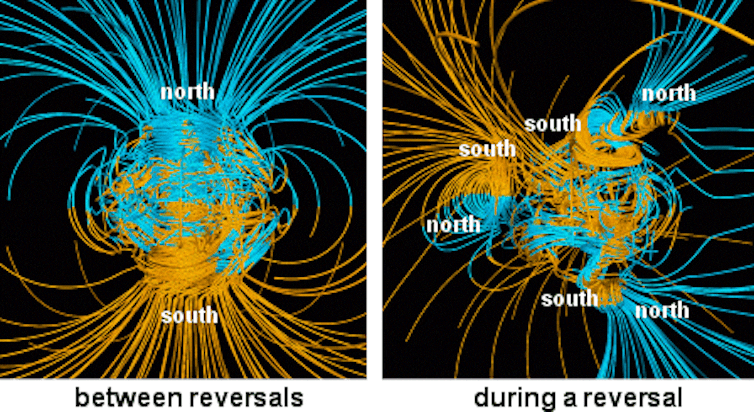
The Earth’s magnetic field surrounds our planet like an invisible force field – protecting life from harmful solar radiation by deflecting charged particles away. Far from being constant, this field is continuously changing. Indeed, our planet’s history includes at least several hundred global magnetic reversals, where north and south magnetic poles swap places. So when’s the next one happening and how will it affect life on Earth?

During a reversal the magnetic field won’t be zero, but will assume a weaker and more complex form. It may fall to 10% of the present-day strength and have magnetic poles at the equator or even the simultaneous existence of multiple “north” and “south” magnetic poles.

Geomagnetic reversals occur a few times every million years on average. However, the interval between reversals is very irregular and can range up to tens of millions of years.

There can also be temporary and incomplete reversals, known as events and excursions, in which the magnetic poles move away from the geographic poles – perhaps even crossing the equator – before returning back to their original locations. The last full reversal, the Brunhes-Matuyama, occurred around 780,000 years ago. A temporary reversal, the Laschamp event, occurred around 41,000 years ago. It lasted less than 1,000 years with the actual change of polarity lasting around 250 years.


In 2003, the so-called Halloween storm caused local electricity-grid blackouts in Sweden, required the rerouting of flights to avoid communication blackout and radiation risk, and disrupted satellites and communication systems. But this storm was minor in comparison with other storms of the recent past, such as the 1859 Carrington event, which caused aurorae as far south as the Caribbean.

The simple fact that we are “overdue” for a full reversal and the fact that the Earth’s field is currently decreasing at a rate of 5% per century, has led to suggestions that the field may reverse within the next 2,000 years. But pinning down an exact date – at least for now – will be difficult.

Since 2014, Swarm—a trio of satellites from the European Space Agency—has allowed researchers to study changes building at the Earth’s core, where the magnetic field is generated.

Historically, Earth’s North and South magnetic poles have flipped every 200,000 or 300,000 years—except right now, they haven’t flipped successfully for about 780,000 years. But the planet’s magnetic field is at long last showing signs of shifting.

The Earth’s magnetic field is generated within the liquid core of our planet, by the slow churning of molten iron. Like the atmosphere and oceans, the way in which it moves is governed by the laws of physics. We should therefore be able to predict the “weather of the core” by tracking this movement, just like we can predict real weather by looking at the atmosphere and ocean. A reversal can then be likened to a particular type of storm in the core, where the dynamics – and magnetic field – go haywire (at least for a short while), before settling down again.

The difficulties of predicting the weather beyond a few days are widely known, despite us living within and directly observing the atmosphere. Yet predicting the Earth’s core is a far more difficult prospect, principally because it is buried beneath 3,000km of rock such that our observations are scant and indirect. However, we are not completely blind: we know the major composition of the material inside the core and that it is liquid. A global network of ground-based observatories and orbiting satellites also measure how the magnetic field is changing, which gives us insight into how the liquid core is moving.

Solar Pole Swapping Puts Earth to Shame

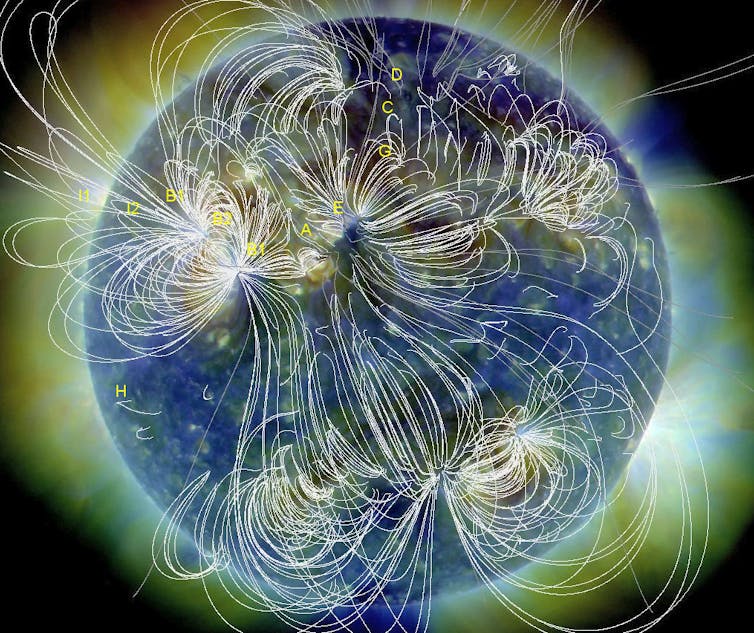
White lines show the magnetic field emanating from the sun’s surface. NASA

Background:

The sun as a whole also has a “global” magnetic field, oriented more or less north-south. So we can think of the sun as a large N-S magnet, like our Earth, but with smaller variously (but not randomly) oriented and continually evolving mini-magnets distributed over its photosphere (visible surface) and throughout its corona (extended atmosphere).

However, unlike our Earth, the sun’s large scale magnetic field flips over on a regular basis, roughly every 11 years. (Actually, Earth’s flips too, very irregularly. The last time was 780,000 years ago. But that’s another story.) Solar magnetic reversals occur close to solar maximum, when the number of sunspots is near its peak, though it is often a gradual process, taking up to 18 months.

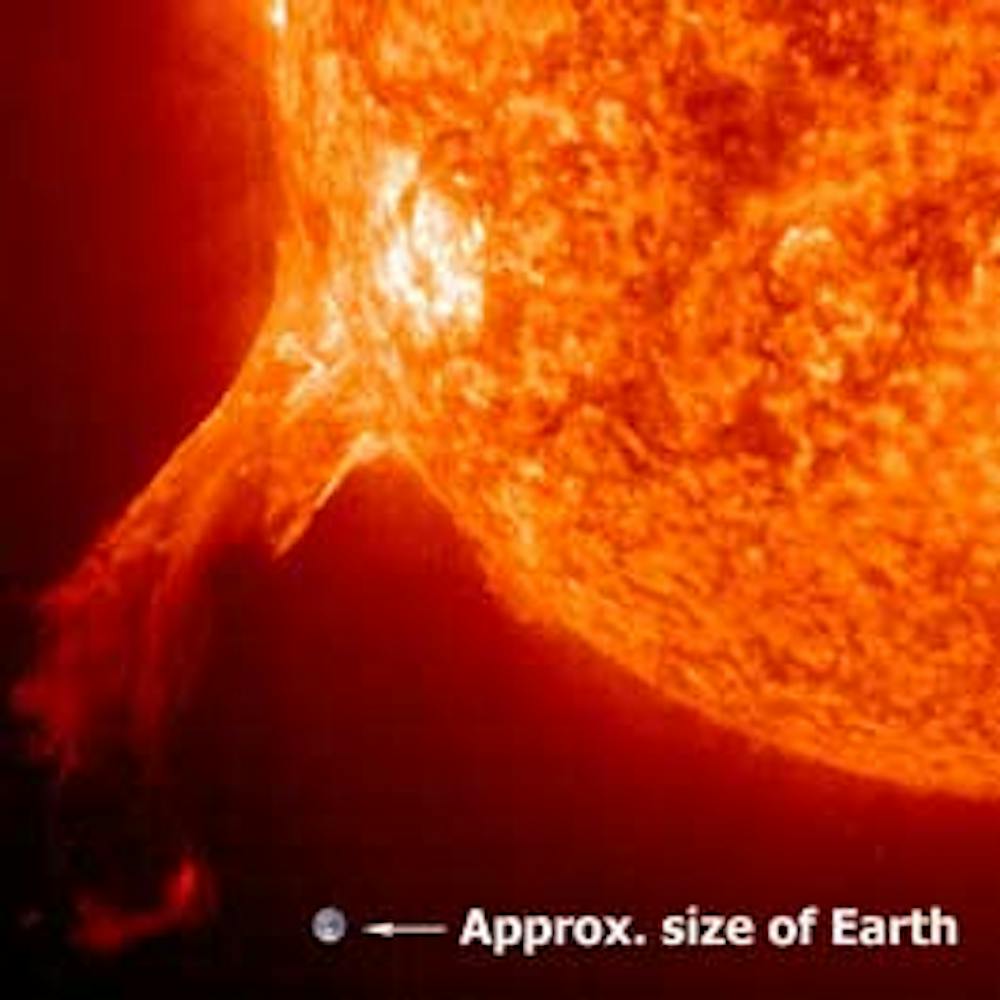
A solar flare (the white patch on the sun), and an erupting prominence reaching into space, are features of our active sun, and place the size of Earth in context. NASA

Paul Cally solar physicist Monash U (here)

About the Current Quiet Sun

Euan Mearns considers the implications at Energy Matters The Death of Sunspot Cycle 24, Huge Snow and Record Cold  Excerpts below with my bolds.

8 meter snow depth in Chamonix in the shadow of Mont Blanc in the French Alps January 2018

It looks like the snow in this drift is ~ 8m deep. And this is in the valley, not in the high basins where the snow fields that feed the glaciers lie. Now it’s obviously far too early to begin to draw any conclusions. But IF we get a run of 3 or 4 winters that dump this much snow, it is not inconceivable for me to imagine Alpine glaciers once again beginning to advance. I’m totally unsure how long it takes for pressure in the glacier source to feed through to advance of the snout.

So what is going on? We’ve been told by climate scientists that snow would become a thing of the past. We’ve also been told that global warming might lead to more snow and less snow. And we’ve been told that warming might even lead to cooling. The competing theory to the CO2 greenhouse is that the Sun has a prominent role in modulating Earth’s climate that was so eloquently described by Phil Chapman in his post earlier this week. This theory simply observes a strong connection between a weak solar wind (that is expressed by low sunspot numbers) and cold, snowy winters in the N hemisphere. Uniquely, most of those who argue for a strong solar influence also acknowledge the overprint of anthropogenic CO2. The IPCC effectively sets the Sun to zero. The Sun is entering a grand solar minimum already christened the Eddy Minimum by the solar physics community.

Figure 2 It is crucial to look at the baseline closely that in 2009 actually touched zero for months on end. This is not normal for the low point of the cycle. Figure 3 shows how cycle 24 was feeble compared with recent cycles. And it looks like it will have a duration of ~10 years (2009-2019) which as the low end of the normal range which is 9 to 14 years with mean of 11 years. Chart adapted from SIDC is dated 1 January 2018.

Mearns provides this summary of his article Cosmic Rays, Magnetic Fields and Climate Change

Cosmic rays are deflected by BOTH the Sun’s and Earth’s magnetic fields and there may also be variations in the incident cosmic ray background. Cosmogenic isotope variations, therefore, do not only record variations in solar activity.

This has two significant implications for me: 1) when I have looked into cosmogenic isotopes in the past I have been perplexed by the fact that in parts you see a wonderful coherence with “climate” (T≠climate) while else where, the relationship breaks down, and 2) my recent focus has been on variations in spectrum from the Sun (which may still be important) but to the extent that the Laschamp event (Earth’s magnetic field) may also be implicated in climate change then the emphasis needs to shift to cosmic rays themselves i.e. what Svensmark has been saying for years.

For readers not familiar with Earth’s magnetic field. It periodically flips but on a time-scale of millions of years. The N pole moves to the S pole and in the process of doing so the magnetic field strength collapses as evidenced by “Figure 7” in Phil’s post. The last time this happened was during the Laschamp event ~ 41,000 years ago. There was a full but short lived reversal, but the Earth’s magnetic field did collapse.

Now here’s the main point. We know that the glacial cycles beat to a 41,000 year rhythm that is the obliquity (tilt) of Earth’s axis. The magnetic field originates in Earth’s liquid mainly iron core. This raises the question, can changes in obliquity affect the geo-dynamo. You have to read what Phil has written closely:

Since we absolutely know (don’t we?) that the interglacial to glacial transitions of the current ice age are caused by Milankovitch forcing, the usual interpretation is that there must be some unknown mechanism by which changes in the orbit of the Earth and/or the tilt of the polar axis affect the geodynamo, triggering the excursions.

For decades to centuries, Earth’s N magnetic pole was pretty well fixed to a point in northern Canada. Not much in the news, but it has recently begun to migrate, quite rapidly.

For a more complete description of solar effects effects on earth’s climate see
The cosmoclimatology theory


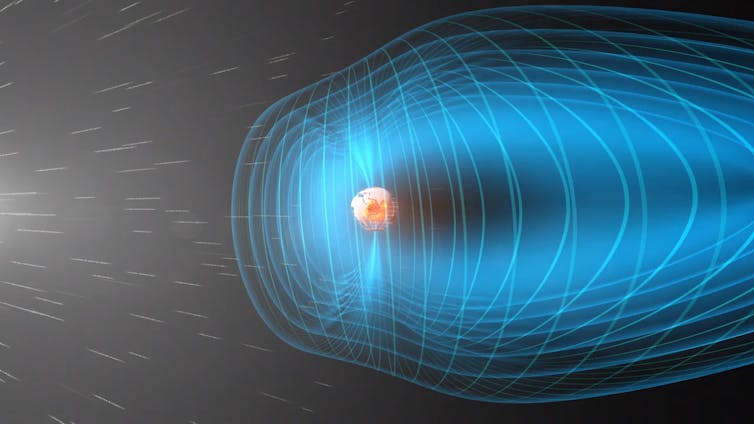
Earth’s magnetic field, in blue, shields the planet from the solar wind. NASA

Arctic Wonder

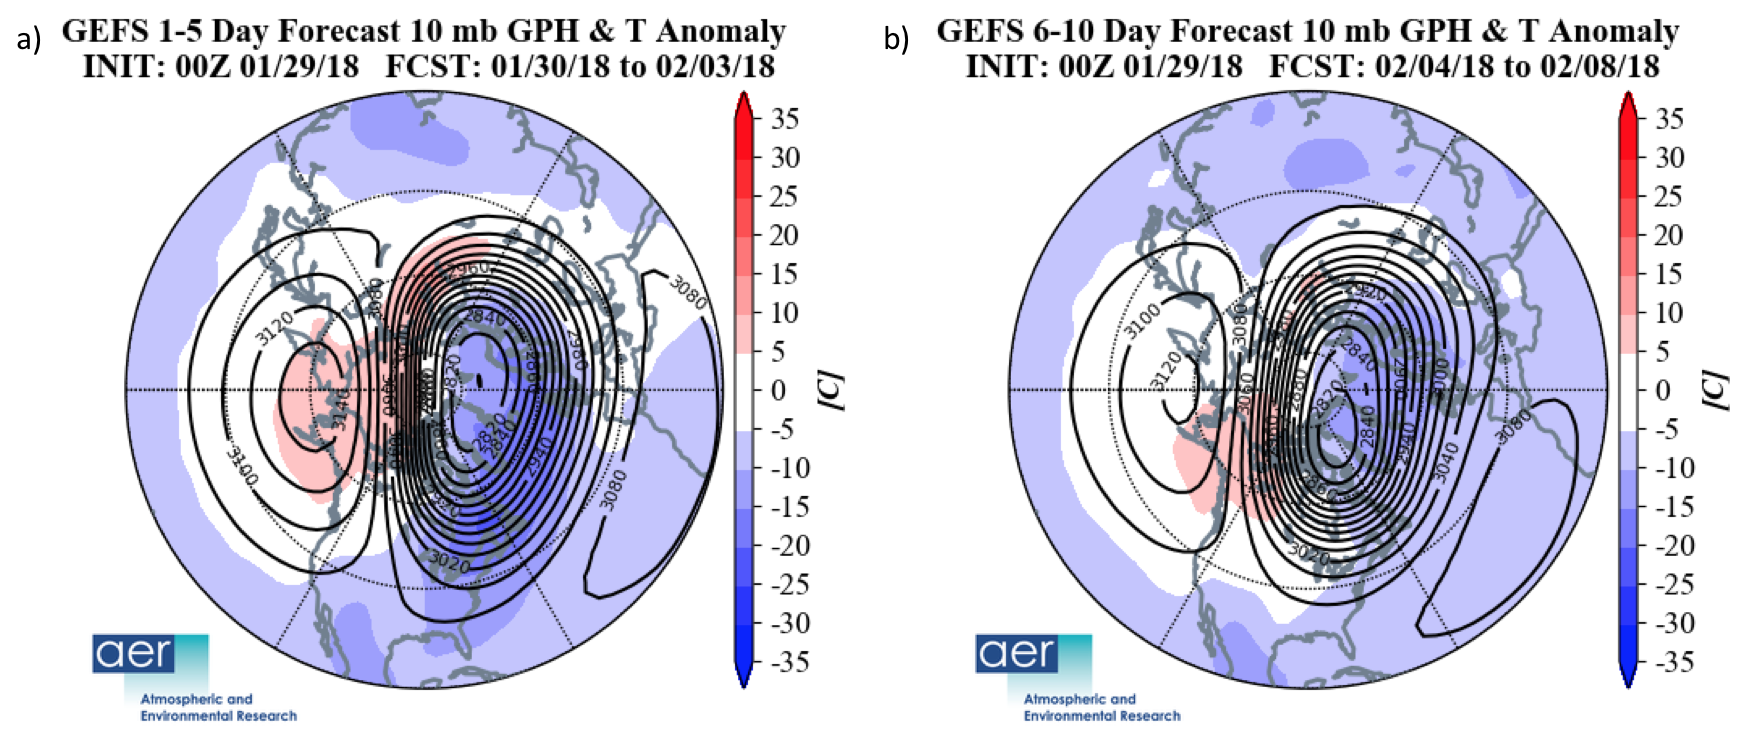
I am excerpting from Dr. Cohen’s latest post because of his refreshing candor sharing his thought processes regarding arctic weather patterns. Arctic Oscillation and Polar Vortex Analysis and Forecasts  January 29, 2018 Dr. Judah Cohen.  (my bolds and images added)

I have really struggled with what to discuss in today’s Impacts section and in the end decided to focus on a feature that gets no respect and to elaborate on last week’s discussion. One big problem has been large model uncertainty and lack of reliable guidance. I think it should be obvious to anyone reading the blog that I am focused on the behavior of the stratospheric polar vortex (SPV) and using variability in that behavior to anticipate large scale climate anomalies across the Northern Hemisphere (NH) on the timescale of days to weeks and even months.

The weather models (I spend most of my time analyzing the global forecast system (GFS) but I do not think that it is limited to the GFS) have been predicting some wild and highly anomalous behavior in the SPV. First the GFS was predicting a SPV displacement into North America (why this is highly anomalous is a good question and not something that I fully understand). Then the GFS predicted a strong warming in the polar stratosphere centered over Scandinavia of the magnitude that is only observed over East Asia and Alaska. The GFS has mostly backed off of these forecasts or at least predicting events of much smaller magnitudes (though it is back in the 12z run).

And looking back at the behavior of the SPV for the winter it can be summed up as unremarkable in many ways. My sense is that the SPV has been stronger than normal for the winter characterized a mostly positive stratospheric AO and cold/below normal PCHS in the stratosphere. Based on that alone one would expect an overwhelmingly mild winter across the NH mid-latitudes. However that would not be an accurate description of the winter.

But in the atmosphere you cannot have low pressure without high pressure. And as we head into the final third or half of winter, I don’t think that one can understand or explain this winter’s temperature variability without focusing on anomalous high pressure in the polar stratosphere. So in the end I have decided to discuss what I like to call the “Rodney Dangerfield” of weather- high pressure because it doesn’t seem to get the respect it deserves certainly compared to low pressure.

My passion for weather began with my love for snow and I couldn’t wait for the next snow opportunity. I grew up in New York City (NYC) where it snows every winter but to get a good snowfall is always challenging and predicted snowfalls more often than not did not materialize because of too much dry air or too much warm air or the storm being too far out to sea…. It became apparent to me having an area of low pressure passing near NYC rarely translated to a snowstorm.

Instead a better predictor of snowfall was the position of high pressure. If Arctic high pressure settled to the north of NYC across Quebec or even Northern New England the likelihood of snowfall greatly increased despite model predicted storm tracks. With high pressure entrenched to the north, good things (as far as snow falling in NYC) happened. So even though meteorologists like to focus on storms and low pressure, in my opinion the key player in whether it would snow or not was the high pressure.

This recognition of the importance of high pressure that began with my passion for weather followed me to my studies. On the regional scale of snowfall in NYC it was the storms that got all the attention and high pressure was neglected (at least that was my impression). Similarly when I began studying winter climate variability on a large scale again my impression was that the focus was on the two semi-permanent large scale low pressures the Icelandic and the Aleutian lows.

There was a third semi-permanent feature that seemed to get scant attention – the Siberian high. When my own research demonstrated a relationship between Eurasian snow cover and winter climate including in the Eastern US to me the obvious link or pathway was the Siberian high. It took many years and many studies to come to the understanding I have today (which remains incomplete) but it is my opinion that the Siberian high is the single most important large scale synoptic feature that influences the variability of the SPV (other climate scientists may disagree with me).

My own empirical observations are that when the Siberian high is shifted to the northwest over the Urals and Scandinavia region, this will inevitably produce increased energy transfer from the troposphere to the stratosphere and more often than not disrupt the SPV. The likelihood of a disruption will increase if the Ural blocking is coupled with downstream troughing across East Asia and the North Pacific or a deeper than normal Aleutian low.

Through the blog I advocate for the importance of SPV variability on sensible weather and whether the SPV is “still” or “disrupted” can have important and large implications for surface weather. As I discussed last week, from the blog it has become obvious to me thinking of the SPV as weak and strong only, or even compositing based on the absence or existence of zonal wind reversals at 60°N and 10 hPa was overly simplistic and probably missed most of the coupling with the troposphere. Instead the position of the SPV and the flow around the SPV were important regardless of the speed of the zonal winds at 60°N and 10 hPa.

But this winter makes me believe that it might even be more nuanced than even the wind flow around the SPV. The precursor to the historic cold in the Eastern US in late December and early January was a Canadian warming/high pressure in the polar stratosphere the third week of December. But as it turns out the most impressive cold anomalies during the month of January are not in North America but Asia. A second warming/high pressure near Eastern Siberia in mid-January accompanied near record cold in Siberia and large parts of Asia.

Figure 12. (a) Forecasted 10 mb geopotential heights (dam; contours) and temperature anomalies (°C; shading) across the Northern Hemisphere for 30 January – 3 February 2018. (b) Same as (a) except averaged from 4 – 8 February 2018. The forecasts are from the 29 January 2018 00z GFS ensemble.

Now a third warming/high pressure predicted back in the western hemisphere across Alaska and Northwest Canada is again a precursor for a return of cold temperatures to the Eastern US and Eastern Canada starting this week (see Figure 12). The location of high pressure/heating in the polar stratosphere is the best explanation that I have for the placement and timing of the dominant cold anomalies across the NH. I have a hard time making the same explanation based on the location of the SPV or the flow around the SPV.

Of course my reasoning is overly simplistic and the resultant weather anomalies are not limited to one factor or influence but rather a combination of many different influences or forcings. As I discussed in last week’s blog an alternative explanation being offered for the return of cold weather to eastern North America is the Madden Julian Oscillation (MJO). 

Originally the models and meteorologists relying on MJO forcing predicted a mild first half of February and a colder second half of February. That forecast has changed mostly to a cold February from start to finish. I don’t think that change in the forecast can be ignored or glossed over with the change in timing as an inconsequential detail. The forecast for this week across the US is western ridge and warm with eastern trough and cold, though admittedly the cold is not overly impressive.

Based purely on the MJO the next two weeks should feature a cold Western US and a warm Eastern US opposite of the most recent forecasts. If it is cold in the Eastern US over the next two weeks it is not because of the MJO but in spite of the MJO. Currently the models are not quite sure if the MJO will make it to phase 8 but that phase is related to a warm Western US and cold Eastern US. If the cold persists until the third week of February then the MJO forcing could constructively interfere with the already cold pattern.

If the early arrival of the cold cannot be attributed to MJO forcing then what could be the reason? My explanation is something that I have discussed many times before – the models fail to correctly “propagate down” circulation anomalies from the stratosphere to the troposphere until the changes can’t be ignored. At longer leads the models did not correctly predict the return of Alaska ridging related to SPV variability but corrected at shorter leads.

Thanks Dr. Cohen for illuminating the art and science of studying the weather in its fascinating complexity.  More on his forecasting paradigm at Warm is Cold, and Down is Up

How Much Energy Do We Need?


Masai warrior with cell phone.

A previous post Adapting Plants to Feed the World explored how much food will be needed for a future population if 3 billion additional middle-class appetites are added? This post discusses the issues regarding the obvious link between energy and poverty. Someone said, observing world life styles: “Where energy is scarce and expensive, people’s labor is cheap and they live in poverty. Where energy is cheap and reliable, people are well paid for their labor and have a higher standard of living.”

So the question of how much energy is important, particularly with the present huge disparity in energy access. Here are excerpts with my bolds from an article by Kris De Decker in Low-Tech Magazine How Much Energy Do We Need?

I appreciate the presentation of the issues, while disagreeing with some of the premises. For example, he assumes that societies using fossil fuels despoil their environments, when the facts contradict that notion. Not only are people more prosperous and live longer by using fossil fuels, they also enjoy cleaner air and sanitary drinking water. The author mistakenly conflates belief in global warming/climate change with environmental stewardship.

The article provides this graph illustrating the situation of energy disparity:
De Decker:  If we divide total primary energy use per country by population, we see that the average North American uses more than twice the energy of the average European (6,881 kgoe versus 3,207 kgoe, meaning kg of oil equivalent). Within Europe, the average Norwegian (5,818 kgoe) uses almost three times more energy than the average Greek (2,182 kgoe). The latter uses three to five times more energy than the average Angolan (545 kgoe), Cambodian (417 kgoe) or Nicaraguan (609 kgoe), who uses two to three times the energy of the average Bangladeshi (222 kgoe). [

These figures include not only the energy used directly in households, but also energy used in transportation, manufacturing, power production and other sectors. Such a calculation makes more sense than looking at household energy consumption alone, because people consume much more energy outside their homes, for example through the products that they buy.

Inequality not only concerns the quantity of energy, but also its quality. People in industrialised countries have access to a reliable, clean and (seemingly) endless supply of electricity and gas. On the other hand, two in every five people worldwide (3 billion people) rely on wood, charcoal or animal waste to cook their food, and 1.5 billion of them don’t have electric lighting. [6] These fuels cause indoor air pollution, and can be time- and labour-intensive to obtain. If modern fuels are available in these countries, they’re often expensive and/or less reliable.

As a Canadian I am not surprised that Norwegians use more energy than Greeks, considering winters in the two places. But I agree that standards of living are much higher on the left side compared to the right side, and energy access is a large part of the reason, though not the only one (governance?, free enterprise? rule of law?, work ethic? Etc.)

Aside: Henry Kissinger once observed: “If a country is not already a democracy when they discover oil, they stand little chance of becoming one.”

I don’t share the author’s fear of climate change which does permeate his discussion of the issues in raising up impoverished populations.

De Dekker goes on: However, while it’s recognised that part of the global population is using not enough energy, there is not the same discussion of people who are using too much energy. Nevertheless, solving the tension between demand reduction and energy poverty can only happen if those who use ‘too much’ reduce their energy use. Bringing the rest of the world up to the living standards and energy use of rich countries – the implicit aim of ‘human development’ – would solve the problem of inequality, but it’s not compatible with the environmental problems we face.

Between the upper boundary set by the carrying capacity of the planet, and a lower boundary set by decent levels of wellbeing for all lies a band of sustainable energy use, situated somewhere between energy poverty and energy decadence. [14] These boundaries not only imply that the rich lower their energy use, but also that the poor don’t increase their energy use too much. However, there is no guarantee that the maximum levels are in fact higher than the minimum levels.

To make matters worse, defining minimum and maximum levels is fraught with difficulty. On the one hand, when calculating from the top down, there’s no agreement about the carrying capacity of the planet, whether it concerns a safe concentration of carbon in the atmosphere, the remaining fossil fuel reserves, the measurements of ecological damage, or the impact of renewable energy, advances in energy efficiency, and population growth. On the other hand, for those taking a bottom-up approach, defining what constitutes a ‘decent’ life is just as debatable.

Needs and Wants

However, although distributing energy use equally across the global population may sound fair, in fact the opposite is true. The amount of energy that people ‘need’ is not only up to them. It also depends on the climate (people living in cold climates will require more energy for heating than those living in warm climates), the culture (the use of air conditioning in the US versus the siesta in Southern Europe), and the infrastructure (cities that lack public transport and cycling facilities force people into cars).

Differences in energy efficiency can also have a significant impact on the “need” for energy. For example, a traditional three-stone cooking fire is less energy efficient than a modern gas cooking stove, meaning that the use of the latter requires less energy to cook a similar meal. It’s not only the appliances that determine how much energy is needed, but also the infrastructure: if electricity production and transmission have relatively poor efficiency, people need more primary energy, even if they use the same amount of electricity at home.

To account for all these differences, most researchers approach the diagnosis of energy poverty by focusing on ‘energy services’, not on a particular level of energy use. [17] People do not demand energy or fuel per se – what they need are the services that energy provides. For example, when it comes to lighting, people do not need a particular amount of energy but an adequate level of light depending on what they are doing.

Some energy poverty indicators go one step further still. They don’t specify energy services, but basic human needs or capabilities (depending on the theory). In these modes, basic needs or capabilities are considered to be universal, but the means to achieve them are considered geographically and culturally specific. The focus of these needs-based indicators is on measuring the conditions of human well-being, rather than on specifying the requirements for achieving these outcomes. Examples of human basic needs are clean water and nutrition, shelter, thermal comfort, a non-threatening environment, significant relationships, education and healthcare.

Basic needs are considered to be universal, objective, non-substitutable (for example, insufficient food intake cannot be solved by increasing dwelling space, or the other way around), cross-generational (the basic needs of future generations of humans will be the same as those of present generations), and satiable (the contribution of water, calories, or dwelling space to basic needs can be satiated). This means that thresholds can be conceived where serious harm is avoided. ‘Needs’ can be distinguished from ‘wants’, which are subjective, evolving over time, individual, substitutable and insatiable. Focusing on basic needs in this way makes it possible to distinguish between ‘necessities’ and ‘luxuries’, and to argue that human needs, present and future, trump present and future ‘wants’.

Politically Correct Off-grid Electricity.

Focusing on energy services or basic needs can help to specify maximum levels of energy use. Instead of defining minimum energy service levels (such as 300 lumens of light per household), we could define maximum energy services levels (say 2,000 lumens of light per household). These energy service levels could then be combined to calculate maximum energy use levels per capita or household. However, these would be valid only in specific geographical and cultural contexts, such as countries, cities, or neighbourhoods – and not universally applicable. Likewise, we could define basic needs and then calculate the energy that is required to meet them in a specific context.

However, the focus on energy services or basic needs also reveals a fundamental problem. If the goods and services necessary for a decent life free from poverty are seen not as universally applicable, but as relative to the prevailing standards and customs of a particular society, it becomes clear that such standards evolve over time as technology and customary ways of life change. [11] Change over time, especially since the twentieth century, reveals an escalation in conventions and standards that result in increasing energy consumption. The ‘need satisfiers’ have become more and more energy-intensive, which has made meeting basic needs as problematic as fulfilling ‘wants’.

Summary

The author goes on to discuss energy demand reductions from efficiencies and substitutions, but cannot get around his fundamental dilemma: Needs are universal, objective, non-substitutable, cross-generational, and satiable. Wants are subjective, evolving over time, individual, substitutable and insatiable.

Some of the text reminded me of soviet era Romania. At Ceaușescu’s initiative in 1981, a “Rational Eating Programme” began, being a “scientific plan” for limiting the calorie intake for the Romanians, claiming that the Romanians were eating too much. It tried to reduce the calorie intake by 9-15 percent to 2,800-3,000 calories per day. In December 1983, a new dietary programme for 1984 set even lower allowances. That “austerity program” destroyed the economy, bringing down the ruler and regime.

In Biblical days they were wiser: “Do not muzzle an ox when he is treading out the grain.” Deuteronomy 25:4

People and their societies are dynamic, not static, as Matthew Kahn keeps reminding us. When their labor is enhanced with energy from fossil fuels, people are healthier, more productive and inventive in seeking, finding and using natural resources. Club of Rome’s notion of limits to growth failed to understand human resources, and today’s followers are equally blind.

What is Global Temperature? Is it warming or cooling?

H/T graeme for asking a good question.

This blog features a monthly update on ocean SST averages from HadSST3 (latest is Oceans Cool Off Previous 3 Years). Graeme added this comment:
I came across this today. Can you comment as your studies seem to show the reverse! Regards, Graeme Weber
https://www.carbonbrief.org/category/science/temperature/global-temperature

While thinking about a concise, yet complete response, I put together this post. This is how I see it, to the best of my knowledge.

The question could be paraphrased in these words: Why are there differences between various graphs that report changes in global temperatures?

The short answer is: The differences arise both from what is measured and how the measurements are processed.

For example, consider HadSST3 as one example and GISTEMP as another. All climate temperature products divide the earth surface into grid cells for analysis. This is necessary because a global average can be biased by some regions being much more heavily sampled, eg. North America or North Atlantic. HadSST takes in measurements only from cells containing ocean, while GISTEMP uses data files from NOAA GHCN v3 (meteorological stations), ERSST v5 (ocean areas), and SCAR (Antarctic stations).

Beyond this, HadSST3 is properly termed a temperature data product, while GISTEMP is a temperature reconstruction product. The distinction goes to how the product team deals with missing data. HadSST3 calculates averages each month from grid cells with sufficient samples of observations, and excludes cells with inadequate samples for the month.

GISTEMP estimates temperature values for cells lacking data by referring to cells that are observed sufficiently. The estimates are a best guess as to what temperatures would have been recorded had there been fully functional sensors operating. This process is called interpolation, resulting in a product combining observations with estimates, ie an admixture of data and guesses.

I rely on HadSST3 because I know their results are based upon observational data. I am doubtful of GISTEMP results because many studies, including some of my own, show that interpolation produces strange and unconvincing results which come to light when you look at changes in the local records themselves.

One disturbing thing is that GISTEMP keeps on changing the past, and always in the direction of adding warming.  What you see today differs from yesterday, and tomorrow who knows?

Roger Andrews does a thorough job analyzing the effects of adjustments upon Surface Air Temperature (SAT) datasets. His article at Energy Matters is Adjusting Measurements to Match the Models – Part 1: Surface Air Temperatures.

Another thing is that temperature patterns are altered so that places that show cooling trends on their own are converted to warming after processing.

Figure 3: Warming vs. cooling at 86 South American stations before and after BEST homogeneity adjustments  This shows results from BEST, another reconstruction product demonstrating how an entire continent is presented differently by means of processing.

Then there is the problem that more and more places are showing estimates rather than observations. Years ago, Dr. McKitrick noticed that the decreasing number of stations reporting coincided with the rising GMT reports last century.   Below is his graph showing the correlation between Global Mean Temperature (Average T) and the number of stations included in the global database. Source: Ross McKitrick, U of Guelph

Ave. T vs. No. Stations

Currently it is clear that a great many places are estimated, and it is even the case that active station records are ignored in favor of estimates.

For these reasons I am skeptical of these land+ocean temperature reconstructions. HadSST3 deals with the ocean in a reasonable way, without inventing data.

When it comes to land surface stations, it is much more reasonable to compute the change derivative for each station (i.e. slope) and average the slopes as an indication of regional, national or global temperature change. This form of Temperature Trend Analysis deals with missing data in the most direct way: by putting unobserved months at a specific station on the trendline of the months that are observed at that station–no infilling, no homogenization.

Several of my studies using this approach are on this blog under the category Temperature Trend Analysis. A guideline to these resources is at Climate Compilation Part I Temperatures

The method of analysis is demonstrated by a post as Temperature Data Review Project-My Submission.which also confirms the problems noted above.

A peer-reviewed example of this way of analyzing climate temperature change is the paper Arctic temperature trends from the early nineteenth century to the present W. A. van Wijngaarden, Theoretical & Applied Climatology (2015) here

Is the globe warming or cooling?

Despite the difficulties depicting temperature changes noted above, we do observe periods of warming and cooling at different times and places.  Interpreting those fluctuations is a matter of context.  For example, consider GISTEMP estimated global warming in the context of the American experience of temperature change during a typical year.


Coercive PC Discourse Redux

Update January 27, 2018 This post somehow disappeared so I am reposting it. H/T hunter

A previous post described Civil Discourse (here) tactics regarding controversial subjects like global warming/climate change. Another post (here) noted that contemporary leftists advocate through social rather than political persuasion, and have taken over most of the cultural institutions in pursuing their agenda.

A recent BBC interview with Jordan Peterson demonstrates exactly how an opinionated media bully engages in coercive rather than civil discourse. The analysis is provided by Conor Friedersdorf in the Atlantic Why Can’t People Hear What Jordan Peterson Is Saying?  A British broadcaster doggedly tried to put words into the academic’s mouth.

The whole article is revealing and worth reading. Here I provide a few of many examples of attempted social coercion posing as an interview. Excerpts below with my bolds.

My first introduction to Jordan B. Peterson, a University of Toronto clinical psychologist, came by way of an interview that began trending on social media last week. Peterson was pressed by the British journalist Cathy Newman to explain several of his controversial views. But what struck me, far more than any position he took, was the method his interviewer employed. It was the most prominent, striking example I’ve seen yet of an unfortunate trend in modern communication.

First, a person says something. Then, another person restates what they purportedly said so as to make it seem as if their view is as offensive, hostile, or absurd.

Twitter, Facebook, Tumblr, and various Fox News hosts all feature and reward this rhetorical technique. And the Peterson interview has so many moments of this kind that each successive example calls attention to itself until the attentive viewer can’t help but wonder what drives the interviewer to keep inflating the nature of Peterson’s claims, instead of addressing what he actually said.

This isn’t meant as a global condemnation of this interviewer’s quality or past work. As with her subject, I haven’t seen enough of it to render any overall judgment—and it is sometimes useful to respond to an evasive subject with an unusually blunt restatement of their views to draw them out or to force them to clarify their ideas.

Perhaps she has used that tactic to good effect elsewhere. (And the online attacks to which she’s been subjected are abhorrent assaults on decency by people who are perpetrating misbehavior orders of magnitude worse than hers.)

But in the interview, Newman relies on this technique to a remarkable extent, making it a useful illustration of a much broader pernicious trend. Peterson was not evasive or unwilling to be clear about his meaning. And Newman’s exaggerated restatements of his views mostly led viewers astray, not closer to the truth.

Peterson begins the interview by explaining why he tells young men to grow up and take responsibility for getting their lives together and becoming good partners. He notes he isn’t talking exclusively to men, and that he has lots of female fans.

“What’s in it for the women, though?” Newman asks.

“Well, what sort of partner do you want?” Peterson says. “Do you want an overgrown child? Or do you want someone to contend with who is going to help you?”

“So you’re saying,” Newman retorts, “that women have some sort of duty to help fix the crisis of masculinity.” But that’s not what he said. He posited a vested interest, not a duty.

“Women deeply want men who are competent and powerful,” Peterson goes on to assert. “And I don’t mean power in that they can exert tyrannical control over others. That’s not power. That’s just corruption. Power is competence. And why in the world would you not want a competent partner? Well, I know why, actually, you can’t dominate a competent partner. So if you want domination—”

The interviewer interrupts, “So you’re saying women want to dominate, is that what you’re saying?”

After transcriptions covering pay gaps and gender equality, we come to this:

In this next passage Peterson shows more explicit frustration than at any other time in the program with being interviewed by someone who refuses to relay his actual beliefs:

Newman: So you don’t believe in equal pay.

Peterson: No, I’m not saying that at all.

Newman: Because a lot of people listening to you will say, are we going back to the dark ages?

Peterson: That’s because you’re not listening, you’re just projecting.

Newman: I’m listening very carefully, and I’m hearing you basically saying that women need to just accept that they’re never going to make it on equal terms—equal outcomes is how you defined it.

Peterson: No, I didn’t say that.

Newman: If I was a young woman watching that, I would go, well, I might as well go play with my Cindy dolls and give up trying to go school, because I’m not going to get the top job I want, because there’s someone sitting there saying, it’s not possible, it’s going to make you miserable.

Peterson: I said that equal outcomes aren’t desirable. That’s what I said. It’s a bad social goal. I didn’t say that women shouldn’t be striving for the top, or anything like that. Because I don’t believe that for a second.

Newman: Striving for the top, but you’re going to put all those hurdles in their way, as have been in their way for centuries. And that’s fine, you’re saying. That’s fine. The patriarchal system is just fine.

Peterson: No! I really think that’s silly! I do, I think that’s silly.

He thinks it is silly because he never said that “the patriarchal system is just fine” or that he planned to put lots of hurdles in the way of women, or that women shouldn’t strive for the top, or that they might as well drop out of school, because achieving their goals or happiness is simply not going to be possible.

The interviewer put all those words in his mouth.

The conversation moves on to other topics, but the pattern continues. Peterson makes a statement. And then the interviewer interjects, “So you’re saying …” and fills in the rest with something that is less defensible, or less carefully qualified, or more extreme, or just totally unrelated to his point. I think my favorite example comes when they begin to talk about lobsters. Here’s the excerpt:

Peterson: There’s this idea that hierarchical structures are a sociological construct of the Western patriarchy. And that is so untrue that it’s almost unbelievable. I use the lobster as an example: We diverged from lobsters evolutionarily history about 350 million years ago. And lobsters exist in hierarchies. They have a nervous system attuned to the hierarchy. And that nervous system runs on serotonin just like ours. The nervous system of the lobster and the human being is so similar that anti-depressants work on lobsters. And it’s part of my attempt to demonstrate that the idea of hierarchy has absolutely nothing to do with sociocultural construction, which it doesn’t.

Newman: Let me get this straight. You’re saying that we should organize our societies along the lines of the lobsters?

Yes, he proposes that we all live on the sea floor, save some, who shall go to the seafood tanks at restaurants. It’s laughable. But Peterson tries to keep plodding along.

Peterson: I’m saying it is inevitable that there will be continuities in the way that animals and human beings organize their structures. It’s absolutely inevitable, and there is one-third of a billion years of evolutionary history behind that … It’s a long time. You have a mechanism in your brain that runs on serotonin that’s similar to the lobster mechanism that tracks your status—and the higher your status, the better your emotions are regulated. So as your serotonin levels increase you feel more positive emotion and less negative emotion.

Newman: So you’re saying like the lobsters, we’re hard-wired as men and women to do certain things, to sort of run along tram lines, and there’s nothing we can do about it.

Where did she get that extreme “and there’s nothing we can do about it”? Peterson has already said that he’s a clinical psychologist who coaches people to change how they related to institutions and to one another within the constraints of human biology. Of course he believes that there is something that can be done about it.

He brought up the lobsters only in an attempt to argue that “one thing we can’t do is say that hierarchical organization is a consequence of the capitalist patriarchy.”

Actually, one of the most important things this interview illustrates—one reason it is worth noting at length—is how Newman repeatedly poses as if she is holding a controversialist accountable, when in fact, for the duration of the interview, it is she that is “stirring things up” and “whipping people into a state of anger.”

At every turn, she is the one who takes her subject’s words and makes them seem more extreme, or more hostile to women, or more shocking in their implications than Peterson’s remarks themselves support. Almost all of the most inflammatory views that were aired in the interview are ascribed by Newman to Peterson, who then disputes that she has accurately characterized his words.

Update:  A Post interview conversation with Peterson illuminates the dynamics and shows how in the aftermath social justice warriors morph into victims and martyrs.

Summary

Lots of culture-war fights are unavoidable––that is, they are rooted in earnest, strongly felt disagreements over the best values or way forward or method of prioritizing goods. The best we can do is have those fights, with rules against eye-gouging.

But there is a way to reduce needless division over the countless disagreements that are inevitable in a pluralistic democracy: get better at accurately characterizing the views of folks with differing opinions, rather than egging them on to offer more extreme statements in interviews; or even worse, distorting their words so that existing divisions seem more intractable or impossible to tolerate than they are. That sort of exaggeration or hyperbolic misrepresentation is epidemic—and addressing it for everyone’s sake is long overdue.

Oceans Make Climate: SST, SSS and Precipitation Linked

gulf_stream

Satellite image of sea surface temperature in the Gulf Stream.

Climates are locally defined according to their weather patterns combining temperature and precipitation. Those two variables determine the flora and fauna to survive and flourish in any locale. A number of posts here support the theme that Oceans Govern Climate, and this is another one, summarizing the findings from a new paper published in Nature Communications Pronounced centennial-scale Atlantic Ocean climate variability correlated with Western Hemisphere hydroclimate by Thirumalai et al. 2018. Below is an overview from Science Daily followed by excerpts from the paper with my bolds. (Note:  SST refers to sea surface temperatures, SSS refers to sea surface salinity, and GOM means Gulf of Mexico.)

Science Daily Rainfall and ocean circulation linked in past and present

Research conducted at The University of Texas at Austin has found that changes in ocean currents in the Atlantic Ocean influence rainfall in the Western Hemisphere, and that these two systems have been linked for thousands of years.

The findings, published on Jan. 26 in Nature Communications, are important because the detailed look into Earth’s past climate and the factors that influenced it could help scientists understand how these same factors may influence our climate today and in the future.

“The mechanisms that seem to be driving this correlation [in the past] are the same that are at play in modern data as well,” said lead author Kaustubh Thirumalai, postdoctoral researcher at Brown University who conducted the research while earning his Ph.D. at the UT Austin Jackson School of Geosciences. “The Atlantic Ocean surface circulation, and however that changes, has implications for how the rainfall changes on continents.”

loop_current

Open image in new tab if animation is not working.

Thirumalai et al. 2018 Abstract:

Surface-ocean circulation in the northern Atlantic Ocean influences Northern Hemisphere climate. Century-scale circulation variability in the Atlantic Ocean, however, is poorly constrained due to insufficiently-resolved paleoceanographic records.

Here we present a replicated reconstruction of sea-surface temperature and salinity from a site sensitive to North Atlantic circulation in the Gulf of Mexico which reveals pronounced centennial-scale variability over the late Holocene. We find significant correlations on these timescales between salinity changes in the Atlantic, a diagnostic parameter of circulation, and widespread precipitation anomalies using three approaches: multiproxy synthesis, observational datasets, and a transient simulation.

Our results demonstrate links between centennial changes in northern Atlantic surface-circulation and hydroclimate changes in the adjacent continents over the late Holocene. Notably, our findings reveal that weakened surface-circulation in the Atlantic Ocean was concomitant with well-documented rainfall anomalies in the Western Hemisphere during the Little Ice Age.

Here we address this shortfall and reconstruct SST and SSS variability over the last 4,400 years using foraminiferal geochemistry in marine sediments cored from the Garrison Basin (26°40.19′N,93°55.22′W, (purple circle in diagrams above), northern GOM. We make inferences about past changes in Loop Current strength by identifying time periods in our reconstruction where synchronous decreases in SST and SSS are interpreted as periods with a weaker Loop Current due to reduced eddy penetration over that period and vice versa. Thus, we assess the spatial heterogeneity of the putative reduction of Atlantic surface-ocean circulation and furthermore, with multiproxy synthesis, correlation analysis, and model-data comparison, we document linkages between changes in Atlantic surface-circulation and Western Hemisphere hydroclimate anomalies. Our findings reveal that regardless of whether changes in the AMOC and deepwater formation occurred or not, weakened surface-circulation prevailed in the northern Atlantic basin during the Little Ice Age and was concomitant with widespread and well-documented precipitation anomalies over the adjacent continents.

Figure 2. Garrison Basin multicore reconstructions and corresponding stacked records. Individual core Mg/Ca (mmol/mol) and δ18Oc data (‰, VPDB), and δ18Osw (‰, VSMOW) and SST (°C) reconstructions (blue–MCA, red- MCB, yellow–MCC) plotted with median and 68% uncertainty envelope incorporating age, analytical, calibration, and sampling errors (a-d) along with corresponding median stacked records with 68% and 95% confidence bounds (e-h). Diamonds in a and e indicate stratigraphic points sampled for radiocarbon. Gray histogram in g is the probability distribution for a changepoint in the δ18Osw time series. Orange circle in g is the mean of available δ18Osw measurements in the GOM and orange line in h is observed monthly mean SST with uncertainty envelope calculated using a Monte Carlo procedure that simulates foraminiferal sampling protocol. Purple line in h is the 100-year running correlation between SST and δ18Osw with corresponding uncertainty with shaded boxes indicating correlations with r > 0.7 (p < 0.001), which is the basis for identifying time periods where Loop Current and associated processes are relevant.

Loop Current control on regional SST and SSS variability

We analyzed long-term (~multidecadal) observations in instrumental datasets to place our reconstructions into a global climatic context. The HadISST data set22 documents 0.4–0.7 °C of multidecadal SST variability in the northern GOM over the last century. On these multidecadal timescales, SSTs in the northern GOM correlate highly with SST in the Loop Current region. In particular, long-term SST variability here is impacted by the Loop Current through its eddy shedding processes which are coupled to the strength of transport from the Yucatan Straits through the Florida Straits: if Loop Current transport is anomalously low, then northern GOM SSTs are anomalously cooler due to decreased eddy penetration and the opposite is the case when Loop Current transport is anomalously higher, i.e., northern GOM experiences anomalously warmer conditions. Furthermore, the Loop Current, sitting upstream of where the Gulf Stream originates, correlates highly with SST associated with regions encompassing downstream currents.

In summary, correlation analysis using SSS datasets provides a blueprint for investigating circulation variability and transport into the North Atlantic Ocean.

We also examine long-term correlations between SSS in the northern GOM and mean annual rainfall in the continents adjacent to the Atlantic Basin using rain-gauge precipitation datasets (Fig. 1). Most notably, GOM SSS is anticorrelated with southern North American rainfall (i.e., fresher GOM with wetter southern North America) and is positively correlated with rainfall in West Africa, northern South America, and the southeast United States (|r| > 0.6, p < 0.01). These inferences demonstrate a correspondence between Western Hemisphere hydroclimate and Atlantic Ocean circulation on multidecadal timescales.

Approach to understanding past circulation and hydroclimate

Taken together, we interpret past periods in the Garrison Basin reconstructions when both SST and δ18Osw variability were positively correlated (salty/warm or fresh/cool) as periods during which Loop Current strength fluctuated. We hypothesize that during these periods, increased Loop Current penetration led to increased SST as well as increased advection of more enriched δ18Osw (or more saline waters) into the northern GOM. Using the correlation analysis as a blueprint28, we can pinpoint whether these past fluctuations in the northern GOM δ18Osw record (such as during the LIA) were concomitant with changes in pan-Atlantic SSS records that would implicate circulation changes in the northern Atlantic Ocean. Finally, the long-term correlations with precipitation allow us to contextualize periods where surface-ocean circulation and continental rainfall anomalies were linked, which can then be placed within a multiproxy framework.

In comparing available reconstructions of precipitation during the LIA with our correlation map (Fig. 1), we find remarkable agreement with the proxy record: tree-ring-based PDSI reconstructions in southern North America, and stalagmites from southern Mexico43 and Peru44 capture a wetter LIA compared to modern times whereas a lake record from southern Ghana, titanium percent in Cariaco Basin sediments, and reconstructed PDSI in the southeast U. S. indicate dry LIA conditions. Additional proxy records appear to corroborate this observation as well (brown and green squares in Fig. 1; Supplementary Table 1). These mean state changes during the LIA all appear to be coeval with an anomalously fresher northern Atlantic Ocean, indicative of weakened Gulf Stream strength and reduced surface-ocean circulation.

Figure 5. Simulated correlations between sea-surface salinity and rainfall over last millennium. Correlation map between northern Gulf of Mexico SSS (dashed red box) and global oceanic SSS (red-blue scale) as well as continental precipitation (brown-green scale) from the MPI-ESM transient simulation of the last millennium along with locations of proxy records used in the study. Proxy markers are filled as in Fig. 1. Correlations were performed with 50–150 year bandpass filters to isolate centennial scale variability, where black stippling indicates significance at the 5% confidence level

The transient simulation indicates that a weaker gyre, increased sea-ice cover, and reduced interhemispheric heat transport causes the ITCZ to shift southward and produces anomalous rainfall over the Americas.

This state of weakened AMOC, observed in millennial-scale and glacial paleo-studies, with cool and fresh north Atlantic anomalies and a southward ITCZ, can induce increased rainfall over the southwest US via atmospheric teleconnections associated with the North Atlantic subtropical high overlying the gyre. Despite this southward shift, positive SSS anomalies can occur in the tropical Atlantic (and negative anomalies in the northern Atlantic) due to reduced freshwater input resulting from decreased rainfall in the Amazon and West African regions. Eventually, the tropical positive salinity anomaly in the southern Atlantic propagates northward, thereby strengthening meridional oceanic transport and providing the delayed negative feedback.

Though the length of the instrumental record limits us from directly analyzing centennial-scale correlations, there is theoretical and modeling evidence to implicate similar ocean-atmosphere processes on multidecadal and centennial timescales. Both model and observational analyses reveal a dipolar structure in Atlantic Ocean SSS that is consistent with the LIA proxies and thereby supports our hypothesis linking meridional salt transport and tropical rainfall. Both analyses also display similarities in continental precipitation patterns over western Africa, northern South America, and the southwestern United States, which are also consistent with the LIA hydroclimate proxies.

Summary

The broad agreement between the analyses supports similar ocean-atmosphere processes on multidecadal-to-centennial timescales, and provides additional evidence of a robust century-scale link between circulation changes in the Atlantic basin and precipitation in the adjacent continents.

Regardless of the specific physical mechanism concerning the onset of the LIA, and whether AMOC changes were linked with circulation changes in the surface ocean, we hypothesize that the reported oscillatory feedback on centennial-time scales involving the surface-circulation in the Atlantic Ocean and Western Hemisphere hydroclimate played an important role in last millennium climate variability and perhaps, over the late Holocene.


Adapting Plants to Feed the World

Credit: Edwin Remsberg Getty Images

Writing in the Atlantic, Charles Mann raises an important question: Can Planet Earth Feed 10 Billion People? Humanity has 30 years to find out.  Excerpts below with my images and bolds.

Context

In 1970, when I was in high school, about one out of every four people was hungry—“undernourished,” to use the term preferred today by the United Nations. Today the proportion has fallen to roughly one out of 10. In those four-plus decades, the global average life span has, astoundingly, risen by more than 11 years; most of the increase occurred in poor places. Hundreds of millions of people in Asia, Latin America, and Africa have lifted themselves from destitution into something like the middle class. This enrichment has not occurred evenly or equitably: Millions upon millions are not prosperous. Still, nothing like this surge of well-being has ever happened before. No one knows whether the rise can continue, or whether our current affluence can be sustained.

Today the world has about 7.6 billion inhabitants. Most demographers believe that by about 2050, that number will reach 10 billion or a bit less. Around this time, our population will probably begin to level off. As a species, we will be at about “replacement level”: On average, each couple will have just enough children to replace themselves. All the while, economists say, the world’s development should continue, however unevenly. The implication is that when my daughter is my age, a sizable percentage of the world’s 10 billion people will be middle-class.

Like other parents, I want my children to be comfortable in their adult lives. But in the hospital parking lot, this suddenly seemed unlikely. Ten billion mouths, I thought. Three billion more middle-class appetites. How can they possibly be satisfied? But that is only part of the question. The full question is: How can we provide for everyone without making the planet uninhabitable?

Two Schools of Plant Development: Followers of William Vogt and Norman Borlaug

Both men thought of themselves as using new scientific knowledge to face a planetary crisis. But that is where the similarity ends. For Borlaug, human ingenuity was the solution to our problems. One example: By using the advanced methods of the Green Revolution to increase per-acre yields, he argued, farmers would not have to plant as many acres, an idea researchers now call the “Borlaug hypothesis.” Vogt’s views were the opposite: The solution, he said, was to use ecological knowledge to get smaller. Rather than grow more grain to produce more meat, humankind should, as his followers say, “eat lower on the food chain,” to lighten the burden on Earth’s ecosystems. This is where Vogt differed from his predecessor, Robert Malthus, who famously predicted that societies would inevitably run out of food because they would always have too many children. Vogt, shifting the argument, said that we may be able to grow enough food, but at the cost of wrecking the world’s ecosystems.

I think of the adherents of these two perspectives as “Wizards” and “Prophets.” Wizards, following Borlaug’s model, unveil technological fixes; Prophets, looking to Vogt, decry the consequences of our heedlessness.

Even though the global population in 2050 will be just 25 percent higher than it is now, typical projections claim that farmers will have to boost food output by 50 to 100 percent. The main reason is that increased affluence has always multiplied the demand for animal products such as cheese, dairy, fish, and especially meat—and growing feed for animals requires much more land, water, and energy than producing food simply by growing and eating plants. Exactly how much more meat tomorrow’s billions will want to consume is unpredictable, but if they are anywhere near as carnivorous as today’s Westerners, the task will be huge. And, Prophets warn, so will the planetary disasters that will come of trying to satisfy the world’s desire for burgers and bacon: ravaged landscapes, struggles over water, and land grabs that leave millions of farmers in poor countries with no means of survival.

What to do? Some of the strategies that were available during the first Green Revolution aren’t anymore. Farmers can’t plant much more land, because almost every accessible acre of arable soil is already in use. Nor can the use of fertilizer be increased; it is already being overused everywhere except some parts of Africa, and the runoff is polluting rivers, lakes, and oceans. Irrigation, too, cannot be greatly expanded—most land that can be irrigated already is. Wizards think the best course is to use genetic modification to create more-productive crops. Prophets see that as a route to further overwhelming the planet’s carrying capacity. We must go in the opposite direction, they say: use less land, waste less water, stop pouring chemicals into both.

The Rub is Rubisco

All the while that Wizards were championing synthetic fertilizer and Prophets were denouncing it, they were united in ignorance: Nobody knew why plants were so dependent on nitrogen. Only after the Second World War did scientists discover that plants need nitrogen chiefly to make a protein called rubisco, a prima donna in the dance of interactions that is photosynthesis.

In photosynthesis, as children learn in school, plants use energy from the sun to tear apart carbon dioxide and water, blending their constituents into the compounds necessary to make roots, stems, leaves, and seeds. Rubisco is an enzyme that plays a key role in the process. Enzymes are biological catalysts. Like jaywalking pedestrians who cause automobile accidents but escape untouched, enzymes cause biochemical reactions to occur but are unchanged by those reactions. Rubisco takes carbon dioxide from the air, inserts it into the maelstrom of photosynthesis, then goes back for more. Because these movements are central to the process, photosynthesis walks at the speed of rubisco.

Alas, rubisco is, by biological standards, a sluggard, a lazybones, a couch potato. Whereas typical enzyme molecules catalyze thousands of reactions a second, rubisco molecules deign to involve themselves with just two or three a second. Worse, rubisco is inept. As many as two out of every five times, rubisco fumblingly picks up oxygen instead of carbon dioxide, causing the chain of reactions in photosynthesis to break down and have to restart, wasting energy and water. Years ago I talked with biologists about photosynthesis for a magazine article. Not one had a good word to say about rubisco. “Nearly the world’s worst, most incompetent enzyme,” said one researcher. “Not one of evolution’s finest efforts,” said another. To overcome rubisco’s lassitude and maladroitness, plants make a lot of it, requiring a lot of nitrogen to do so. As much as half of the protein in many plant leaves, by weight, is rubisco—it is often said to be the world’s most abundant protein. One estimate is that plants and microorganisms contain more than 11 pounds of rubisco for every person on Earth.

The Promise of C4 Photosynthesis

Evolution, one would think, should have improved rubisco. No such luck. But it did produce a work-around: C4 photosynthesis (C4 refers to a four-carbon molecule involved in the scheme). At once a biochemical kludge and a clever mechanism for turbocharging plant growth, C4 photosynthesis consists of a wholesale reorganization of leaf anatomy.

When carbon dioxide comes into a C4 leaf, it is initially grabbed not by rubisco but by a different enzyme that uses it to form a compound that is then pumped into special, rubisco-filled cells deep in the leaf. These cells have almost no oxygen, so rubisco can’t bumblingly grab the wrong molecule. The end result is exactly the same sugars, starches, and cellulose that ordinary photosynthesis produces, except much faster. C4 plants need less water and fertilizer than ordinary plants, because they don’t waste water on rubisco’s mistakes. In the sort of convergence that makes biologists snap to attention, C4 photosynthesis has arisen independently more than 60 times. Corn, tumbleweed, crabgrass, sugarcane, and Bermuda grass—all of these very different plants evolved C4 photosynthesis.

jatiluwih2

Balinese Rice Fields

The Rice Consortium Moonshot

In the botanical equivalent of a moonshot, scientists from around the world are trying to convert rice into a C4 plant—one that would grow faster, require less water and fertilizer, and produce more grain. The scope and audacity of the project are hard to overstate. Rice is the world’s most important foodstuff, the staple crop for more than half the global population, a food so embedded in Asian culture that the words rice and meal are variants of each other in both Chinese and Japanese. Nobody can predict with confidence how much more rice farmers will need to grow by 2050, but estimates range up to a 40 percent rise, driven by both increasing population numbers and increasing affluence, which permits formerly poor people to switch to rice from less prestigious staples such as millet and sweet potato.

Funded largely by the Bill & Melinda Gates Foundation, the C4 Rice Consortium is the world’s most ambitious genetic-engineering project. But the term genetic engineering does not capture the project’s scope. The genetic engineering that appears in news reports typically involves big companies sticking individual packets of genetic material, usually from a foreign species, into a crop. The paradigmatic example is Monsanto’s Roundup Ready soybean, which contains a snippet of DNA from a bacterium that was found in a Louisiana waste pond. That snippet makes the plant assemble a chemical compound in its leaves and stems that blocks the effects of Roundup, Monsanto’s widely used herbicide. The foreign gene lets farmers spray Roundup on their soy fields, killing weeds but leaving the crop unharmed. Except for making a single tasteless, odorless, nontoxic protein, Roundup Ready soybeans are otherwise identical to ordinary soybeans.

What the C4 Rice Consortium is trying to do with rice bears the same resemblance to typical genetically modified crops as a Boeing 787 does to a paper airplane. Rather than tinker with individual genes in order to monetize seeds, the scientists are trying to refashion photosynthesis, one of the most fundamental processes of life. Because C4 has evolved in so many different species, scientists believe that most plants must have precursor C4 genes. The hope is that rice is one of these, and that the consortium can identify and awaken its dormant C4 genes—following a path evolution has taken many times before. Ideally, researchers would switch on sleeping chunks of genetic material already in rice (or use very similar genes from related species that are close cousins but easier to work with) to create, in effect, a new and more productive species. Common rice, Oryza sativa, will become something else: Oryza nova, say. No company will profit from the result; the International Rice Research Institute, where much of the research takes place, will give away seeds for the modified grain, as it did with Green Revolution rice.

Directing the C4 Rice Consortium is Jane Langdale, a molecular geneticist at Oxford’s Department of Plant Sciences. Initial research, she told me, suggests that about a dozen genes play a major part in leaf structure, and perhaps another 10 genes have an equivalent role in the biochemistry. All must be activated in a way that does not affect the plant’s existing, desirable qualities and that allows the genes to coordinate their actions. The next, equally arduous step would be breeding rice varieties that can channel the extra growth provided by C4 photosynthesis into additional grains, rather than roots or stalk. All the while, varieties must be disease-resistant, easy to grow, and palatable for their intended audience, in Asia, Africa, and Latin America.

“I think it can all happen, but it might not,” Langdale said. She was quick to point out that even if C4 rice runs into insurmountable obstacles, it is not the only biological moonshot. Self-fertilizing maize, wheat that can grow in salt water, enhanced soil-microbial ecosystems—all are being researched. The odds that any one of these projects will succeed may be small, the idea goes, but the odds that all of them will fail are equally small. The Wizardly process begun by Borlaug is, in Langdale’s view, still going strong.

Summary

To Vogtians, the best agriculture takes care of the soil first and foremost, a goal that entails smaller patches of multiple crops—difficult to accomplish when concentrating on the mass production of a single crop. Truly extending agriculture that does this would require bringing back at least some of the people whose parents and grandparents left the countryside. Providing these workers with a decent living would drive up costs. Some labor-sparing mechanization is possible, but no small farmer I have spoken with thinks that it would be possible to shrink the labor force to the level seen in big industrial operations. The whole system can grow only with a wall-to-wall rewrite of the legal system that encourages the use of labor. Such large shifts in social arrangements are not easily accomplished.

And here is the origin of the decades-long dispute between Wizards and Prophets. Although the argument is couched in terms of calories per acre and ecosystem conservation, the disagreement at bottom is about the nature of agriculture—and, with it, the best form of society. To Borlaugians, farming is a kind of useful drudgery that should be eased and reduced as much as possible to maximize individual liberty. To Vogtians, agriculture is about maintaining a set of communities, ecological and human, that have cradled life since the first agricultural revolution, 10,000-plus years ago. It can be drudgery, but it is also work that reinforces the human connection to the Earth. The two arguments are like skew lines, not on the same plane.

My daughter is 19 now, a sophomore in college. In 2050, she will be middle-aged. It will be up to her generation to set up the institutions, laws, and customs that will provide for basic human needs in the world of 10 billion. Every generation decides the future, but the choices made by my children’s generation will resonate for as long as demographers can foresee. Wizard or Prophet? The choice will be less about what this generation thinks is feasible than what it thinks is good.

Feeding the World Requires Cutting-Edge Science and Institutions


Doomsday was predicted but failed to happen at midnight.

Climatists Exploit Pensioners and Taxpayers

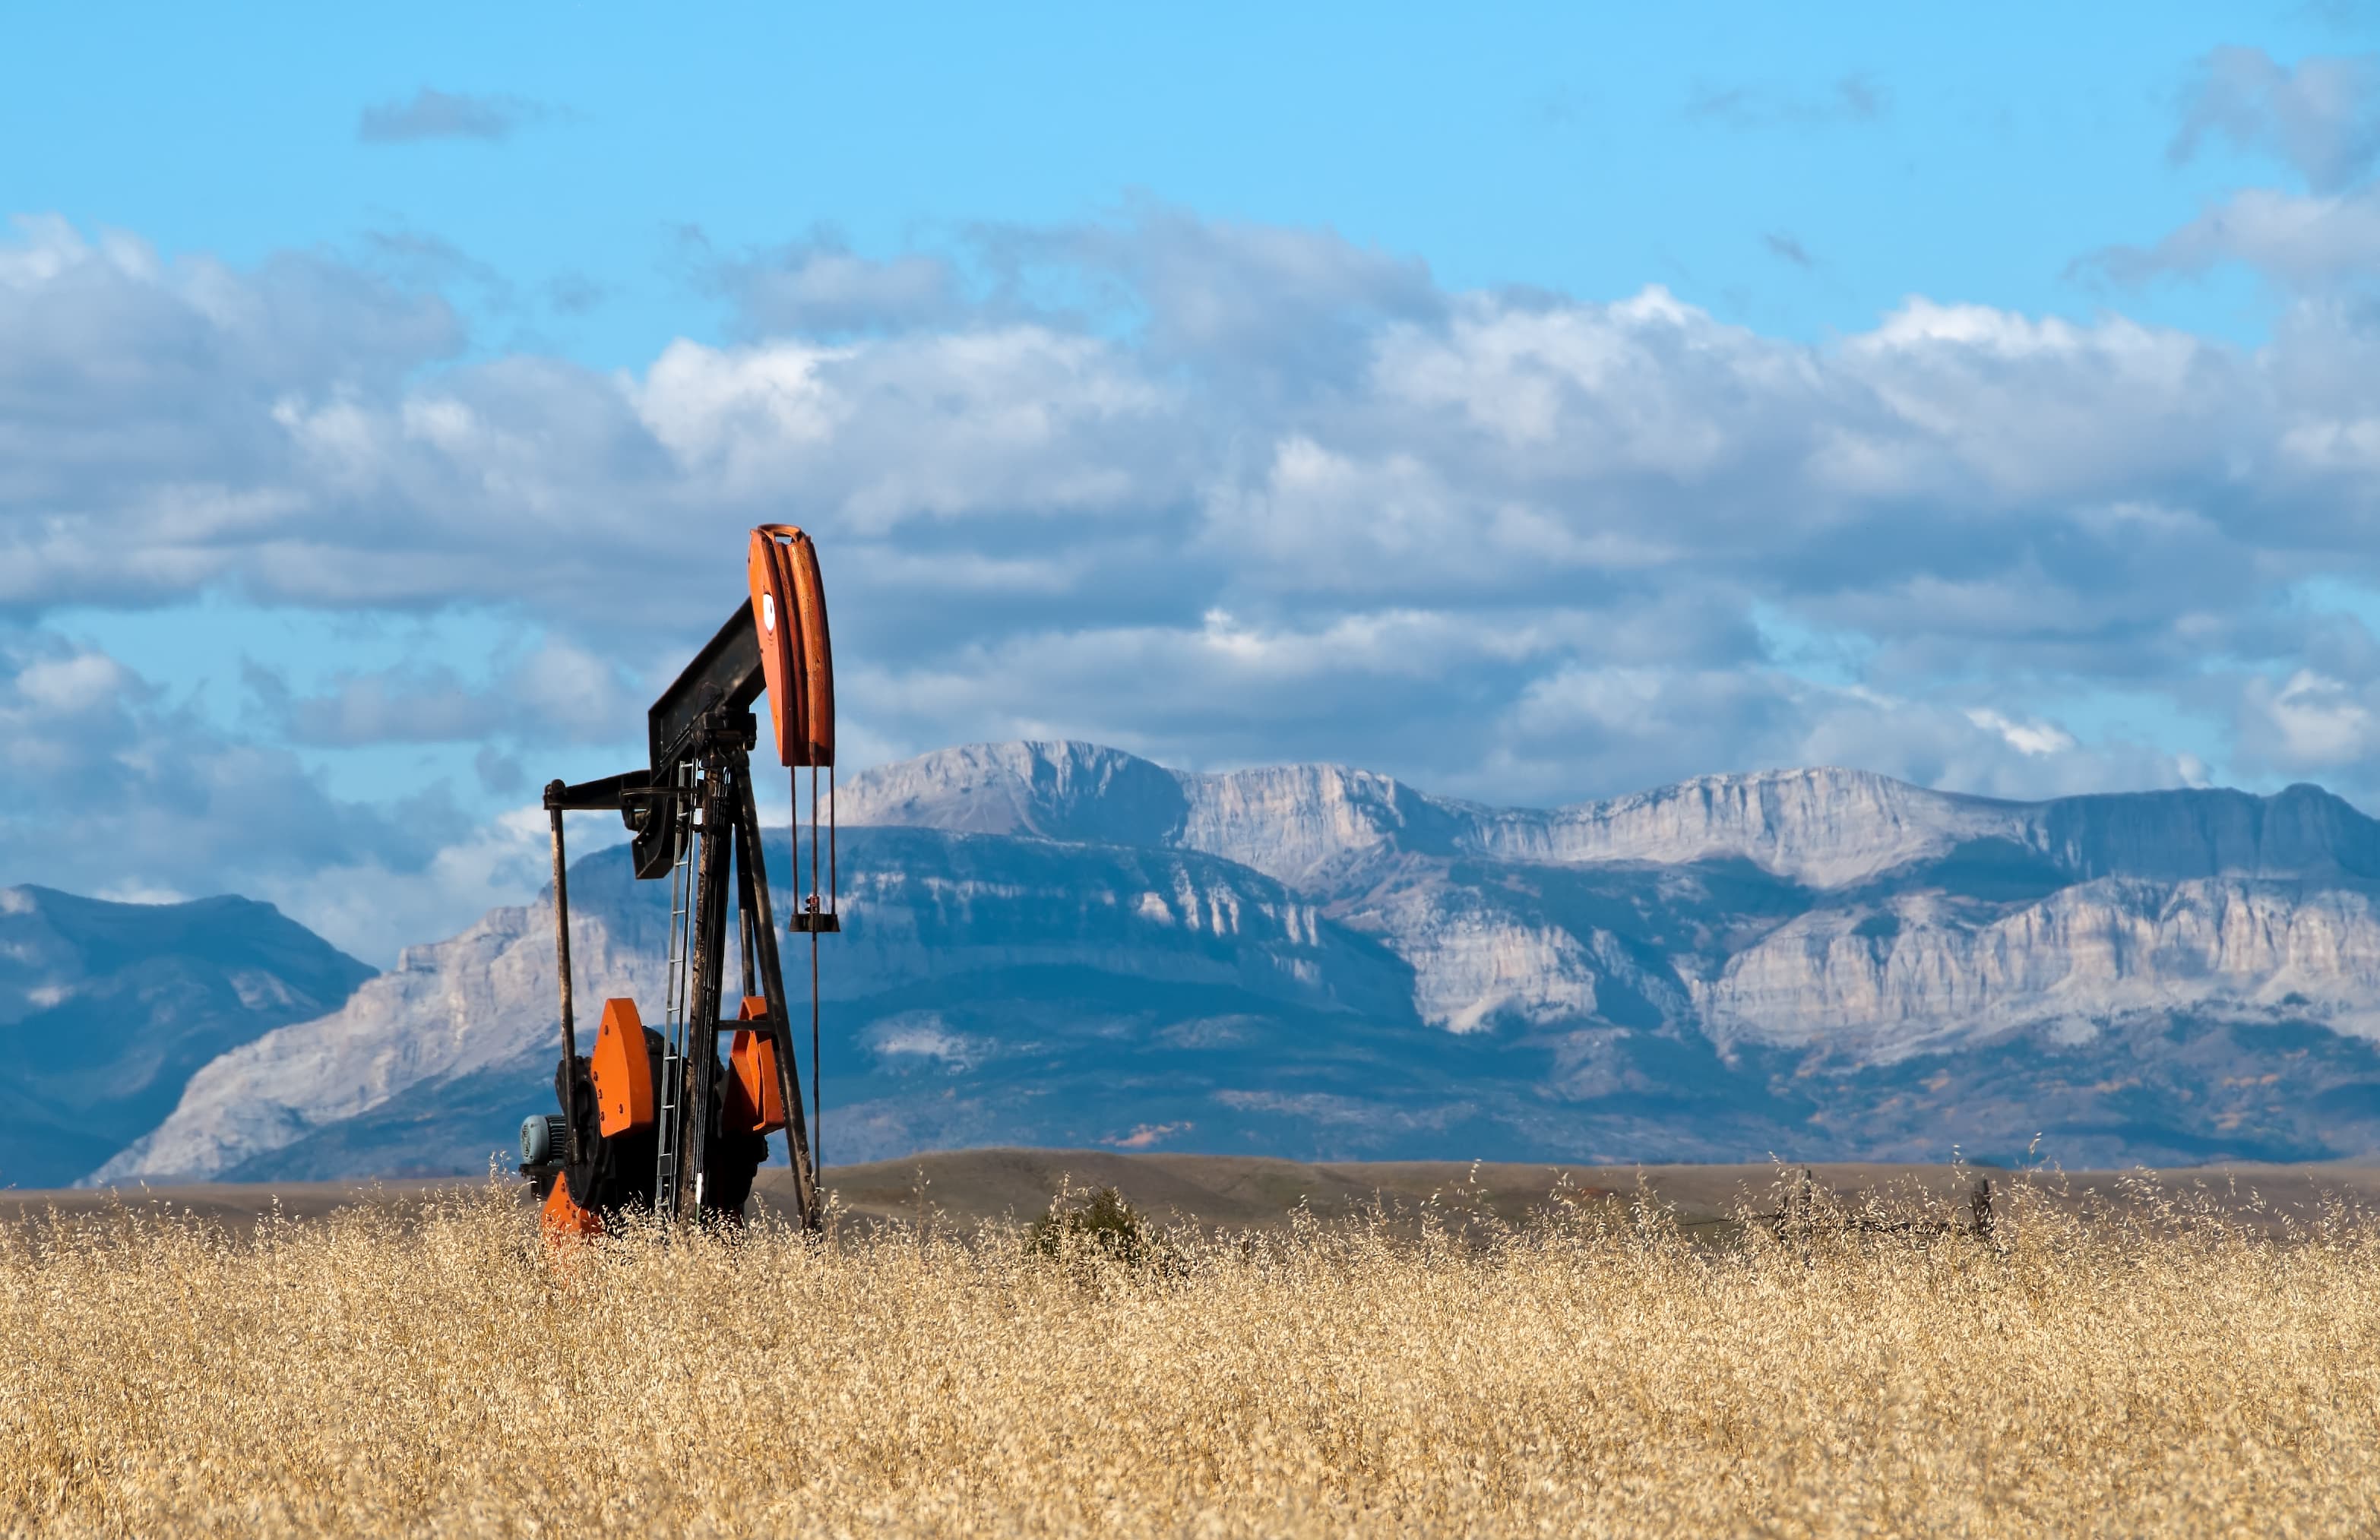
New York city signed up for “Me Too” commitment to Paris Accord, and the city’s pensioners are paying the price as their retirement funds suffer from virtue signaling divestment from oil companies.  Jeff Patch writes in Real Clear Policy End the Political Games With Public Pensions  Excerpts below with my bolds.

There’s a link on New York City Comptroller Scott Stringer’s website to an outline of his office’s Powers and Duties Under New York State Law. The 159-page overview covers an extensive spectrum of legal responsibilities, ranging from arts and cultural affairs to worker compensation. Nowhere does the list reference shareholder activism, directing city environmental policies, or — for that matter — leveraging the $190 billion in pension fund assets his office stewards to pursue a political agenda.

And yet that’s exactly what Mr. Stringer is doing. The professional investment managers of the city’s five public-sector pension funds, their board members, and Stringer himself are all exploiting their positions as custodians of the retirement savings of the city’s workers to promote their own political objectives. Politics seems to pervade every action of the city comptroller’s office, which just last month announced a plan to divest pension holdings from fossil-fuel interests, regardless of the impact on financial performance.

A new report from the American Council for Capital Formation sheds light on how such political machinations have impacted New York’s public pension funds, highlighting the price residents pay for their leaders’ political predilections. Specifically, the report finds that nearly $1 of every $5 of personal income taxes the city collects go to paying down the pension system’s liabilities. Meanwhile, the liabilities continue to grow, with nearly $10 billion from the City’s proposed 2018 budget needed to cover a pension funding shortfall that ranges between $65 billion and $142 billion.

As the person responsible for the management of those funds, one might expect Mr. Stringer to focus on making prudent investments. Fiscal diligence should be the top priority of any comptroller’s office. Instead, Stringer and his staff have continued using public monies as a political tool to pressure social change in corporate boardrooms.

For instance, last year, his office launched the second phase of a project aimed at pressuring public companies on various social issues, including his Boardroom Accountability Project 2.0, which pushes companies to disclose demographics on members, including their sexual orientation. Over the course of 2017, New York City Comptroller’s Office has become one of the nation’s most aggressive sponsors of activist shareholder proposals, submitting close to 100 measures, including a new initiative to divest public funds entirely from fossil fuels by 2020.

The ACCF report uncovers numerous instances of fiduciary irresponsibility. It reveals how fund managers have chosen to systematically increase investments in the Developed Environmental Activist stocks, despite the classes continued underperformance against the rest of the fund. (Those assets now make up 12 percent of the total fund.) And it details how Stringer prioritizes headline-grabbing political appearances ahead of resolving the under-performance of his funds.

Perhaps most concerning point is that a majority of Stringer’s constituents — the teachers, nurses, policemen, and firefighters who dutifully pay into public pension funds every month — remain oblivious to this emerging crisis. Last week, a separate study released by the Spectrum Group revealed that 80 percent of the city’s current and former employees were unaware that their pensions were not fully funded. Two-thirds of all respondents said they wanted their funds’ managers to concentrate on maximizing their returns.

Taken together, these reports make two points abundantly clear. First, there is a very real disconnect between the objectives of the people who own the funds and their professional managers. Second, this disconnect has consequences not just pension fund members, but also for taxpayers across the city. In short, everybody loses — except Stringer and his political supporters.

The city comptroller has a duty to put the financial interests of taxpayers and public employees above his narrow political ambitions. If Mr. Stringer wants to set social policy, he should run for city or state office instead. Until then, he should focus on safeguarding the future of his constituents’ pension funds.

Civil Climate Discourse

The issue of global warming/climate change has been used to polarize populations for political leverage. People like myself who are skeptical of alarmist claims find it difficult to engage with others whose minds are made up with or without a factual basis. In a recent email Alex Epstein gives some good advice how to talk about energy and climate. At the end I provide links to other material from Alex supporting his principle message regarding human benefits from using fossil fuels. Text below is his email with my bolds.

Two simple-but-powerful tactics

1. Opinion Stories

Unless I have some specific reason for wanting to have a long conversation I like to keep my conversations short, with the end goal of getting the other person to consume some high-impact resource.

One way to make this even more effective is to offer to email/mail the person a resource. Then you’ll have their contact info and can follow up in a few weeks.

The last paragraph of your message is really important. You’re telling the story of how you came to your opinion. I call this device “the opinion story.”

Here’s how it works.

Imagine you’re trying to persuade someone to read your favorite book. My favorite book is Atlas Shrugged, by Ayn Rand.

I used to say: “Atlas Shrugged is the best book you’ll ever read. You have to read it.”

That’s an opinion statement. If you haven’t read the book I’ll bet that statement makes you resistant. “Oh really? You’re telling me what the best book I’ll ever read is? You’re telling me what I have to read?”

Opinion statements often breed resistance and reflexive counter-arguments. So now I try to persuade people differently.

I might say: “My favorite book is Atlas Shrugged by Ayn Rand. I read it when I was 18 and the way the characters thought and approached life motivated me to pursue a career I love and give it everything I have.”

How do you react to that statement?

Probably better. You’re probably not resistant. You may well be intrigued. And you can’t disagree with me–because I didn’t tell you what to think, I told you my opinion story. I respected your independence.

While statements breed resistance and counter-argument, stories often breed interest and requests for more.

You can use opinion stories for anything, no matter how controversial.

For example, if someone asks me about my book, The Moral Case for Fossil Fuels, I don’t need to say “I prove that we should be using more fossil fuels, not less.” I can just say “I researched the pros and cons of different forms of energy and was surprised to come to the conclusion that we should be using more fossil fuels, not less.”

I like to have an opinion story for every controversial opinion I hold.

2. Introducing Surprising Facts

Reader Comment: “The problem I always run into is that they really believe Germany is a success.”

I’ve had the same experience, too! On many issues.

Often in conversation the phenomenon of conflicting factual claims on an issue—such as the impact of solar and wind on Germany’s economy—leads to an impasse.

One way to deal with this is to focus on establishing an explicit framework, with human flourishing (not minimum impact) as the goal and full context analysis (not bias and sloppiness) as the process. Most disputes stem from conflicting frameworks, not conflicting facts. And if you offer a compelling framework you’ll be more trustworthy on the facts.

That said, here’s a tactic I discovered a few years ago to make certain factual points much more persuasive in the moment..

I’ll start with how I discovered it.

I was walking through the Irvine Spectrum mall with a good friend when we ran into two young women working to promote Greenpeace.

My friend found one of the women attractive and said he wanted to talk to her. I thought, given my experiences with (paid) Greenpeace activists, that this was unlikely to be an edifying experience, and encouraged him to instead record a conversation between me and one of the women. Unfortunately for posterity, I was unpersuasive and what follows was never recorded.

I decided to talk to the other Greenpeace woman. She quickly started “educating” me on how Germany was successfully running on solar and wind.

Me: “Really? I’m curious where you’re getting that because I research energy for a living–and Germany is actually building a lot of new coal plants right now.”

Greenpeace: “No, that can’t be true.”

Me: “Okay, how about this? I’ll email you a news article about Germany building new coal plants. If I do, will you reconsider your position?” [Note: This is an example of the technique I recommended above.]

Greenpeace: Hesitates.

Me: “Actually, wait, we have smartphones. I’m going to Google Germany and coal. Let’s see what comes up.”

Displaying on my iPhone is a recent news story whose headline is something very close to: “Germany to build 12 new coal plants, government announces.”

Me: “So what do you think?”

Greenpeace: “I don’t know,” followed by—very rare for a Greenpeace activist—having nothing to say.

Had this been a normal person I am confident the live confirmation of the surprising fact would have made a lasting impression.

I think this tactic works best for news stories about surprising facts. Vs. an opinion story about some issue of analysis, like what Germany’s GDP is.

Summary

Alex Epstein is among those who demonstrate from public information sources comparisons between societies who use carbon fuels extensively and those who do not. The contrast is remarkable: Societies with fossil fuels have citizens who are healthier, live longer, have higher standards of living, and enjoy cleaner air and drinking water, to boot. Not only do healthier, more mobile people create social wealth and prosperity, carbon-based energy is heavily taxed by every society that uses it. Those added government revenues go (at least some of it) into the social welfare of the citizenry. By almost any measure, carbon-based energy makes the difference between developed and underdeveloped populations.

A previous post Social Benefits of Carbon referenced facts and figures from Alex’s book which can be accessed here

Other Resources:
Two Page Overview of The Moral Case for Fossil Fuels — What it is and why it matters 
main points are:
How to think about our energy future
Fossil fuels & human flourishing: the benefits
Fossil fuels & human flourishing: environmental concerns

11 page Introduction to The Moral Case for Fossil Fuels

Maslow’s hierarchy of human needs updated.

Raw Water: More Post-Modern Insanity

Available from Amazon

Contemporary style-setters display great nostalgia for pre-industrial ways of living, without ever having to subsist in the natural world. Thus they advocate getting energy from burning trees or windmills so that evil fossil fuels can be left in the ground. Now these Luddites want to turn back scientific progress in water purification, claiming that untreated water is superior.

John Robson explains in the National Post article Raw water is proof the comforts of pampered modernity have gone too far   Excerpts below with my bolds.

With the raw-water craze, people are deliberately drinking unhealthy water for their health, writes John Robson.Postmedia News

In case you’re also in hiding from the insanity we call “popular culture,” there’s this new trend where you get healthy by drinking “naturally probiotic” water that hasn’t been treated to remove animal poop. No, I mean to remove essential minerals, ions and, um, animal poop.

The National Post says people aren’t just deliberately drinking unhealthy water for their health, they’re paying nearly $10 per litre for non-vintage Eau de Lac. Yet they would riot if asked to pay such a price for gasoline or, indeed, to drink ditch water from their tap.

Many reputable people have leapt up to condemn this fad as obviously unhealthy. But they are getting the same sani-wiped elbow that common sense, authority and pride in past achievement now routinely receive. (Can I just note here that the Oprah for President boom, which in our fast-paced social-media times lasted roughly 17 hours, foundered partly because she rose to fame and fortune peddling outrageous quackery? Donald Trump did not invent or patent contempt for logic and evidence.)

Raw water is hardly the only fad to gain in strength, the more reputable opinion condemns it. And let’s face it; reputable opinion has dug itself a pretty deep hole with its propensity for disregarding evidence and silencing dissent. I don’t just mean in the bad old days. But there must be some kind of golden mean between believing every news story with “experts say” in the headline and refusing to vaccinate your children or boil your water.

Seriously. Raw water? Doesn’t everybody know if you must drink from a tainted source it is vital to cook the stuff first? Tea wasn’t healthy primarily because of the plant’s alleged medicinal properties. Boiling water to make it meant you killed the bacteria … before they killed you.

My late friend Tom Davey, publisher of Environmental Science & Engineering, was routinely indignant that people could be induced to pay premium prices for bottled water when safe tap water was the single greatest environmental triumph in human history. But today some trendies are willing to pay premium prices to avoid safe tap water, partly on the basis of the same hooey about trace elements that made “mineral” water popular, partly out of paranoia once the purview of anti-fluoridation Red-baiters, and partly out of amazing scientific ignorance including about the presence of vital nutrients in food, especially if you don’t just eat the super-processed kind.

There. I said it. Some of what we ingest is overly processed, relentlessly scientifically improved until it becomes harmful (a problem by no means restricted to food). But some isn’t, including tap water.

I realize safe drinking water was hailed as an achievement back when mainstream environmentalists wanted the planet to be nice for people. Today’s far greater skepticism about whether human and environmental well-being are compatible creates considerable reluctance to make our well-being a significant measure of progress. But I am in the older camp. Without being insensible to the “crowding out” of ecosystems even by flourishing human communities, let alone poor ones, I still believe we can live well in harmony with nature, and only thus.

Some conservative associates think my deep unease with factory farming requires me to line my hat with tin foil. Other people believe my support for conservatism requires me to line my head with it. But I can only fit so much metal into either, and I draw the line at deliberately drinking the kind of water that used to bring us cholera epidemics.

Would it be impolite to cite this trend as proof that modernity has more money than brains, that the more a life of luxury is delivered to us as a birthright rather than being a hard-won and inherently precarious achievement, the less we are able to count our blessings or act prudently?

By all means save the whales. Get plastic out of the oceans. Protect ugly as well as cute species and their ecosystems. Know that man cannot flourish cut off from nature, and weep at Saruman’s conversion of the Shire from bucolic to industrial in the Lord of the Rings. But you can’t do yourself or the Earth any good while dying of dysentery you brought on yourself by pampered stupidity.

Ross Pomeroy adds an essay at RealClearScience ‘Raw’ Water Is Insulting (my bolds)

In 2015, 844 million people lacked access to even a basic drinking water service. These people, almost entirely from developing areas in Africa and Asia, are forced to play roulette by drinking water potentially contaminated with bacteria and viruses that cause diseases like diarrhea, cholera, dysentery, typhoid, and polio, as well as a variety of parasitic infections. Globally, a half million people die each year from diarrhea contracted via contaminated drinking water, many of them children. Another 240 million suffer from schistosomiasis, a parasitic infestation of flatworms originating from snail feces.

Here in the United States, we generally don’t have to worry about waterborne illness. That’s because our tap-water travels through a rigorous system of mechanical filtration and chemical treatment which expunges contaminants, resulting in H2O that’s clean, refreshing, and among the safest in the world.

Raw water is insulting; insulting to the health of those that drink it, to the intelligence of those who consider it, and to the hundreds of millions of people around the world who yearn for treated water free from raw contamination.