Inside a True Believer’s Mind

true-believer

At Slate Susan Matthews writes Bret Stephens’ First Column for the New York Times Is Classic Climate Change Denialism  It doesn’t outright reject the facts—which makes it all the more insidious.

Key Paragraphs (my bolding for emphasis)

But in reality, the goal of this column is not to help readers learn how to reason with people who are skeptical about climate change. Instead, the column reinforces the idea that those people might have a point. The New York Times push notification that went out Friday afternoon about the column said as much—“reasonable people can be skeptical about the dangers of climate change,” it read. That is not actually true, and nothing that Stephens writes makes a case for why it might be true. This column is not a lesson for people who want to advance good climate policy. Instead, it is a dog whistle to people who feel confused about climate change. It’s nothing more than textbook denialism.

The institutions Stephens questions in his column are not singular entities but entire ideas—scientists who may not see their biases, statistical models that might be skewed, liberals who may be so swayed by their ideology. His argument is convincing because the institutions he mentions can make mistakes. It’s true, there are some problems with how we use probabilities in science. We tend to be bad at distinguishing between correlation and causation. Sometimes our biases do get in the way. Stephens knows this, and he taps into it in his piece. “Much else that passes as accepted fact is really a matter of probabilities,” he suggests. You have to be an idiot or a zealot to believe climate change is certain, whispers the subtext.

The Credo

Regardless of what Stephens says in this column, and regardless of Clinton’s modeling failures, climate change is a terrible threat to life as we know it on this planet. Anyone who wants to honestly investigate the data will come to the same conclusion that the scientific establishment has—climate change is real, and dangerous. Our failures elsewhere—even in the disturbing wake of the election of Donald J. Trump—do not negate that. The questions are no longer whether and how but how soon and how bad. Climate change is happening, and “claiming total certainty about the science” does not “traduce the spirit of science.” Instead, it is a reasonable interpretation of the science at hand.

Don’t Give an Inch

What he is suggesting here is that the rational way to go forward with a conversation about climate change is to admit that climate change might not be certain. This is similar to the torturous logic he puts forward throughout the rest of the piece—the only way to be reasonable about this topic is to give in to those who are unreasonable about it. While he calmly insists he is the only logical person around, he is spewing complete bullshit.

Stephens article itself is excerpted at  NYT Opens Climate Can of Worms

Counting Climate Dollars: Who Controls the Debate?


Thanks to an opinion piece in Washington Post, I discovered the work of a serious skeptical thinktank called Capital Research Center. This short video explains how global warming/climate change activists have repeatedly distorted how public communications on the issue are funded, and how dominant are the alarmist dollars.

The full study and numerous other resources are at Climate Dollars

The WP article is A Climate Hysteric’s Fake Enemies List which can also be accessed at Climate Dollars org. link above.


NYT Opens Climate Can of Worms


Fishermen often discovered how easy it was to open a can of bait worms, and how difficult it was to close them. Once the worms discovered an opportunity to escape, it became nearly impossible to keep them contained. Some experts say the metaphor is a modern extension of Pandora’s Box.

In a previous post NYT Readers Face Diversity I provided a background for New York Times newest columnist Bret Stephens, with emphasis on his climate change commentary.

Now his first column published in NYT appears Climate of Complete Certainty, an invitation to examine the facts about climate change. Excerpts below.

We live in a world in which data convey authority. But authority has a way of descending to certitude, and certitude begets hubris. From Robert McNamara to Lehman Brothers to Stronger Together, cautionary tales abound.

We ought to know this by now, but we don’t. Instead, we respond to the inherent uncertainties of data by adding more data without revisiting our assumptions, creating an impression of certainty that can be lulling, misleading and often dangerous. Ask Clinton.

With me so far? Good. Let’s turn to climate change.

Last October, the Pew Research Center published a survey on the politics of climate change. Among its findings: Just 36 percent of Americans care “a great deal” about the subject. Despite 30 years of efforts by scientists, politicians and activists to raise the alarm, nearly two-thirds of Americans are either indifferent to or only somewhat bothered by the prospect of planetary calamity.

Why? The science is settled. The threat is clear. Isn’t this one instance, at least, where 100 percent of the truth resides on one side of the argument?

Well, not entirely. As Andrew Revkin wrote last year about his storied career as an environmental reporter at The Times, “I saw a widening gap between what scientists had been learning about global warming and what advocates were claiming as they pushed ever harder to pass climate legislation.” The science was generally scrupulous. The boosters who claimed its authority weren’t.

Anyone who has read the 2014 report of the Intergovernmental Panel on Climate Change knows that, while the modest (0.85 degrees Celsius, or about 1.5 degrees Fahrenheit) warming of the Northern Hemisphere since 1880 is indisputable, as is the human influence on that warming, much else that passes as accepted fact is really a matter of probabilities. That’s especially true of the sophisticated but fallible models and simulations by which scientists attempt to peer into the climate future. To say this isn’t to deny science. It’s to acknowledge it honestly.

By now I can almost hear the heads exploding. They shouldn’t, because there’s another lesson here — this one for anyone who wants to advance the cause of good climate policy. As Revkin wisely noted, hyperbole about climate “not only didn’t fit the science at the time but could even be counterproductive if the hope was to engage a distracted public.”

Let me put it another way. Claiming total certainty about the science traduces the spirit of science and creates openings for doubt whenever a climate claim proves wrong. Demanding abrupt and expensive changes in public policy raises fair questions about ideological intentions. Censoriously asserting one’s moral superiority and treating skeptics as imbeciles and deplorables wins few converts.

None of this is to deny climate change or the possible severity of its consequences. But ordinary citizens also have a right to be skeptical of an overweening scientism. They know — as all environmentalists should — that history is littered with the human wreckage of scientific errors married to political power.

Conclusion

I’ve taken the epigraph for this column from the Polish poet Czeslaw Milosz, who knew something about the evils of certitude. Perhaps if there had been less certitude and more second-guessing in Clinton’s campaign, she’d be president. Perhaps if there were less certitude about our climate future, more Americans would be interested in having a reasoned conversation about it.

New York Post (here) covers the nastiness of responses to Stephens’ first column. Stephens compares the blowback to what he got from Trump fans: “After 20 months of being harangued by bullying Trump supporters, I’m reminded that the nasty left is no different. Perhaps worse,” Stephens tweeted Friday afternoon, as the hateful messages kept rolling in.  New York Times used to be a “safe space”, maybe now not so much.

Bret Stephens

Update April 30

A response to Stephens article at Slate  Inside a True Believer’s Mind

Footnote:

Whenever I see those graphs of climate models projections, it reminds me of worms escaping.

Climate Evangelists Are Taking Over Your Local Weather Forecast

The battle by alarmists for hearts and minds is extending to many fronts, including recruiting family doctors, and in the case of this post, media weather reporters. Surveys have shown the meteorologists are not more convinced of global warming/climate change than is the American public (a slight majority). But efforts have been underway to convert them and use their telecasts and columns to promote climatism.

A balanced and analytical report appears in Bloomberg (an interesting place for such independent thinking).  Climate Evangelists Are Taking Over Your Local Weather Forecast Excerpts below.

Amber Sullins gets a minute or two to tell up to two million people about some extremely complicated science, using the tools of her trade: a pleasant voice, a green screen, and small icons denoting sun, clouds, rain, and wind. She is the chief meteorologist at ABC15 News in Phoenix, so her forecasts mostly call for sunshine. Within this brief window, however, Sullins sometimes manages to go beyond the next five days. Far beyond.

Amber Sullins, weather reporter at ABC15 News in Phoenix.

“We know climate change could affect everything about the way we live in the future, from agriculture and tourism to productivity and local business,” she once noted. “But at what cost?”

It was a 35-second segment in a nightly newscast, a mundane moment preceding reports about three fallen firefighters in Washington state and a dangerous development for air travelers. But that climate-focused scene, and hundreds of others like it playing out at local news stations across the country, marks a major shift in the way Americans hear about climate change. The safe and familiar on-air meteorologist, with little notice by viewers, has become a public diplomat for global warming.

There are about 500 broadcasters like Sullins and Morales, who each receive regular data dumps and ready-to-use graphics from Climate Matters, an organization whose mission is to turn TV meteorologists into local climate educators. The program was founded in 2010 by Climate Central, a research-and-journalism nonprofit, with help from George Mason University, the American Meteorological Society, and others. Newscasters who participate are sent possible topics for climate-related segments every week, with TV-ready data and graphics pegged to large-scale meteorological events, such as unusually high heat or precipitation, local trends, or seasonal themes.

Two-thirds of 18- to 64-year-olds in the U.S. watch a news broadcast, either on TV or a digital device, at least once a week, according to 2015 research by the market research company SmithGeiger LLC. Nearly 40 percent of people within this wide age group watch broadcast news on daily basis, and the reliable presence of an on-air meteorologist is a huge part of the draw.

“Local TV news wouldn’t exist any more if it weren’t for the weathercasts,” says Ed Maibach, director of George Mason University’s Center for Climate Change Communication.

Part of meteorologists’ reluctance to talk about the climate stems from the treacherous tools of their trade. Meteorologists learn very quickly that weather models are messy. Some no doubt sour on finicky climate models because of this experience. If short-term weather models make mistakes, it may seem reasonable to assume that a model projecting into the next century is ridiculous.

“Meteorologists are used to looking at models and being burned,” says Paul Douglas, a former TV weatherman-turned-serial entrepreneur, who recently published a book on climate change and faith.

Sullins, 34, knows there’s tension in telling her viewers about conditions in the 22nd century when she is reluctant to commit to a two-week forecast. “I can’t tell you what the high temperature is going to be on July 4 of this year, today,” Sullins says. “I can’t possibly tell you that. But I can tell you, based on climate, that in July, here in Phoenix, it’s going to be over 100 degrees. That’s easy.”

Her point is that weather and climate are “two entirely different beasts.” It’s like the difference between someone’s mood and disposition, Sullins says. She wants viewers of the nightly news to spend more time thinking about the planet’s disposition.

Summary

The PR campaign continues and intensifies with simplistic soundbites to persuade people to fear the future, in order to advance the anti-fossil fuel agenda. It is a Chinese water torture program well-funded and essential to the climate crisis industry.

But note the logical fallacy in Sullins’ statement above. She says: “I can tell you, based on climate, that in July, here in Phoenix, it’s going to be over 100 degrees.” That’s not climate change, that’s climate stability, something we depend on despite the fear-mongering.

How will viewers respond to this?  Will ratings improve by watching weather people jumping the shark? (It didn’t work for “Happy Days” TV show).  Or will people resent the attempted brainwashing and switch channels?

Footnote:

The hottest temperatures ever reported in Phoenix came in January 2015, when Fox 10 weatherman Cory McCloskey faced a malfunctioning temperature map on live television. “Wow, 750 degrees in Gila Bend right now,” he said, without breaking a sweat. “And 1,270 in Ahwatukee. Now, I’m not authorized to evacuate, but this temperature seems pretty high.” More than 6 million people have watched the blooper on YouTube.


Arctic Ice Goes Above Average

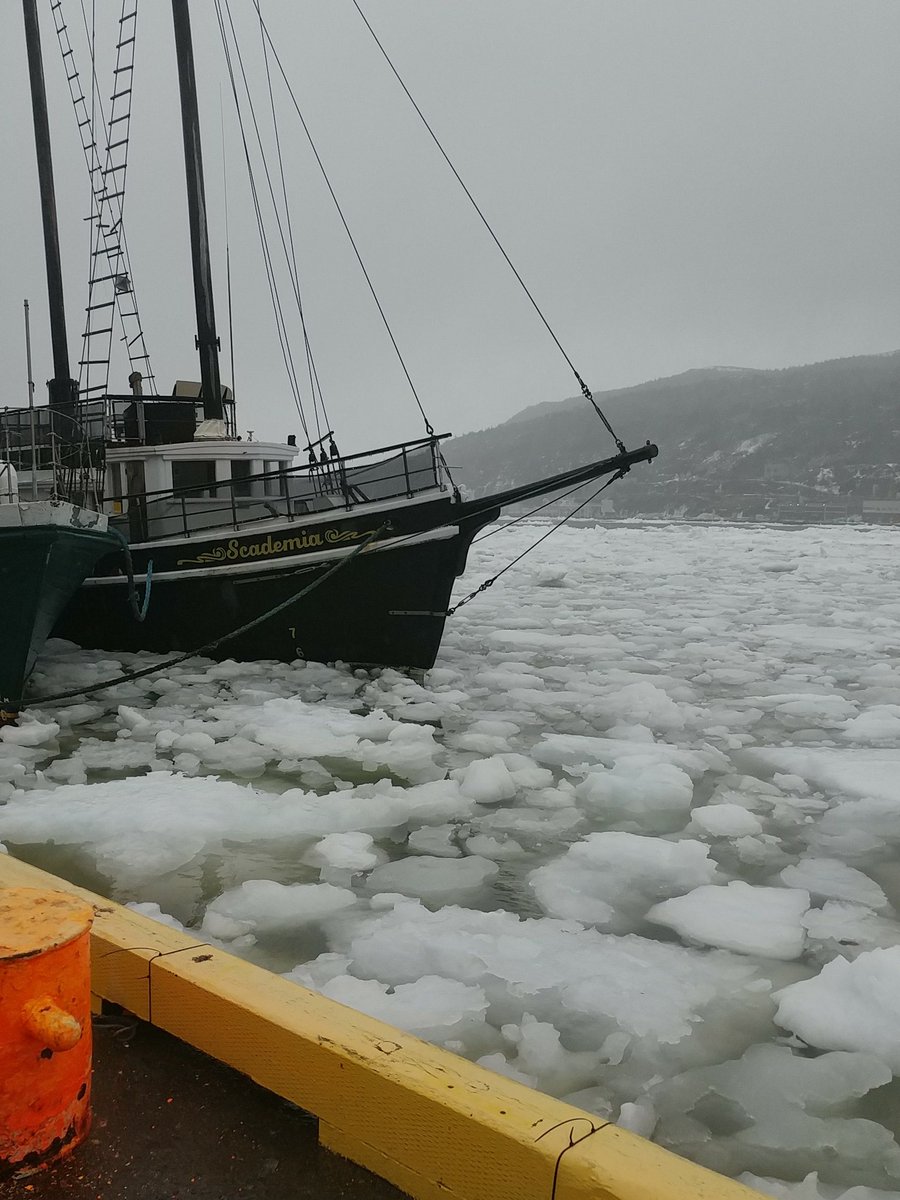
Heavy ice is making it impossible for fishermen from the Twillingate area to get to their crab fishing grounds. It may not open up until mid-May. (Twitter/@jeddore1972) Source: CBC

The title of this post sounds contradictory to most of what the media is saying about Arctic ice being in a tailspin, setting records for low extents, etc. And reports of ice blocking Newfoundland also fly in the face of media claims.

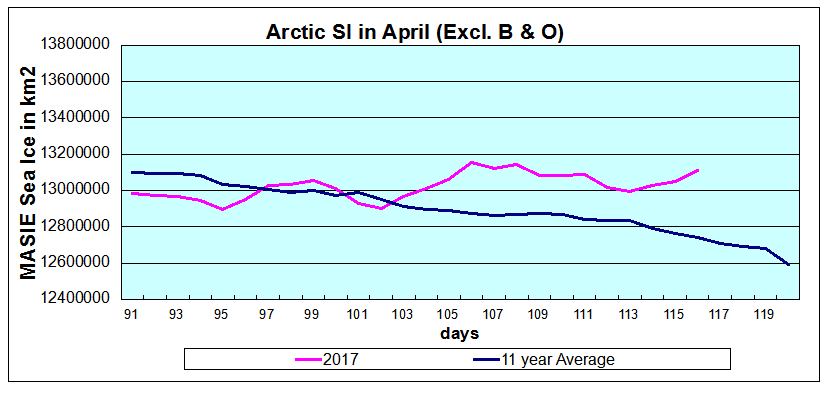
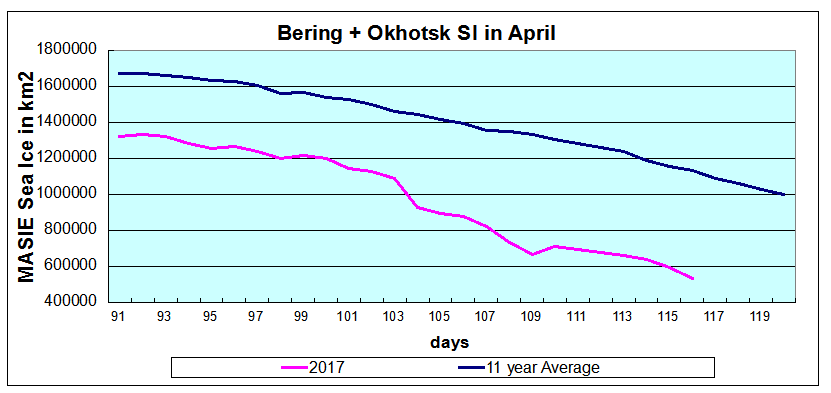
I will let you in on a secret: Arctic Ocean ice is doing fine and well above the decadal average. The only place where ice is below normal is outside the Arctic Ocean, namely Bering and Okhotsk Seas in the Pacific. Claims of disappearing ice pertain not to the Arctic itself, but to marginal Pacific seas that will melt out anyway in September.

I noticed the pattern this April when it became obvious that including Bering and Okhotsk in the Arctic totals gives a misleading picture. For sure they are part of Northern Hemisphere (NH) total sea ice, but currently the Pacific is going its own way, not indicative of the sea ice in the Central and Atlantic Arctic.

Graphically, MASIE shows that, excluding Bering and Okhotsk, 2017 Arctic Ocean sea ice is well above the 11 year average. Note that 2017 Arctic ice started April 100k km2 below average, and has now opened up a lead of ~300k km2 above average.


The second graph shows clearly how this year Bering and Okhotsk are abnormally low, and diverging further from average. At this point, Bering and Okhotsk combined are down to half of the decadal average.


The distinctive Pacific pattern is evident in the images of changing ice extents this April.  First, see how ice in Bering and Okhotsk seas has retreated steadily this month.

Meanwhile, on the Atlantic side ice has grown steadily.

The Chart below shows the traditional view of NH ice extents, which includes the Pacific seas together with the Arctic seas.  2017 is lower than average on this basis, though the difference is entirely due to Bering and Okhotsk, and obscures the ice surpluses elsewhere.  Comparisons with Sea Ice Index (SII) and 2007 are also shown.


The table for April 25, day 115 compares 2017 with the average (2006 to 2016), and with 2007 as the lowest year of the decade.

Region 2017115 Day 115
Average
2017-Ave. 2007115 2017-2007
 (0) Northern_Hemisphere 13643262 13917128 -273866 13213059 430203
 (1) Beaufort_Sea 1070445 1066352 4093 1043881 26564
 (2) Chukchi_Sea 957018 965138 -8121 959562 -2544
 (3) East_Siberian_Sea 1087137 1086188 949 1081682 5456
 (4) Laptev_Sea 896694 893869 2825 881893 14801
 (5) Kara_Sea 931199 916361 14838 841716 89483
 (6) Barents_Sea 546729 560682 -13953 362007 184722
 (7) Greenland_Sea 692413 640185 52228 648670 43743
 (8) Baffin_Bay_Gulf_of_St._Lawrence 1481910 1274382 207528 1155621 326289
 (9) Canadian_Archipelago 853214 848182 5032 835797 17417
 (10) Hudson_Bay 1260903 1240376 20527 1192783 68120
 (11) Central_Arctic 3248013 3233561 14452 3232010 16003
 (12) Bering_Sea 305065 671415 -366349 539149 -234083
 (13) Baltic_Sea 23034 32044 -9010 18182 4852
 (14) Sea_of_Okhotsk 286734 484320 -197586 411649 -124915

Note that all the central arctic seas are solid.  Barents is nearly average and much higher than 2007.  Baffin Bay-St.Lawrence is much above average and 2007, as shown by the Newfoundland ice that is part of the region.  The Bering and Okhotsk deficits are also obvious.

Summary

The details are important to form a proper perception of any natural process, including dynamics of sea ice waxing and waning. On closer inspection, the appearance of declining Arctic sea ice is actually another after effect of the recent El Nino and Blob phenomena, and quite restricted to the Pacific marginal seas.

Meanwhile, on the Atlantic side of the Arctic, we have sightings and reports of ice surges along the coast of Newfoundland, such amounts not seen since the 1980s. Below an image of St. John’s harbour with tons of ice, provided by Ryan Simms.


And from Twillingate: “Basically it’s just an ocean of ice ahead of us.’ – Derrick Bath, Polar Venture

Derrick Bath’s Polar Venture has spent hours trying to make it through the ice near Twillingate. (Submitted by Danny Bath)

Mind-Blowing Science

Cometh the man; Francis Bacon’s insight was that the process of discovery was inherently algorithmic. Photo courtesy NPG/Wikipedia

In a refreshing relief from Science Marches promoting slogans and tenets of climate dogma, we have an insightful look into a fruitful future for the scientific endeavor.

The article is Science has outgrown the human mind and its limited capacities by Ahmed Alkhateeb, a molecular cancer biologist at Harvard Medical School. (bolded text is my emphasis)

It starts with a great quote:

The duty of man who investigates the writings of scientists, if learning the truth is his goal, is to make himself an enemy of all that he reads and … attack it from every side. He should also suspect himself as he performs his critical examination of it, so that he may avoid falling into either prejudice or leniency.
– Ibn al-Haytham (965-1040 CE)

First the author reminds readers of the current sorry state of scientific research:  overwhelming quantity of papers with diminishing quality (bogus findings, unreplicable studies, sloppy methodology, etc.). He then raises an intriguing question:

One promising strategy to overcome the current crisis is to integrate machines and artificial intelligence in the scientific process. Machines have greater memory and higher computational capacity than the human brain. Automation of the scientific process could greatly increase the rate of discovery. It could even begin another scientific revolution. That huge possibility hinges on an equally huge question: Can scientific discovery really be automated?

Alkhateeb gets to the point of Bacon’s forming the scientific process:

The Baconian method attempted to remove logical bias from the process of observation and conceptualisation, by delineating the steps of scientific synthesis and optimizing each one separately. Bacon’s vision was to leverage a community of observers to collect vast amounts of information about nature and tabulate it into a central record accessible to inductive analysis. In Novum Organum, he wrote: ‘Empiricists are like ants; they accumulate and use. Rationalists spin webs like spiders. The best method is that of the bee; it is somewhere in between, taking existing material and using it.’

The Baconian method is rarely used today. It proved too laborious and extravagantly expensive; its technological applications were unclear. However, at the time the formalization of a scientific method marked a revolutionary advance. Before it, science was metaphysical, accessible only to a few learned men, mostly of noble birth. By rejecting the authority of the ancient Greeks and delineating the steps of discovery, Bacon created a blueprint that would allow anyone, regardless of background, to become a scientist.

Bacon’s insights also revealed an important hidden truth: the discovery process is inherently algorithmic. It is the outcome of a finite number of steps that are repeated until a meaningful result is uncovered. Bacon explicitly used the word ‘machine’ in describing his method. His scientific algorithm has three essential components:

  • First, observations have to be collected and integrated into the total corpus of knowledge.
  • Second, the new observations are used to generate new hypotheses.
  • Third, the hypotheses are tested through carefully designed experiments.

If science is algorithmic, then it must have the potential for automation. This futuristic dream has eluded information and computer scientists for decades, in large part because the three main steps of scientific discovery occupy different planes. Observation is sensual; hypothesis-generation is mental; and experimentation is mechanical. Automating the scientific process will require the effective incorporation of machines in each step, and in all three feeding into each other without friction. Nobody has yet figured out how to do that.

Experimentation has seen the most substantial recent progress. For example, the pharmaceutical industry commonly uses automated high-throughput platforms for drug design.

Automated hypothesis-generation is less advanced, but the work of Don Swanson in the 1980s provided an important step forward. He demonstrated the existence of hidden links between unrelated ideas in the scientific literature; using a simple deductive logical framework, he could connect papers from various fields with no citation overlap. In this way, Swanson was able to hypothesise a novel link between dietary fish oil and Reynaud’s Syndrome without conducting any experiments or being an expert in either field.

The most challenging step in the automation process is how to collect reliable scientific observations on a large scale. There is currently no central data bank that holds humanity’s total scientific knowledge on an observational level. Natural language-processing has advanced to the point at which it can automatically extract not only relationships but also context from scientific papers. However, major scientific publishers have placed severe restrictions on text-mining. More important, the text of papers is biased towards the scientist’s interpretations (or misconceptions), and it contains synthesised complex concepts and methodologies that are difficult to extract and quantify.

Summary

Nevertheless, recent advances in computing and networked databases make the Baconian method practical for the first time in history. And even before scientific discovery can be automated, embracing Bacon’s approach could prove valuable at a time when pure reductionism is reaching the edge of its usefulness.

Such an approach would enable us to generate novel hypotheses that have higher chances of turning out to be true, to test those hypotheses, and to fill gaps in our knowledge. It would also provide a much-needed reminder of what science is supposed to be: truth-seeking, anti-authoritarian, and limitlessly free.


KISS for Climate Marchers

Keeping it simple, here’s the elevator speech for climate marchers, excerpted from a more lengthy article linked below.

Expect more craziness this weekend. Earth Day is Saturday. This year’s theme: Government must “do more” about climate change because “consequences of inaction are too high to risk.”

They make it sound so simple:

1) Man causes global warming.

2) Warming is obviously harmful.

3) Government can stop it.

Each claim is dubious or wrong.

1) Man’s greenhouse gases contribute to warming, but scientists don’t agree on how much. Of 117 climate models from the 1990s, 114 overpredicted warming.

2) Warming is harmful. Maybe.

But so far it’s been good: Over the last century, climates warmed, but climate-related deaths dropped. Since 1933, they fell by 98 percent. Life expectancy doubled.

Much of that is thanks to prosperity created by free markets. But some is due to warming. Cold kills more people than heat.

Carbon dioxide is also good for crop growth. Even The New York Times admits, “Plants have been growing at a rate far faster than at any other time in the last 54,000 years.”

3) Nothing we do today will stop global warming. The Obama regulations that Trump recently repealed, horrifying the Earth Day crowd, had a goal that amounted to a mere 1 percent reduction in global CO2. And that was just the goal.

Of course, some think any cut is better than nothing. But cuts are costly. They kill jobs, opportunity. All to accomplish… nothing the earth will notice.

If warming does become a problem, we’re better off if our economy is very strong when the science tells us clearly that action will make a difference.

We should be especially wary of expensive government projects given how often alarmists were wrong in the past.

The alarmists claim they’re marching for “science,” but they’re really marching for a left-wing religion.  Instead we should celebrate human progress and our ability to use energy to improve everyone’s quality of life.

Excerpts from Earth Day Dopes By John Stossel April 19, 2017

Background info: Data, Facts and Information


Barents Icicles 2017

A chart of Barents Ice Cycles looks a lot like the icicles above, except upside down since Barents Sea is usually all water by September. Notice the black lines in the graph below hitting bottom near zero.

Note also the anomalies in red are flat until 1998, then decline to 2007 and then flat again.

Why Barents Sea Ice Matters

Barents Sea is located at the gateway between the Arctic and North Atlantic. Previous posts (here and here) have discussed research suggesting that changes in Barents Sea Ice may signal changes in Arctic Sea Ice a few years later. As well, the studies point to changes in heat transport from the North Atlantic driving the Barents Sea Ice, along with changes in salinity of the upper layer. And, as suggested by Zakharov (here), there are associated changes in atmospheric circulations, such as the NAO (North Atlantic Oscillation).

Here we look at MASIE over the last decade and other datasets over longer terms in search for such patterns.

Observed Barents Sea Ice

Below is a more detailed look at 2017 compared with recent years.

This graph shows over the last 11 years, on average Barents sea ice starts declining beginning with April and melts out almost completely in September before recovering.  Some years, like 2014, the decline started much later and stopped with 100k km2 of ice persisting, resulting in the highest annual extent in the last decade.   Last year, 2016, was the opposite anomaly with much less ice than average all year.  2007 had the least Arctic ice overall in the last decade and was close to average in Barents during the summer months.

Note how exceptional is 2017 Barents ice extent.  It began extremely low in January and grew sharply to reach average by February, then dipped in March before rising strongly again in April.  It remains to be seen how much ice will grow, how late and how much will melt this year.


North Atlantic Meteorology in 2017

From AER comes more evidence of cooling in the North Atlantic and favorable conditions for ice formation there.

Dr. Judah Cohen provides his latest Arctic Oscillation and Polar Vortex Analysis and Forecast
on April 21, 2017.

  • Currently pressure/geopotential height anomalies are mostly positive on the North Pacific side of the Arctic but mostly negative across the North Atlantic side of the Arctic with mostly negative pressure/geopotential height anomalies across the mid-latitude ocean basins. This is resulting in a negative Arctic Oscillation (AO) but a positive North Atlantic Oscillation (NAO).
  • Despite the positive NAO, temperatures are below normal across western Eurasia including much of Europe as a strong block/high pressure has developed in the eastern North Atlantic with a cold, northerly flow downstream of the block across Europe.
  • The blocking high in the eastern North Atlantic is predicted to drift northward contributing to a negative bias to the AO and eventually the NAO over the next two weeks. Therefore, the pattern of cool temperatures across western Eurasia including Europe looks to continue into the foreseeable future.

Background on Barents from the Previous Post

Annual average BSIE (Barents Sea Ice Extent) is 315k km2, varying between 250k and 400k over the last ten years. The volatility is impressive, considering the daily Maximums and Minimums in the record. Average Max is 781k, ranging from 608k to 936k. Max occurs on day 77 (average) with a range from day 36 to 103. Average Min is 11k on day 244, ranging from 0k to 77k, and from days 210 to 278.

In fact, over this decade, there are not many average years. Five times BSIE melted to zero, two were about average, and 3 years much higher: 2006-7 were 2 and 3 times average, and 2014 was 7 times higher at 77k.

As for Maxes, only 1 year matched the 781k average. Four low years peaked at about 740k (2006,07,08 and 14), and the lowest year at 608k (2012). The four higher years start with the highest one, 936k in 2010, and include 2011, 13, and 15.

Comparing Barents Ice and NAO
Barents Masierev

This graph confirms that Barents winter extents (JFMA) correlate strongly (0.73) with annual Barents extents. And there is a slightly less strong inverse correlation with NAO index (-0.64). That means winter NAO in its negative phase is associated with larger ice extents, and vice-versa.

Comparing Barents Ice and Arctic Annual

Barents and Arctic

Arctic Annual extents correlate with Barents Annuals at a moderately strong 0.46, but have only weaker associations with winter NAO or Barents winter averages. It appears that 2012 and 2015 interrupted a pattern of slowly rising extents.

NAO and Arctic Ice Longer Term

Fortunately there are sources providing an history of Arctic ice longer term and overlapping with the satellite era. For example:

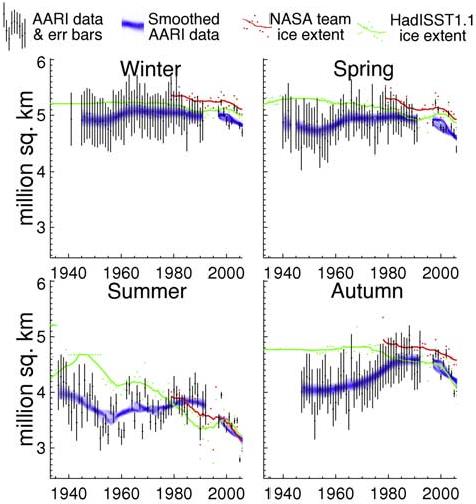
Observed sea ice extent in the Russian Arctic, 1933–2006 Andrew R. Mahoney et al (2008)
http://seaice.alaska.edu/gi/publications/mahoney/Mahoney_2008_JGR_20thC_RSI.pdf

Russian Arctic Sea Ice to 2006

Mahoney et al say this about Arctic Ice oscillations:

We can therefore broadly divide the ice chart record into three periods. Period A, extending from the beginning of the record until the mid-1950s, was a period of declining summer sea ice extent over the whole Russian Arctic, though not consistently in every individual sea. . . Period B extended from the mid-1950s to the mid- 1980s and was a period of generally increasing or stable summer sea ice extent. For the Russian Arctic as a whole, this constituted a partial recovery of the sea ice lost during period A, though this is not the case in all seas. . . Period C began in the mid-1980s and continued to the end of the record (2006). It is characterized by a decrease in total and MY sea ice extent in all seas and seasons.

Comparing Arctic Ice with winter NAO index

The standardized seasonal mean NAO index during cold season (blue line) is constructed by averaging the monthly NAO index for January, February and March for each year. The black line denotes the standardized five-year running mean of the index. Both curves are standardized using 1950-2000 base period statistics.

The graph shows roughly a 60 year cycle, with a negative phase 1950-1980 and positive 1980 to 2010. As described above, Arctic ice extent grew up to 1979, the year satellite ice sensing started, and declined until 2007. The surprising NAO uptick recently coincides with the anomalous 2012 and 2015 meltings.

As of January 2016 NAO went negative for the first time in months.  There appears to be some technical difficulties with more recent readings.

Summary

If the Barents ice cycle repeats itself over the next decades, we should expect Arctic ice extents to grow as part of a natural oscillation. The NAO atmospheric circulation pattern is part of an ocean-ice-atmosphere system which is driven primarily by winter changes in the North Atlantic upper water layer.

Self-Oscillating Sea Ice System

Self-Oscillating Sea Ice System  See here.


Data, Facts and Information


In following many blogs related to climate science, it seems that confusion reigns regarding some fundamentals of scientific thought and practice. So this post attempts to clarify three important scientific concepts: Data, Facts, and Information.

Show Me the Data

Data pertains to observations of happenings in the world, independent of the observer. In a court of law, a witness on the stand gives his or her observations. For example, I heard person x say this, or I saw person y do that. This is evidence all right, but it is not data.  And an artist or filmmaker can capture an event as evidence, but again it is not data in that format.

By definition, data is quantitative. And applying numbers to observations means using standard measurements so that these observations can be compared, contrasted, and replicated, as well as compiled with other similar observations. Each subject of study has one or more units of measurement pertinent to that inquiry. For example, observing a moving object requires distance and time, such as kilometers per minute, or rates of acceleration, such as meters per second per second, or m/s^2.

To summarize, data are a set of observations expressed in standard units of measurement.

What are the Facts

Taiichi Ohno was the central thinker behind the Toyota way of manufacturing. In his view facts are observed “in situ” by a knowledgeable and purposeful agent, an human expert. Facts are the result of direct observation of a process, product or part, including any measured data and the correct context for such data. Context means what relevant conditions, incidents, phenomena, and situations were occurring prior, during and after the data were collected.

In science a fact is a pattern detected in a data set. Thus, a fact is a finding, a meaning supported by data. And, importantly, a fact is particular to the place and time where the data was obtained. The pattern and meaning derives from interpreting the data (observations) in the specific place and time where the happenings occurred understanding the historical situation and context.

We hear a lot these days about fake news or facts in relation to political or cultural news. There, the spin and narratives overwhelm objective observations, and the report serves only to motivate audience acceptance or rejection of the subjects, the truth is irrelevant.  Unfortunately, fact “checking” has morphed into substituting one spin for another.

In science, facts are supported by data, but each fact represents a pattern in the data seen in the context of a specific place and time. So, for example, it can be a fact that civilian deaths in Syria have increased by x% in the past year. Importantly, facts depend on persons with deep knowledge of the particular place and time.

To summarize, a scientific fact is a pattern in data in the context of a specific place and time.

The Whole Truth and Nothing But the Truth

Information stands on facts, which themselves stand on data. Information consists of conclusions from weighing and judging the importance of various sets of facts regarding a situation. Based on the above, all the facts have a basis in data, but they are not equally significant. And the significance is relative to the concerns of the information analyst.

Information is not absolute, but serves to inform action. Facts are value-free, but information is not. Information draws on facts to form a conclusion as to the direction a situation is moving, out of a concern to intervene or not, according to the interests of the observers. In that sense, information is always actionable, or intends to be so.

As an example of this facet of information, consider media charges that someone is citing “alternate facts.” Now a fact is always true, meaning it is supported by data and corresponds to reality. Or it is not a fact, but a fiction not supported by data and in contradiction to reality.

In legal proceedings, frequently there are “alternate facts.” One party, say the prosecution, presents a set of facts comprising all the information supporting their explanation or theory of a criminal event. The defense presents an alternative explanation or theory of the event supported by other facts either ignored or discounted in the prosecution’s case. Such “alternate facts” are no less true, they simply form an alternate information convincing to those who place more weight on them.

A similar process goes on in scientific disputes where each side accuses the other of “cherry-picking” by referring only to those facts which support one theory. Honest science attempts to explain all relevant facts, and sometimes (e.g. Wave vs. Particle theories of light) holds competing theories in tension while a more comprehensive meta-theory can be formed and proved.

Information results from organizing data and facts into a perspective respecting the context of the facts and supporting humans’ need to anticipate the future. Forming theories of what to expect and how to respond or intervene is fundamental to human survival.

That’s the way I see it.

For a great example of how deep knowledge applied to data leads to a productive theory and discovery see Quebec Teen Studies Stars, Discovers Ancient Maya City

Fun Footnote:

Science depends on measuring things, so you need to know the correct units for what you are studying.

Below are some obscure measures for collecting data in special situations.

17. Quantity of beauty required to launch a single ship = 1 millihelen h/t vuurklip

Glaciermania

A stream flows through the toe of Kaskawulsh Glacier in Yukon’s Kluane National Park. In 2016, this channel allowed the glacier’s meltwater to drain in a different direction than normal, resulting in the Slims River’s water being rerouted to a different river system..

The Weather Network (who do a decent job on local weather forecasting) are currently raving about Glaciers:

You know climate change is getting serious when rivers are resorting to piracy.

Canadian geomorphologist Dr. Daniel Shugar and his team headed to the Yukon last year to study changes in the flow of the Slims River, only to find out the river was gone.

The Slims, which was fed by the Kaskawulsh glacier, has become the victim of the first case of what’s known as river piracy in modern recorded history.

The team’s investigation soon turned up the culprit – the retreat of the Kaskawulsh Glacier, which has been retreating thanks to more than a century of climate warming.

What Actually Happened

Prior to May of last year, the glacier had been supplying water to two watersheds and feeding multiple rivers; the Kaskawulsh River, which drains to the Pacific Ocean via the Alsek River, and the Slims, which flowed north to the Bering Sea via Kluane Lake.

During the last days of May 2016, melt water at the base of the glacier finally managed to eat through the thinning ice sheet, opening a new canyon and sending the Slims’ share of the water into the Kaskawulsh instead.

Thanks to this abrupt change, water from the glacier that used to flow north to the Bering Sea has changed direction and flows toward the Pacific, instead, leaving the Slims basin high and (mostly) dry.

And Now, the Leap of Faith

In the published paper lead author Daniel Shugar goes on to state:
Based on satellite image analysis and a signal-to-noise ratio as a metric of glacier retreat, we conclude that this instance of river piracy was due to post-industrial climate change.

And others can’t resist piling on:

“To me, it’s kind of a metaphor for what can happen with sudden change induced by climate,” said John Clague, who holds a chair in natural hazard research at Simon Fraser University and was a co-author on the report.

“Climate change is happening, is affecting us and it’s not just about far-off islands in the South Pacific. .  Climate change may bring new changes that we’re not even really thinking about.” said Shugar.

It’s a nice PR touch to call this “Piracy”, but they are “jumping the shark” by claiming humans did this by burning fossil fuels.

“Jumping the shark” is attempting to draw attention to or create publicity for something that is perceived as not warranting the attention, especially something that is believed to be past its peak in quality or relevance. The phrase originated with the TV series “Happy Days” when an episode had Fonzie doing a water ski jump over a shark. The stunt was intended to perk up the ratings, but it marked the show’s low point ahead of its demise.

Hyping a Glacier retreating to prove global warming/climate change looks to be a similarly desperate move. Most people sense that the dynamics of glaciers growing, shrinking and moving is much more complex than simply fingering CO2 as the culprit.
south-glacier-as-seen-during-its-1986-surge-photo-p-johnson-and-in-2005-photo-g

FIG. 3. South Glacier as seen during its 1986 surge (photo: P. Johnson) and in 2005 (photo: G. Flowers). To facilitate comparison, the black line in each photograph marks the same feature.

For context and scientific perspective we can turn to papers like this one:  Contemporary Glacier Processes and Global Change: Recent Observations from Kaskawulsh Glacier and the Donjek Range, St. Elias Mountains From the Abstract:

The scientific objectives of these projects are (1) to quantify recent area and volume changes of Kaskawulsh Glacier and place them in historical perspective, (2) to investigate the regional variability of glacier response to climate and the modulating inuence of ice dynamics, and (3) to characterize the hydromechanical controls on glacier sliding.
the-donjek-range-and-environs-geobase-r-image-8-september-2008-within-the-st-elias

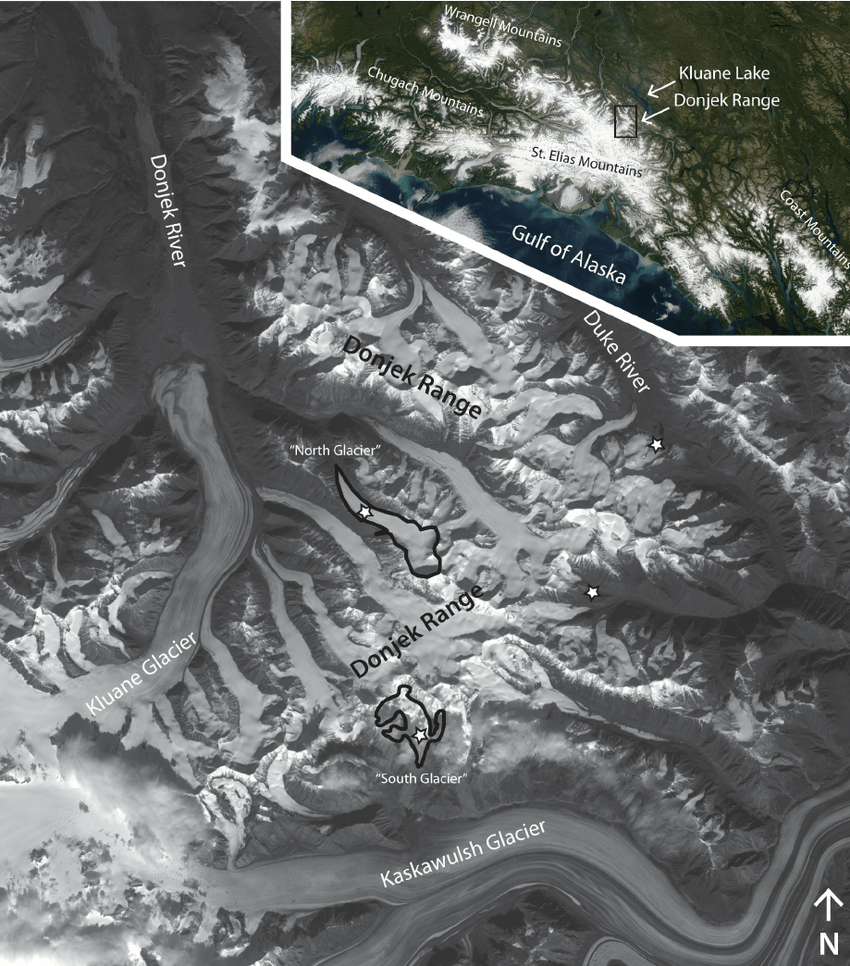
FIG. 1. The Donjek Range and environs (Geobase ® image, 8 September 2008) within the St. Elias Mountains (NASA Aqua – MODIS image, 9 August 2003; North and South Glaciers are outlined, and locations of automatic weather stations operated since 2006 – 07 are marked with stars.

Excerpts (bolded text is my emphasis)

Kaskawulsh Glacier is ~70 km long from its shared accumulation area with the upper Hubbard Glacier, at an elevation of ~2500 m asl, to its terminus ~25 km southwest of the Kluane Lake Research Station, at ~820 m asl (Fig. 1). It provides the source of the Slims River, the primary water input for Kluane Lake to the northeast (which drains to the Bering Sea), and the source of the Kaskawulsh River to the southeast (which drains to the Gulf of Alaska).

One of the most iconic and best studied outlet glaciers of the St. Elias Mountains, Kaskawulsh Glacier was the focus of much glaciological research during the Icefield Ranges Research Project between the 1960s and early 1970s  and contemporary studies suggest that the glacier is temperate throughout. The current area of Kaskawulsh Glacier is ~1095 km2. Ice thicknesses range from 539 m near the topographic divide with the upper Hubbard Glacier and ~500 m at the confluence of the north and central arms at ~1750 m asl to 778 m at ~1600 m asl. The equilibrium line altitude is estimated from 2007 late summer satellite imagery as 1958 m asl, and it appears to have changed little since the 1970s.

The size of Kaskawulsh Glacier has varied considerably through time, with radiocarbon dating suggesting that it expanded by tens of kilometres into the Shakwak Valley (currently occupied by Kluane Lake) ~30 kya during the Wisconsinan Glaciation. In the historical past, Borns and Goldthwait (1966) mapped three sets of Little Ice Age moraines in the glacier forefield on the basis of distinctive variations in vegetation cover, morphology, and the ages of trees and shrubs.

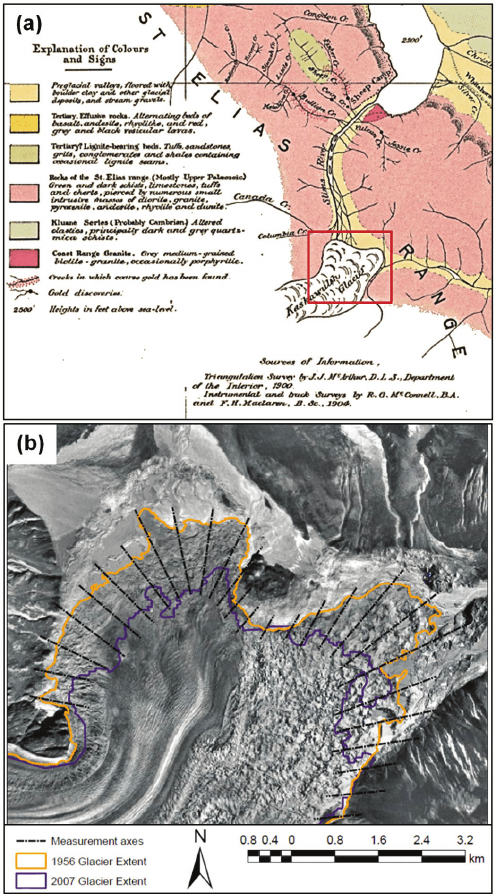
Kaskawulsh Glacier was advancing by the early 1500s and reached its maximum recent position by approximately AD 1680. A recent study based on tree-ring dates suggests that the Slims River lobe reached its greatest Little Ice Age extent in the mid-1750s, whereas the Kaskawulsh River lobe reached its maximum extent around 1717. However, it appears that the glacier did not start retreating from this position until the early to middle 1800s. The recent discovery of a Geological Survey of Canada map of the glacier terminus from 1900 to 1904 indicates that the glacier was still in a forward position at that time, suggesting that most of the terminus retreat occurred in the 20th century.

Recent studies conducted by researchers at the University of Alaska and the University of Ottawa indicate that ice losses from Kaskawulsh Glacier have continued through the latter half of the 20th century and first decade of the 21st century, although evidence for any recent acceleration in loss rates is equivocal.

Global Context

Of the 19 glacierized regions of the world outside of the ice sheets, the region including the St. Elias Mountains made the second highest glaciological contribution to global sea level during the period 1961 – 2000. Only Arctic Canada is expected to exceed this region in sea-level contribution over the 21st century.

The St. Elias Mountains exhibit high interannual variability in ice mass change, which is due in part to the abundance of surge-type and tidewater glaciers in different stages of their respective cycles. Ice dynamics can be a confounding influence when attempting to isolate the effects of climate as an external driver of glacier change. For example, a surge-type glacier in the “quiescent” phase of its cycle may retreat even in a stationary climate. Catastrophic retreat of a tidewater glacier may be triggered by climate, but it is largely controlled by glacier and fjord geometry. Similar “flow instabilities” exist at larger scales in the form of ice streams and marine ice-sheets or outlet glaciers, the dynamics of which dominate the mass balances (and therefore sea-level contributions) of large sectors of the modern ice sheets. Our ability to project future changes on short (sub-decadal to decadal) timescales therefore hinges on our understanding of internal glacier dynamics, as well as our ability to project future climate in a given region and relate climate to glacier surface mass balance.

The ice-walled canyon at the terminus of the Kaskawulsh River in the Yukon, with recently collapsed ice blocks, that now carries the vast majority of glacier-front water down the Kaskawulsh Valley toward the Gulf of Alaska and the Pacific Ocean instead of north along the Slims River toward the Bering Sea. (Jim Best/University of Illinois)

Whether climate has fundamentally altered the surging styles of Trapridge Glacier and South Glacier from the faster, shorter, more recognizable Alaskan style to the slower and more subtle Svalbard style is an interesting question. Many small poly-thermal glaciers, whose temperate ice content is largely controlled by meltwater entrapment and refreezing in the accumulation area, are expected to become colder under negative mass balance conditions. It is therefore conceivable that thermal evolution over the course of decades can play a role in altering surge style. However, there is some evidence that both types of surges may be preceded by a prolonged—and until recently, unrecognized—period of acceleration. Thus, a “slow surge” or “partial surge” may simply represent a truncation of the ordinary surge cycle that results from a deficit of mass, rather than a fundamental change in surge character. Mass deficits have manifested themselves differently on the well-studied and temperate Variegated Glacier, where the return interval between surges adapts itself in such a way that surges are triggered at a constant cumulative balance threshold. The nature and timing of future surges of the large glaciers in the St. Elias Mountains will be instructive as we seek a more coherent understanding of the influence of climate on surging.

Summary

So it is a familiar story. A complex naturally fluctuating situation, in this case glaciers, is abused by activists to claim support for their agenda. I have a lot of respect for glaciologists; it is a deep, complex subject, and the field work is incredibly challenging. And since “glacial” describes any process where any movement is imperceptible, I can understand their excitement over something happening all of a sudden.

But I do not applaud those pandering to the global warming/climate change crowd. They seem not to realize they debase their own field of study by making exaggerated claims and by “jumping the shark.”
The lead authur, Shugar, sounds like a Michael Mann wannabe, putting out sound bites to please the naive journalists. Maybe he thinks there is a Nobel prize in it if he plays his cards right.

Meanwhile real scientists are doing the heavy lifting and showing restraint and wisdom about the limitations of their knowledge.

The Kaskawulsh River, as it exits the lower terminus of Kaskawulsh Glacier and lakes. ‘ JIM BEST