Biodiversity Unwisely Aims to be Eden

More realistic is to take on Noah’s responsibility selecting species to survive on the ark.

Ronald Bailey’s article at Reason is The Myth of Wild Nature and Creating a New Form of Paradise.  Excerpts in italics with my bolds and added images.

A review of the new book Tickets For The Ark, by Rebecca Nesbit

Earlier this month, a “landmark U.N. biodiversity agreement” was adopted by delegates from 190 countries at the Fifteenth Conference of Parties (COP15) of the U.N. Convention on Biological Diversity in Montreal. The chief goal of the new Global Biodiversity Framework (GBF) is that “the integrity, connectivity and resilience of all ecosystems are maintained, enhanced, or restored, substantially increasing the area of natural ecosystems by 2050.” The GBF asserts that around 25 percent of assessed plant and animal species are threatened, suggesting that around 1 million species may already face eventual extinction unless action is taken.

The GBF specifies that by 2030, 30 percent of Earth’s lands, oceans, coastal areas, and inland waters are “effectively conserved” and that restoration be completed or underway on at least 30 percent of degraded terrestrial, inland waters, and coastal and marine ecosystems. Currently, 17 percent and 10 percent of the world’s terrestrial and marine areas respectively are under protection. In addition, the GBF aims to reduce annual subsidies harmful to biodiversity (e.g., biofuels, fisheries, fossil fuels) by $500 billion; and to cut food waste in half by 2030.

Ecologist Rebecca Nesbit in her new book, Tickets For The Ark: From Wasps to Whales – How Do We Choose What To Save?, launches a sustained frontal attack on the “myth of wild nature.”

Nesbit hammers home the absolutely correct point that there is no objective scientific standard providing some kind of value-neutral ecological baseline toward which conservation should aim. Since there is no goal or end state toward which any particular ecosystem is heading, who is to say that landscapes and ecosystems modified by human activities are somehow inferior?

“Ideas about pristine nature invoke a state that nature was in before humans affected it,” Nesbit notes. “The trouble is that humans have played a role in shaping nature for roughly 2.5 million years.” She explains that species and ecosystems do not have intrinsic value. Instead, humans confer value on them. This realization “should be liberating,” she argues, because it makes us “free to discuss logically what we should save and why, and not just fight an anti-extinction battle that is doomed to failure.” Nesbit notes that “The resources we dedicate to conservation will never be enough to prevent all extinctions, and we are forced to choose our priorities.” As she makes plain, it’s tradeoffs all of the way down.

Consequently, her goal isn’t to tell readers how we should choose what to save. Instead, she provides a series of case studies showing that human choices guided by our ethical and aesthetic values are inevitable regarding biological conservation.

Let’s take a look at a few of the conservation tradeoffs that Nesbit highlights. For example, due to centuries of sheep grazing, the prehistoric birch forests that once covered Norway’s craggy mountains have been replaced by meadows. Many Norwegians prefer the hiking and skiing opportunities and magnificent views made possible by sheep meadows to dense birch forests. “This recent baseline for what the natural world should look like has no more moral relevance than a prehistoric baseline, yet it is the form of nature that Norway now aspires to protect,” she notes.

Another example is the effort to preserve the flightless brown and white striped Guam rail. That bird was driven to near extinction by introducing brown tree snakes to the island, which ate its chicks and eggs. In 1987, the 22 remaining rails were put in a captive breeding facility. The good news is that rails from the captive breeding project have now been released on snake-free islands near Guam where they have established self-sustaining populations.

Nesbit, however, asked the biologists overseeing rail conservation what happened to the Guam rail louse that lived only on that species. As standard practice, the conservationists had cleared the captured birds of their parasites, thus bringing about the extinction of that parasitic insect. Is the rail more valuable than the louse? And who says so? Conservationists cannot avoid such questions as they choose among species to try to save some from extinction.

Conflicts of values are inherent in conservation.

“The people who benefit from wildlife protection are seldom the ones who pay the price,” Nesbit observes. “Different people and wildlife benefit from different management, so inevitably there will be opposing outlooks. But it’s an advance if, at least, we recognize that there is no historic baseline to aspire towards.” She illustrates how opposing outlooks played out in with the case of seals versus salmon in Scotland’s Moray Firth.

Seals compete with local fishers for the salmon, so fishers were licensed by the Scottish government to kill seals. On the other hand, tour operators argued for protecting the seals that thousands of visitors came to see in the wild. While no one side was entirely happy, a series of stakeholder discussions led to an agreement in which fishers could cull “rogue” seals.

“Dispensing with the idea that there is an objective ‘natural’ state of nature opens up huge possibilities for what conservation can achieve,” she argues.

Among the possibilities is using biotechnology to install a blight-resistant wheat gene in American chestnuts. Literally, billions of these forest giants succumbed to an introduced fungus in the 20th century. The new blight-resistant trees could be restored to their native range in the Appalachian Mountains. Even more ambitiously, biotechnology could combine the recently decoded genetics of extinct wooly mammoths with those of Asian elephants to restore them to the Arctic.

Also, Nesbit urges us to free “ourselves from the shackle of believing that species ‘belong’ only in their past ranges” so that we can “open up possibilities for assisted colonizations.” Conservationists could move creatures threatened with extinction in their home ranges to others where they would be protected and allowed to thrive. For example, Nesbit notes that Chinese water deer are declining in their native Asian range but are expanding in various parts of Europe.

Nesbit also stands firmly against eco-colonialism.

The GBF’s goal of protecting 30 percent of the world’s landscapes and seascapes must not become instances of what Nesbit calls “fortress conservation,” in which local people are banished from their lands and livelihoods. “With Indigenous lands representing about a quarter of the Earth’s land surface, there is huge potential for synergy between wildlife conservation and upholding Indigenous rights,” argues Nesbit. She cites a recent World Bank study that found community-managed forests are more effective at reducing deforestation than strictly protected areas. Hopefully, the signatories to the GBF will uphold its commitments toward “recognizing and respecting the rights of indigenous peoples and local communities, including over their traditional territories.”

Nesbit concludes, “Now that we have shaken off the idea of an unobtainable ‘pure’ nature, we can embrace the possibilities that come from celebrating nature in its many forms. We’re not doomed to simply mourn a paradise lost, we’re free to create a new form of paradise.” Let’s get at it.

See also Extinction Hype and Dubious Biodiversity COP15 in Montreal

Source: Phanerozoic_Biodiversity.png Author: SVG version by Albert Mestre

Footnote: A Sample of Math Humor

After Noah sent out the dove that returned, and landed the ark, he released the animals two by two and told them: “Go forth and multiply.”  Noah checked on the progress of the various species, and discovered that two snakes had not reproduced.  When confronted, the snakes responded:  “We can’t multiply.  We’re adders.”

Noah pondered the dilemma, then went to cut trees in the forest.  After building a table with the wood, he again addressed the snakes.  ”  You no longer have an excuse.  Even adders can multiply on a log table.”

LOL

Climatists Aim Forks at Our Food Supply

It’s not enough to apply Chinese-style lockdowns in the name of “fighting climate change.”  Now climatists want to stick forks in our food supply, thereby reducing populations to a more “sustainable” number.  The attack on world food supply has four prongs to it, just like the forks in the image above.

1.  Exaggerate the Minor Climate Impact of Methane (CH4)

2.  Oppose Methane from Livestock as a Fossil Fuel, like Coal and Oil.

3. Freak Out over N2O as an Excuse to Ban Fertilizers

4.  Meat Shame People’s Diets Because Vegans Love Animals

Background:  The Carbon Cycle is Natural

This diagram of the fast carbon cycle shows the movement of carbon between land, atmosphere, and oceans in billions of tons per year. Yellow numbers are natural fluxes, red are human contributions, white indicate stored carbon.

Instead of delusions about CO2 as the planet’s climate “control knob”, Viv Forbes provides us a wise, sane view how the carbon cycle works, and what we know and don’t know about it. And rather than exaggerate the effects of humans recycling fossil fuels, he puts the carbon cycling sources and sinks into a sensible perspective. His recent article is entitled: Carbon Delusions and Limited Models

The IPCC models misread the positive and negative temperature feedbacks from water vapour (the main greenhouse gas) and their accounting for natural processes in the carbon cycle is based on very incomplete knowledge and numerous unproven assumptions.

The dreaded “greenhouse gases” (carbon dioxide and methane) are natural gases. Man did not create them — they occur naturally in comets and planets, and have been far more plentiful in previous atmospheres on Earth. They are abundant in the oceans and the atmosphere, and are buried in deposits of gas, oil, coal, shale, methane clathrates and vast beds of limestone. Land and sea plants absorb CO2 and micro-organisms absorb methane in the deep ocean.

Earth emits natural carbon-bearing gases in huge and largely unknown and unpredictable quantities. Carbon dioxide, carbon monoxide and various hydrocarbons such as ethane, methane and propane bubble out of the ocean floor, seep out of swamps, bubble naturally out of rivers, are released in oil seeps, water wells and bores, and are sometimes delivered via water pipes into drinking water. They are also released whenever carbon-bearing rocks such as coal and shale are eroded naturally, catch fire or are disturbed by earthquakes, construction activities or mining. The vast offshore deposits of frozen methane are released naturally when geothermal heat or volcanic intrusions melt the ice containing the methane.

The Minor Climate Impact of Methane (CH4)

Methane  
Natural gas is 75% Methane (CH4) which burns cleanly to carbon dioxide and water. Methane is eagerly sought after as fuel for electric power plants because of its ease of transport and because it produces the least carbon dioxide for the most power. Also cars can be powered with compressed natural gas (CNG) for short distances.

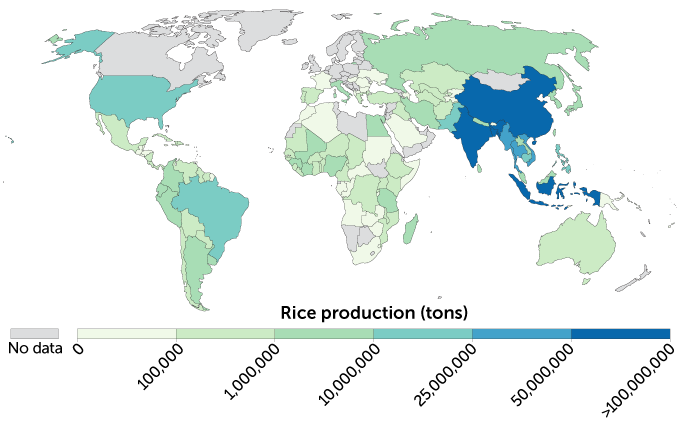
In many countries CNG has been widely distributed as the main home heating fuel. As a consequence, in the past methane has leaked to the atmosphere in large quantities, now firmly controlled. Grazing animals also produce methane in their complicated stomachs and methane escapes from rice paddies and peat bogs like the Siberian permafrost.

It is thought that methane is a very potent greenhouse gas because it absorbs some infrared wavelengths 7 times more effectively than CO2, molecule for molecule, and by weight even 20 times. As we have seen previously, this also means that within a distance of metres, its effect has saturated, and further transmission of heat occurs by convection and conduction rather than by radiation.

Note that when H20 is present in the lower troposphere, there are few photons left for CH4 to absorb:

Even if the IPCC radiative greenhouse theory were true, methane occurs only in minute quantities in air, 1.8ppm versus CO2 of 390ppm. By weight, CH4 is only 5.24Gt versus CO2 3140Gt (on this assumption). If it truly were twenty times more potent, it would amount to an equivalent of 105Gt CO2 or one thirtieth that of CO2. A doubling in methane would thus have no noticeable effect on world temperature.

However, the factor of 20 is entirely misleading because absorption is proportional to the number of molecules (=volume), so the factor of 7 (7.3) is correct and 20 is wrong. With this in mind, the perceived threat from methane becomes even less.

Further still, methane has been rising from 1.6ppm to 1.8ppm in 30 years (1980-2010), assuming that it has not stopped rising, this amounts to a doubling in 2-3 centuries. In other words, methane can never have any measurable effect on temperature, even if the IPCC radiative cooling theory were right.

Because only a small fraction in the rise of methane in air can be attributed to farm animals, it is ludicrous to worry about this aspect or to try to farm with smaller emissions of methane, or to tax it or to trade credits.

The fact that methane in air has been leveling off in the past two decades, even though we do not know why, implies that it plays absolutely no role as a greenhouse gas.  (From Sea Friends (here):

More information at The Methane Misconceptions by Dr. Wilson Flood (UK) here.

Give Daisy a Break!

Methane Risk from Livestock is Overstated

Frank M. Mitloehner is Professor of Animal Science and Air Quality Extension Specialist, University of California, Davis.  He writes at the Conversation Yes, eating meat affects the environment, but cows are not killing the climate.  Excerpts in italics with my bolds.

A key claim underlying these arguments holds that globally, meat production generates more greenhouse gases than the entire transportation sector. However, this claim is demonstrably wrong, as I will show. And its persistence has led to false assumptions about the linkage between meat and climate change.

My research focuses on ways in which animal agriculture affects air quality and climate change. In my view, there are many reasons for either choosing animal protein or opting for a vegetarian selection. However, foregoing meat and meat products is not the environmental panacea many would have us believe. And if taken to an extreme, it also could have harmful nutritional consequences.

Many people continue to think avoiding meat as infrequently as once a week will make a significant difference to the climate. But according to one recent study, even if Americans eliminated all animal protein from their diets, they would reduce U.S. greenhouse gas emissions by only 2.6 percent. According to our research at the University of California, Davis, if the practice of Meatless Monday were to be adopted by all Americans, we’d see a reduction of only 0.5 percent.

Moreover, technological, genetic and management changes that have taken place in U.S. agriculture over the past 70 years have made livestock production more efficient and less greenhouse gas-intensive. According to the FAO’s statistical database, total direct greenhouse gas emissions from U.S. livestock have declined 11.3 percent since 1961, while production of livestock meat has more than doubled.

Removing animals from U.S. agriculture would lower national greenhouse gas emissions to a small degree, but it would also make it harder to meet nutritional requirements. Many critics of animal agriculture are quick to point out that if farmers raised only plants, they could produce more pounds of food and more calories per person. But humans also need many essential micro- and macronutrients for good health.

The world population is currently projected to reach 9.8 billion people by 2050. Feeding this many people will raise immense challenges. Meat is more nutrient-dense per serving than vegetarian options, and ruminant animals largely thrive on feed that is not suitable for humans. Raising livestock also offers much-needed income for small-scale farmers in developing nations. Worldwide, livestock provides a livelihood for 1 billion people.

Climate change demands urgent attention, and the livestock industry has a large overall environmental footprint that affects air, water and land. These, combined with a rapidly rising world population, give us plenty of compelling reasons to continue to work for greater efficiencies in animal agriculture. I believe the place to start is with science-based facts.

N2O is No Excuse to Ban Fertilizers

Methane and Climate is a paper by W. A. van Wijngaarden (Department of Physics and Astronomy, York University, Canada) and W. Happer (Department of Physics, Princeton University, USA) published at CO2 Coalition November 22, 2019. It is a summary in advance of a more detailed publication to come. Excerpts in italics with my bolds. [Note the paper is a thorough and deep expert analysis of atmospheric radiation physics which I do not fully comprehend.  So the excerpts below are necessarily superficial, but intend to provide the core findings from these scientists.]

Figure 2: Left. A standard atmospheric temperature profile [9], T = T(z). The surface temperature is T(0)= 288.7 K. Right. Standard concentrations [10], Csd = Nsd /N for greenhouse molecules versus altitude z.  The total number density of atmospheric molecules is N and the number density of molecules of type i is Nsd. At sea level the concentrations are 7750 ppm of H2O, 1.8 ppm of CH4 and 0.32 ppm of N2O. The O3 concentration peaks at 7.8 ppm at an altitude of 35 km, and the CO2 concentration was approximated by 400 ppm at all altitudes. The data is based on experimental observations.

As shown in Fig. 2, the most abundant greenhouse gas at the surface is water vapor (H2O). However, the concentration of water vapor drops by a factor of a thousand or more between the surface and the tropopause. This is because of condensation of water vapor into clouds and eventual removal by precipitation.  Carbon dioxide CO2, the most abundant greenhouse gas after water vapor, is also the most uniformly mixed because of its chemical stability. Methane, the main topic of this discussion is much less abundant than CO2 and it has somewhat higher concentrations in the troposphere than in the stratosphere where it is oxidized by OH radicals and ozone, O3. The oxydation of methane [8] is the main source of the stratospheric water vapor shown in Fig. 2. 

Figure 9: Projected midlatitude forcing increments at the tropopause from continued increases of CO2 and CH4 at the rates of Fig. 7 and Fig. 8 for the next 50 years. The projected forcings are very small, especially for methane, compared to the current tropospheric forcing of 137 W m−2.

The paper is focused on the greenhouse effects of atmospheric methane, since there have recently been proposals to put harsh restrictions on any human activities that release methane. The basic radiation-transfer physics outlined in this paper gives no support to the idea that greenhouse gases like methane (CH4), carbon dioxide (CO2) or nitrous oxide (N2O) are contributing to a climate crisis. Given the huge benefits of more CO2 to agriculture, to forestry, and to primary photosynthetic productivity in general, more CO2 is almost certainly benefitting the world.  Radiative effects of CH4 and N2O are so small that they are irrelevant to climate.

The chart above informs on the scale of N2O concentrations. At first glance, it appears comparable to CO2, but on closer inspection the amounts are in ppb (parts per billion), not ppm (parts per million) as with CO2. To get comparable amounts requires dividing by 1000, thus the vertical axis goes from 0.315 ppm to 0.340 ppm. Yes, the dramatic rise over the last 22 years is 0.025ppm.

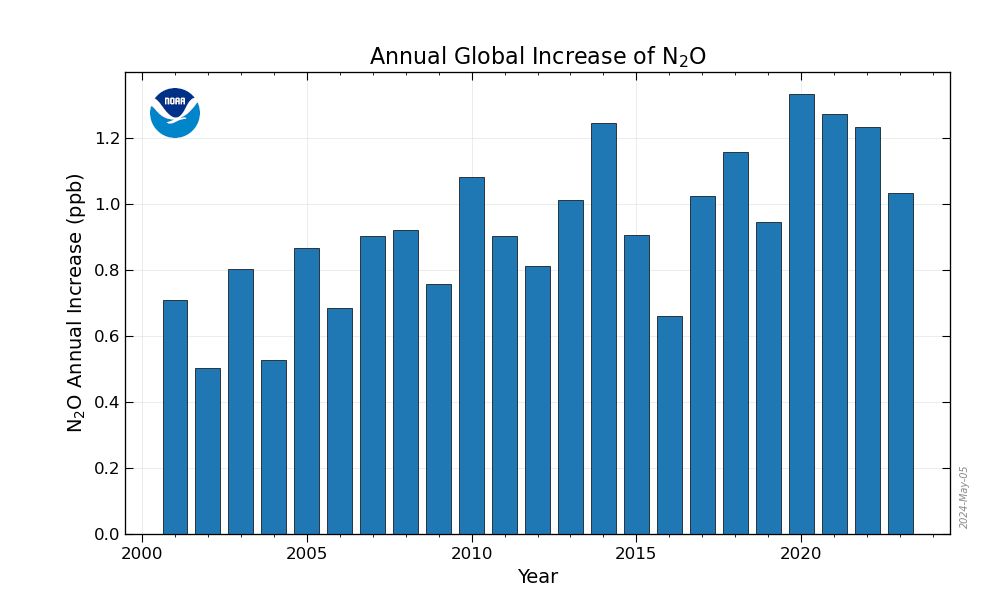
Then we have the annual global increase of N2O from all sources ranging from about 0.5 to 1.3 ppb. Does anyone believe they can measure N2O down to 0.0005 ppm?

 Vegans Pushing Their Anti-Meat Agenda

The origin of these alarms are studies published in Lancet, once highly reputed but recently given over to climate ideology rather than objective science. Most recently is Food in the Anthropocene: the EAT–Lancet Commission on healthy diets from sustainable food systems  The preceding Lancet study stated this main finding:

Following environmental objectives by replacing animal-source foods with plant-based ones was particularly effective in high-income countries for improving nutrient levels, lowering premature mortality (reduction of up to 12% [95% CI 10–13] with complete replacement), and reducing some environmental impacts, in particular greenhouse gas emissions (reductions of up to 84%). However, it also increased freshwater use (increases of up to 16%) and had little effectiveness in countries with low or moderate consumption of animal-source foods. (here).

Georgia Ede MD writes in Psychology Today EAT-Lancet’s Plant-based Planet: 10 Things You Need to Know. Excerpts in italics below with my bolds. Title is link to full text which is recommended reading.  Georgia Ede, MD, is a Harvard-trained psychiatrist and nutrition consultant practicing at Smith College. She writes about food and health on her website DiagnosisDiet.com.

We all want to be healthy, and we need a sustainable way to feed ourselves without destroying our environment. The well-being of our planet and its people are clearly in jeopardy, therefore clear, science-based, responsible guidance about how we should move forward together is most welcome.

Unfortunately, we are going to have to look elsewhere for solutions, because the EAT-Lancet Commission report fails to provide us with the clarity, transparency and responsible representation of the facts we need to place our trust in its authors. Instead, the Commission’s arguments are vague, inconsistent, unscientific, and downplay the serious risks to life and health posed by vegan diets.

To the best of my knowledge, there has never been a human clinical trial designed to test the health effects of simply removing animal foods from the diet, without making any other diet or lifestyle changes such as eliminating refined carbohydrates and other processed foods. Unless and until such research is conducted demonstrating clear benefits to this strategy, the assertion that human beings would be healthier without animal foods remains an untested hypothesis with clear risks to human life and health. Prescribing plant-based diets to the planet without including straightforward warnings of these risks and offering clear guidance as to how to minimize them is scientifically irresponsible and medically unethical, and therefore should not form the basis of public health recommendations.

Summary:

Natural Gas (75% methane) burns the cleanest with the least CO2 for the energy produced.

Leakage of methane is already addressed by efficiency improvements for its economic recovery, and will apparently be subject to even more regulations.

The atmosphere is a methane sink where the compound is oxidized through a series of reactions producing 1 CO2 and 2H20 after a few years.

GWP (Global Warming Potential) is CO2 equivalent heat trapping based on laboratory, not real world effects.

Any IR absorption by methane is limited by H2O absorbing in the same low energy LW bands.

There is no danger this century from natural or man-made methane emissions.

Conclusion

This is a bogus war on fertilizers, farmers and food. Everything is exaggerated for the sake of an extreme agenda to impose controls on free enterprise developed societies. It is true that use of fertilizers results in some release of N2O into the air, but even this has been overstated. And as the video demonstrates, farmers have a vested interest in using fertilizers wisely and are applying techniques that improve efficiency. As well, there is evidence of efficiency gains in the process of producing ammonia and then urea from air and natural gas. The attack on food supply is in effect an effort to reduce the population.

Resources

Much Ado About Methane

More Methane Madness

Washing Methane Away: Atmospheric Chemistry

Mastering Methane Mania

Let Them Eat Steak!

Climate Ideology = Bad Nutritional Advice

Carbon Sense and Nonsense


In Defense of Fertilizers, Farmers and Food

The UN and WEF have declared a War on Fertilizers with conflicts erupting in Sri Lanka, the Netherlands and Canada.  Fear of “greenhouse gases”  provide the moral justification for mandating reductions in the production and use of fertilizers.

This will in turn deprive many farmers of their way of life.  As a group, farmers belong to the “yeomanry” social class: independent, self-reliant small businessmen and women who don’t trust government and want it only to leave them alone.  This makes them (like truckers) public enemies no.1, according to the control freaks increasingly entrenched in public authorities.

Most important is the objective to take over and regulate the food supply, along with governmental direction of the energy sector.  The reason for this was well articulated by Leon Trotsky decades ago.

U.N. War On Fertilizer Began in Sri Lanka

Michael Shellenberger:  UN Environment Programme launched its anti-fertilizer efforts from Sri Lanka in 2019

The United Nations Environment Programme (UNEP) describes itself as “the global authority that sets the environmental agenda… and serves as an authoritative advocate for the global environment.” Through its “Economics of Ecosystems and Biodiversity for Agriculture and Food” program launched in 2014, the UNEP advocates that nations “steer away from the prevailing focus on per hectare productivity.”

But today the world is in its worst food crisis since 2008.

The number of people suffering acute food insecurity increased by 25% since January 2022 to 345 million, according to the United Nations World Food Programme. Why, then, is the UNEP trying to steer nations away from fertilizers that increase food production?

The UNEP’s Acting Director in 2019 said the reason was humankind’s “long-term interference with the Earth’s nitrogen balance.” In October of that year, the UNEP hosted a meeting in the capital of Sri Lanka, Colombo and issued a “road map” to push nations to cut nitrogen pollution in half.

But the Netherlands proves that nations can slash nitrogen pollution
from livestock by 70% while also increasing meat production. Same for crops.

Since the early 1960s, the Netherlands has doubled its yields while using the same amount of fertilizer. While rich nations produce 70 percent higher yields than poor nations, they use just 54 percent more nitrogen.

One month after the Colombo meeting in 2019, which generated significant media attention in Sri Lanka, voters in that nation elected an anti-fertilizer president, H.E. Gotabaya Rajapaksa, who claimed, without scientific evidence, that synthetic fertilizers were causing kidney diseases. In April 2021, he banned fertilizer imports.

In June, 2021, two months after the fertilizer ban, Sri Lanka hosted a UN-sponsored “Food System Dialogue” aimed at influencing the UN’s broader anti-fertilizer agenda for the world. “Sri Lanka’s inaugural Food System Dialogue is part of a series of national and provincial dialogues conducted by the Ministry of Agriculture ahead of the 2021 UN Food System Summit set to take place in New York later this year.”

Netherlands and Canada Invoke Nitrous Oxide (N2O) Hysteria

LifeSiteNews While the event went mostly unreported, a large group of Canadians formed a convoy late last month in Winnipeg, Manitoba to voice their support for Dutch farmers currently protesting their government’s fertilizer reduction policies.

In the footage, many of the vehicles can be seen donning the Netherlands flag, with some of the flags being flown upside-down, which is a practice done throughout the world as a way to signal distress.

One large tractor had a sign on it that read, “No fertilizers, No Farmers, No food,” while a pick-up truck had a sign reading, “Government is lying. Fight for freedom.”

As reported by LifeSiteNews, for the past month farmers in the Netherlands have been protesting the fertilizer reduction policies put forward by their World Economic Forum-linked Prime Minister, Mark Rutte.

Under the guise of “climate change,” Rutte and his government have created a “nitrogen and nature” ministry to curb nitrogen oxide and ammonia emissions in the country, and told farmers that failure to comply with the new policies would lead to an expropriation of their land.

According to the Dutch farmers, compliance with the policies would mean far smaller crop yields and insufficient food production – nitrogen and ammonia are integral ingredients in fertilizers – and would lead to a massive loss of income or having to sell their farms altogether.

Despite the pleas of thousands of farmers to have the implementation of the policies reconsidered, Rutte dismissed the group as “small” and “unacceptable,” echoing the statement made by Canadian Prime Minister Justin Trudeau earlier this year, when he called the anti-COVID mandate “Freedom Convoy” protesters in his country a “small, fringe minority.”

In addition to the similar attitude they express to disgruntled citizens, both politicians are members of the World Economic Forum, and have both signed their countries up for the United Nations 2030 Agenda for Sustainable Development.

In fact, a December 2020 press release from Canada’s Minister of Agriculture and Agri-Food shows that Trudeau has been planning to implement fertilizer policies similar to those being imposed by Rutte for quite some time.

However, nitrous oxide emissions, particularly those associated with synthetic nitrogen fertilizer use have also grown significantly. That is why the Government of Canada has set the national fertilizer emissions reduction target, which is part of the commitment to reduce total GHG emissions in Canada by 40-45% by 2030, as outlined in Canada’s Strengthened Climate Plan,” adds the release, which includes references to “the 2030 Agenda” and the U.N.’s “17 Sustainable Development Goals.”

The World of N2O

Just as CO2 is a small part of a planetary Carbon Cycle, so too is N2O an even smaller part of a global Nitrogen cycle.  Some charts below provide a perspective on how N2O fits into a larger picture.

Sources of Atmospheric N2O

Source: Global Carbon Project

The chart above shows several important things to know.  First, the atmospheric inputs of N20 from natural sources are about 60% and human sources 40%.  Note that the estimates of inputs have a range of +/- 20% for natural sources, and +/- 50% for human sources.  Over time N2O breaks down into the main atmospheric gases N2 and O2.  No uncertainty is provided for the removal of N2O, leading to suspicion it is not measured but calculated to make a balance.

The second chart informs on the scale of N2O concentrations.  At first glance, it appears comparable to CO2, but on closer inspection the amounts are in ppb (parts per billion), not ppm (parts per million) as with CO2.  To get comparable amounts requires dividing by 1000, thus the vertical axis goes from 0.315 ppm to 0.340 ppm.  Yes, the dramatic rise over the last 22 years is 0.025ppm.

Then we have the annual global increase of N2O from all sources ranging from about 0.5 to 1.3 ppb.  Does anyone believe they can measure N2O down to 0.0005 ppm?

Then there is the matter that Nitrous oxide emissions in the United States decreased by 5% between 1990 and 2020. During this time, nitrous oxide emissions from mobile combustion decreased by 61% as a result of emission control standards for on-road vehicles. Nitrous oxide emissions from agricultural soils have varied during this period and were about the same in 2020 as in 1990. So any increases came from elsewhere, including the majority natural sources.

About Global Warming Potential

IPCC puts out a table like the Ten Commandments listing the Global Warming Potential (GWP) of all the “greenhouse gases.”  CO2 is assigned “1”, and all others are given a number as a multiple of CO2.  As noted above N2O is assigned ~300, making it a fearful GHG, depending of course on how much warming CO2 actually generates.

Source: GHG Institute

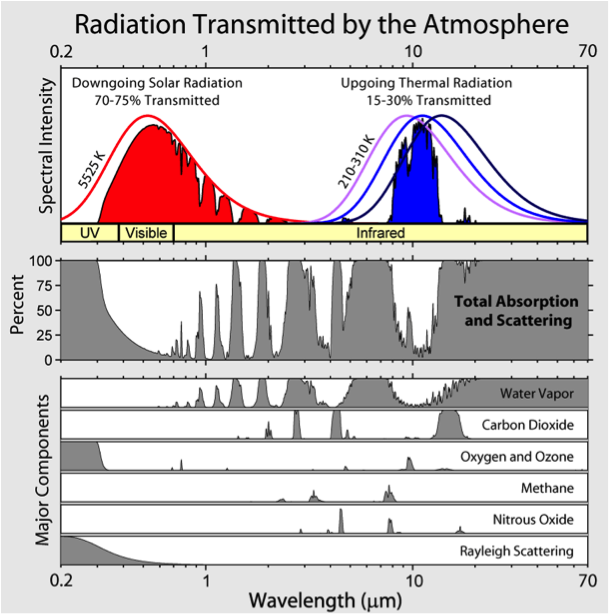
There are no details on the N2O GWP calculation of 300, but one suspects it is mainly due to the projected long residence time (100+ years) compared to about 5 years for CO2 (much shorter for CH4).  But no matter the half-life of N2O, consider the above absorption spectra of ghgs.  Note that N2O has no peaks, more like three pimples, all on the low energy longer IR wavelengths.  Moreover, the one at 4.5m overlaps entirely with CO2, the second at 7.9m is overwhelmed by H2O, and the third at 17.0m can only absorb what CO2 has not.

Getting Perspective on N2O Climate Fear

The Claim:  Nitrous Oxide is claimed to be a GHG 300 times as powerful as CO2; claimed to cause 7.5% of warming effect.  Nitrous oxide is a potent greenhouse gas with an atmospheric half-life of 120 years.  Environmentalists and ecologists share the consensus that there should be an 80% reduction in the total greenhouse gases below the 1990 level.

The Facts:

Start with a wholistic picture of IR active gases (so-called “GHGs”) .  H20 is 95% of all such gases, water vapor in the atmosphere ranging from 0 to 4%.  CO2 is a trace gas by comparison, 4% of GHGs, at 400 ppm, amounting to 0.04% of the atmosphere, presumed to be well mixed in the troposphere.

Consider that claimed N2O IR activity is less than 1%.  And in fact constitutes roughly 1/1000 of the gold blocks representing CO2.  An earlier graph showed N2O is presently ~ 0.340 ppm, or 0.00034% of the atmosphere.

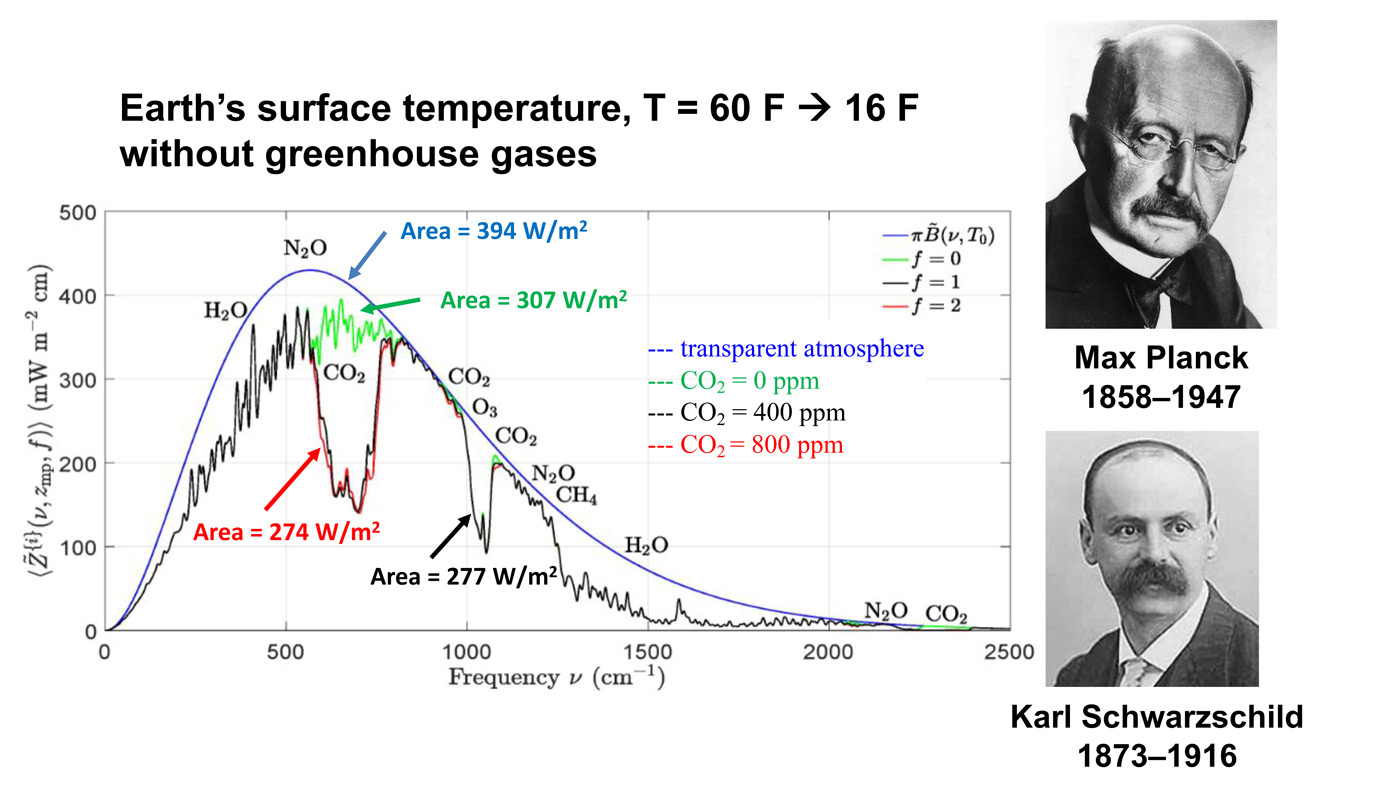
Add in the estimation by Dr. Happer regarding IR activity in our atmosphere.  The black line shows gases absorbing radiation at various wavelengths from near IR on the left (shorter wave, higher energy) to far IR on the right (longer wave, lower energy). The big black line notch in the 600s is CO2 absorption in its modern concentration of 400 ppm.  The red line shows what will be the absorption should CO2 double in amount to 800 ppm. [See Climate Change and CO2 Not a Problem]

Notice that the difference between the red and black lines is miniscule. Notice also the microscopic effects of N2O across the spectrum.  Mathematically, 300 times miniscule = negligible.

Summary

This is a bogus war on fertilizers, farmers and food.  Everything is exaggerated for the sake of an extreme agenda to impose controls on free enterprise developed societies.  It is true that use of fertilizers results in some release of N2O into the air, but even this has been overstated. And as the video demonstrates, farmers have a vested interest in using fertilizers wisely and are applying techniques that improve efficiency.  As well, there is evidence of efficiency gains in the process of producing ammonia and then urea from air and natural gas.  The attack on food supply is in effect an effort to reduce the population.

Footnote The Living Soil

“Green” Mentality


Europe’s Alps: From White to Green and Back Again

The usual suspects (BBC, Science Focus, Phys.org, The Independent, Metro UK, etc.) are worried that green spaces are visible from space, and snow cover will continue to retreat, with bad consequences for the Alpine eco-system, unless we stop burning fossil fuels.  This is triggered by a new paper by Sabine Rumpf et al. From white to green: Snow cover loss and increased vegetation productivity in the European Alps.  Excerpts from Science Focus in italics with my bolds.

Snow in the European Alps is melting and invasive plant species are outcompeting native Alpine plants, satellite imagery has shown. Both findings will reinforce climate change, say scientists.

The changes noticed in a new study, which uses satellite data from 1984 to 2021, show that as much as 77 per cent of the Alps has experienced greening, where areas with previously low vegetation have suddenly seen a boom in plant growth.

While the new plants do take a small amount of carbon out of the atmosphere by photosynthesis, scientists say the greening has a much bigger negative effect on climate change, as less of the Sun’s light will be reflected away from the Earth meaning the planet will get warmer.

The Alps are expected to see a reduction in snow mass of up to 25 per cent in the next 10-30 years, according to the Intergovernmental Panel on Climate Change’s 2019 report. As the snow melts, there will be more rock falls and landslides, which could have devastating consequences.

The new study shows that the Alps is experiencing snow cover recession that can already be seen from space, which the authors warn will only get worse as time goes on.

In the changing mountain environments, native Alpine plants have suffered while new species have thrived. This is because the plants specialised to higher elevations have had to focus on long-term living in the Alps, sacrificing the characteristics that could make them more competitive in the short term.

However, over time Alpine Temperatures and Snow are variable in quasi-cycles

For example, consider Change in temperature for the Greater Alpine Region, 1760–2007: Single years and 20-year smoothed mean series from the European Environment Agency (EEA)

Yes there are warming and cooling periods, and a rise recently.  However, summer minus winter half-years have declined the last century.  Calendar year averages peaked in 1994.  So the certainty about present conditions “only getting worse” is founded on faith rather than facts.

Then consider the record of snow cover over a longer period than the last thirty years.  Rutgers Snow Lab provides this graph:

So a lot of decadal variation is evident.  While 2020-21 snow extent is down from a peak in 2016, it was lower in 2007, and very much lower in 1988-1990.  True, the last 30 years had generally less snow than 30 years prior to 1990. But who is to say that the next 30 won’t see a return to earlier levels, still with large decadal fluxes.

And a longer term view of Alpine glaciers, shows how much climate change has gone on without the benefit of CO2 from humans.

Summer Temperatures (May – September) A rise in temperature during a warming period will result in a glacier losing more surface area or completely vanishing. This can happen very rapidly in only a few years or over a longer period of time. If temperatures drop during a cooling period and summer temperatures are too low, glaciers will begin to grow and advance with each season. This can happen very rapidly or over a longer period in time. Special thanks to Prof. em. Christian Schlüchter / (Quartärgeologie, Umweltgeologie) Universität Bern Institut für Geologie His work is on the Western Alps and was so kind to help Raymond make this graphic as correct as possible.

Summary

The combination of mild warming and higher CO2 has greatly benefited the biosphere globally, resulting in setting crop yield records nearly every year.  It should not be surprising that Europe’s Alps participated in this greening of the land.  But I object to the notion that humans caused it or can stop it by reducing emissions.  We do not control the climate or weather, and both warming and cooling periods will come and go as they always have.


Climate Delusional Disorder (CDD) 2021 Update

2021 Update comes from Brendan O’Neill writing at Spiked Climate Derangement Syndrome.  Excerpts in italics with my bolds.   Let’s Go, Brendan!

It’s the hysteria about climate change that poses the greatest threat to humanity.

The first thing to note about Climate Derangement Syndrome, whether it’s coming from the posh road-blockers of Insulate Britain, Clarence House or the Church of England, is that it has nothing whatsoever to do with science. This eco-hysteria single-handedly shatters the myth that contemporary environmentalism is a science-driven movement, merely concerned with acting upon the warnings contained in graphs and models drawn up by climatologists. Show me the piece of scientific research that says a gang of boys will rape your mother if we don’t achieve Net Zero by 2030. Where’s the peer-reviewed study that pinpoints the moment when slaughter, rape and genocide will occur if our governments fail to cut back on fossil fuels?

Of course no such studies exist. These malarial visions of future horrors spring from the realm of fantasy, not science. They are the misanthropic prejudices of the depressed middle classes, not scientific projections. They emerge from the well of existential dread in which the contemporary elites wallow, not from cool, calm modelling. And the truth is that this has long been the case with climate-change alarmism. ‘Science’ is the garb thrown on what in reality is the End Times foreboding of this new millennium’s morally at-sea elites. ‘Climate change’ is the all-encompassing idea of doom through which the Western bourgeoisie expresses its sense of moral, political and economic exhaustion.

All the recent talk of doomsday and genocide captures the extent to which the issue of climate change has been catastrophised to an extraordinary degree, how it has been transformed:

  • from a perfectly manageable problem into an apocalypse modernity brought upon itself;
  • from a scientific theory about mankind’s impact on the planet into certain, unquestionable proof of the folly of the industrial era;
  • from one challenge among many facing humankind in the 21st century into an indictment of the entire human species.
  • In short, from a technical conundrum into a God-like revelation of the wickedness of greedy, industrious mankind.

Climate Derangement Syndrome is at root a revolt against modernity. It is a reactionary, Romantic, nostalgic cry of angst against the incredible world of production and consumption mankind has created over the past 200 years. This is why some at COP26 openly denounced the Industrial Revolution. First came Greta Thunberg, the prophetess of doom of contemporary environmentalism. She angrily denounced the British government as ‘climate villains’. The UK, she said, is largely responsible for the horrors of climate change – this ‘more or less… started in the UK since that’s where the Industrial Revolution started, [where] we started to burn coal’.

It was the Industrial Revolution that dragged the populace away from the brutal, back-breaking serfdom of the land into the mad, teeming cities of London, Manchester, Sheffield, Glasgow. It revolutionised how we worked, how we lived, how we conceived of ourselves. It was the cradle of solidarity and struggle and demands for voting rights, employment rights, educational rights. It is not a coincidence that life expectancy was depressingly short for all of human history until the Industrial Revolution, when it started its stunning and steady rise. Without this revolution, most of us would still be tied to the land, never venturing further than the farm fence, unable to read, dead by 35. That’s the idyll eco-regressives fantasise about? These people are as historically illiterate as they are pseudo-scientific.

The COP26 mockery of the Industrial Revolution – more than that, the depiction of that revolution as the starting pistol of the coming climatic genocide – shines a harsh light on what is motoring today’s green hysteria. Not steam or coal, that’s for sure.

No, it’s the elites’ loss of faith in modernity and in the human project more broadly. This is why climate-change hysteria is a far larger problem for humankind than climate change itself.

As Bjorn Lomborg recently explained on spiked, climate change is a ‘middling problem’. It is the derangement over climate change, the painting of it as an End Times event we probably deserve, that truly disrupts and undermines our civilisation. With its misanthropic disdain for human behaviour and aspirations, with its revisionist treatment of the birth of modernity as essentially a crime against Mother Earth, with its incessant demands for reining in economic growth, and with its censorious branding of anyone who questions any part of the regressive green agenda as a ‘climate-change denier’, climate-change alarmism is an express menace to growth, democracy, freedom of speech and the right to dream of an even more prosperous future for all.

Prince Charles is right that we need to get on a ‘war footing’. Not against climate change, though. Rather, against this ceaseless diminishment of humanity’s achievements and the baleful, untrue claim that modern man is a plague on the planet. This manmade apocalypticism threatens to upend the remarkable civilisation we have created far more than a bit of carbon does.

Background on Climate Delusional Disorder

WebMD tells What You Need to Know about this condition.  Delusions and Delusional Disorder. Excerpts in italics with my bolds.

Delusions are the main symptom of delusional disorder. They’re unshakable beliefs in something that isn’t true or based on reality. But that doesn’t mean they’re completely unrealistic. Delusional disorder involves delusions that aren’t bizarre, having to do with situations that could happen in real life, like being followed, poisoned, deceived, conspired against, or loved from a distance. These delusions usually involve mistaken perceptions or experiences. But in reality, the situations are either not true at all or highly exaggerated.

People with delusional disorder often can continue to socialize and function normally, apart from the subject of their delusion, and generally do not behave in an obviously odd or bizarre manner. This is unlike people with other psychotic disorders, who also might have delusions as a symptom of their disorder. But in some cases, people with delusional disorder might become so preoccupied with their delusions that their lives are disrupted.

What Are the Complications of Delusional Disorder?

  • People with delusional disorder might become depressed, often as the result of difficulties associated with the delusions.
  • Acting on the delusions also can lead to violence or legal problems. For example, a person with an erotomanic delusion who stalks or harasses the object of the delusion could be arrested.
  • Also, people with this disorder can become alienated from others, especially if their delusions interfere with or damage their relationships.

Treatment most often includes medication and psychotherapy (a type of counseling). Delusional disorder can be very difficult to treat, in part because those who have it often have poor insight and do not know there’s a psychiatric problem. Studies show that close to half of patients treated with antipsychotic medications show at least partial improvement.

Delusional disorder is typically a chronic (ongoing) condition, but when properly treated, many people can find relief from their symptoms. Some recover completely, while others have bouts of delusional beliefs with periods of remission (lack of symptoms).

Unfortunately, many people with this disorder don’t seek help. It’s often hard for people with a mental disorder to know they aren’t well. Or they may credit their symptoms to other things, like the environment. They also might be too embarrassed or afraid to seek treatment. Without treatment, delusional disorder can be a lifelong illness.

An example of CDD

H.Sterling Burnett and James Taylor write at Epoch Times United Nations Misleads About Food Production and Climate Change. Excerpts in italics with my bolds

There is no better way to describe the arguments contained in the U.N. Intergovernmental Panel on Climate Change’s (IPCC) new report, “Climate Change and Land,” released just in time to influence discussions at the United Nations’ 68th Civil Society Conference. Citing anecdotal evidence instead of hard data, IPCC’s new report paints a dark, disturbing picture about the current and future state of crop production and food availability.

“Climate change, including increases in frequency and intensity of extremes, has adversely impacted food security and terrestrial ecosystems as well as contributed to desertification and land degradation in many regions,” the report claims.

“Warming compounded by drying has caused yield declines in parts of Southern Europe. Based on indigenous and local knowledge, climate change is affecting food security in drylands, particularly those in Africa, and high mountain regions of Asia and South America,” the report continues.

Here, climate alarmists in the United Nations are doing nothing more than “pounding the table,” hoping fear will drive the public to demand “climate action now!”

Of course, the fake news media eagerly amplified the alarmist report. For example, an Aug. 8 NBC News headline reads, “Climate change could trigger a global food crisis, new U.N. report says.” Many other major media outlets published similar stories.

The biggest problem is the report’s thesis and “facts” are totally wrong—and that’s quite a problem!

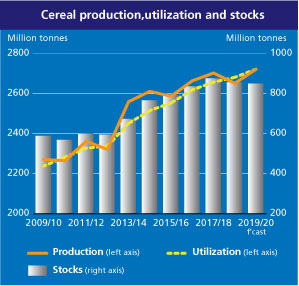
For instance, the United Nations’ own data shows farmers throughout the world are setting new production records virtually every year. In fact, the U.N. Food and Agriculture Organization reports new records were set in each of the past five years for global cereal production, which is composed of the Big Three food staples: corn, wheat, and rice.

Indeed, World-Grain.com reports in 2016 world cereal production broke records for the third straight year, exceeding the previous record yield, recorded in 2015, by 1.2 percent and topping the record yield in 2014 by 1.5 percent. These facts should not surprise anyone because hundreds of studies and experiments conclusively demonstrate plants do better under conditions of higher carbon dioxide and modestly warmer temperatures.

The ongoing record crop production perfectly illustrates the difference between the Climate Delusion perpetrated by IPCC and other government-funded alarmists and what is actually happening in the real world. To make the news gloomy, IPCC’s report nefariously engages in semantic tricks to give readers a false impression of declining global crop production. The report cites anecdotal evidence crop yields are declining in “parts” of Southern Europe, ignoring copious data showing crop yields are rising across the globe, including throughout Southern Europe.

Instead of highlighting this welcome development, IPCC focuses on what it claims are yield reductions in some small regions of Southern Europe. Readers who are not paying close attention will be led to believe, incorrectly, that crop yields are declining throughout Southern Europe. In reality, the exact opposite is true!

IPCC claims “indigenous and local knowledge” indicates food production is declining “in drylands” in Africa, Asia, and South America. However, such indigenous and local knowledge does not trump objective data, which are readily available to IPCC’s authors and show crop yields are increasing throughout Africa, Asia, and South America as a whole, including in dryland areas.

Tragically, IPCC’s misleading claims result in people who dare to point out crop production continues to set new records being accused of “denying” climate change and attacking science. Climate change is real and record crop production is in fact consistent with it. In fact, record crop production is partly due to climate change.

This is just the latest example of the ongoing Climate Delusion, as radical environmental activists, government bureaucrats, socialists, and a biased news media, looking to transform U.S. society, repeatedly make ridiculous climate claims with no basis in real environmental conditions. They hope the constant drumbeat of authoritative-sounding claims will fool people into stampeding politicians to give governments more power over the economy to combat the false climate crisis.

Fortunately, we can avoid this fate. Factual data showing the truth about global food supplies and other climate conditions are readily available to anyone willing to search the internet. Let’s hope the public accesses the facts. Enacting policies that restrict the use of abundant energy supplies will rob people of choice and harm the economy. This won’t hurt the global elite, but it will result in everyone else living poorer, more precarious lives.

See also Alarmists Anonymous

Fires in US West: History vs. Hysteria

People who struggle with anxiety are known to have moments of “hair on fire.” IOW, letting your fears take over is like setting your own hair on fire. Currently the media, pandering as always to primal fear instincts, is declaring that the US West is on fire, and it is our fault. Let’s see what we can do to help them get a grip.

First the media hysteria.

BAY AREA ON SEPTEMBER 9, 2020. IMAGE: BAY AREA AIR QUALITY

The Headlines are Screaming!

Why wildfire smoke can turn the sky orange and damage your lungs Vox18:31

A 2006 Heat Wave Was a Wake-Up Call. Why Didn’t L.A. Pay Attention? Curbed18:25

Wildfires and weather extremes: It’s not coincidence, it’s climate change CBS News18:20

Trillions up in smoke: The staggering economic cost of climate change inaction The New Daily18:09

‘Zombie Fires’ May Have Sparked Record High Carbon Emissions in the Arctic Smithsonian Magazine17:33

How Did the Wildfires Start? Here’s What You Need to Know The New York Times17:32

‘It Looks Like Doomsday’: California Residents React to Orange Sky The New York Times17:20

Apocalyptic Orange Haze And Darkness Blanket California Amid Fires HuffPost (US)16:46

Fire experts: Western fires are ‘unreal’ Mashable16:00

Devastating Wildfires Ravage The West HuffPost (US)14:25

‘Entire Western US on Fire’ as Region Faces Deadly Flames Compounded by Heatwave, Blackouts, and Coronavirus Common Dreams13:24

Unprecedented Wildfires Turn California Skies Orange Vice (US)13:43

Now the History.  Are these wildfires “unprecedented?”

The National Interagency Fire Center provides the facts and historical context.  Here are the details on this year and the last decade.

Note that for the year-to-date, 2020 is below average both for number of fires and acreage.  Three years were over 8M acres at this point in the year.  And one of them (2012) was also an election year, but lacked the current media fury politicizing everything.

Annual Number of Acres Burned in US Wildland Fires, 1980-2019

Background Information from Previous Post Arctic on Fire! Not.

1. Summer is fire season for northern boreal forests and tundra.

From the Canadian National Forestry Database

Since 1990, “wildland fires” across Canada have consumed an average of 2.5 million hectares a year.

Recent Canadian Forest Fire Activity 2015 2016 2017
Area burned (hectares) 3,861,647 1,416,053 3,371,833
Number of fires 7,140 5,203 5,611

The total area of Forest and other wooded land in Canada  is 396,433,600 (hectares).  So the data says that every average year 0.6% of Canadian wooded area burns due to numerous fires, ranging from 1000 in a slow year to over 10,000 fires and 7M hectares burned in 1994.

2. With the warming since 1980 some years have seen increased areas burning.

From Wildland Fire in High Latitudes, A. York et al. (2017)

Despite the low annual temperatures and short growing seasons characteristic of northern ecosystems, wildland fire affects both boreal forest (the broad band of mostly coniferous trees that generally stretches across the area north of the July 13° C isotherm in North America and Eurasia, also known as Taiga) and adjacent tundra regions. In fact, fire is the dominant ecological disturbance in boreal forest, the world’s largest terrestrial biome. Fire disturbance affects these high latitude systems at multiple scales, including direct release of carbon through combustion (Kasischke et al., 2000) and interactions with vegetation succession (Mann et al., 2012; Johnstone et al., 2010), biogeochemical cycles (Bond-Lamberty et al., 2007), energy balance (Rogers et al., 2015), and hydrology (Liu et al., 2005). About 35% of global soil carbon is stored in tundra and boreal systems (Scharlemann et al., 2014) that are potentially vulnerable to fire disturbance (Turetsky et al., 2015). This brief report summarizes evidence from Alaska and Canada on variability and trends in fire disturbance in high latitudes and outlines how short-term fire weather conditions in these regions influence area burned.

Climate is a dominant control of fire activity in both boreal and tundra ecosystems. The relationship between climate and fire is strongly nonlinear, with the likelihood of fire occurrence within a 30-year period much higher where mean July temperatures exceed 13.4° C (56° F) (Young et al., 2017). High latitude fire regimes appear to be responding rapidly to recent environmental changes associated with the warming climate. Although highly variable, area burned has increased over the past several decades in much of boreal North America (Kasischke and Turetsky, 2006; Gillett et al., 2004). Since the early 1960s, the number of individual fire events and the size of those events has increased, contributing to more frequent large fire years in northwestern North America (Kasischke and Turetsky, 2006). Figure 1 shows annual area burned per year in Alaska (a) and Northwest Territories (b) since 1980, including both boreal and tundra regions.

[Comment: Note that both Alaska and NW Territories see about 500k hectares burned on average each year since 1980.  And in each region, three years have been much above that average, with no particular pattern as to timing.]

Recent large fire seasons in high latitudes include 2014 in the Northwest Territories, where 385 fires burned 8.4 million acres, and 2015 in Alaska, where 766 fires burned 5.1 million acres (Figs. 1 & 2)—more than half the total acreage burned in the US (NWT, 2015; AICC, 2015). Multiple northern communities have been threatened or damaged by recent wildfires, notably Fort McMurray, Alberta, where 88,000 people were evacuated and 2400 structures were destroyed in May 2016. Examples of recent significant tundra fires include the 2007 Anaktuvuk River Fire, the largest and longest-burning fire known to have occurred on the North Slope of Alaska (256,000 acres), which initiated widespread thermokarst development (Jones et al., 2015). An unusually large tundra fire in western Greenland in 2017 received considerable media attention.

Large fire events such as these require the confluence of receptive fuels that will promote fire growth once ignited, periods of warm and dry weather conditions, and a source of ignition—most commonly, convective thunderstorms that produce lightning ignitions. High latitude ecosystems are characterized by unique fuels—in particular, fast-drying beds of mosses, lichens, resinous shrubs, and accumulated organic material (duff) that underlie dense, highly flammable conifers. These understory fuels cure rapidly during warm, dry periods with long daylight hours in June and July. Consequently, extended periods of drought are not required to increase fire danger to extreme levels in these systems.

Most acreage burned in high latitude systems occurs during sporadic periods of high fire activity; 50% of the acreage burned in Alaska from 2002 to 2010 was consumed in just 36 days (Barrett et al., 2016). Figure 3 shows cumulative acres burned in the four largest fire seasons in Alaska since 1990 (from Fig. 1) and illustrates the varying trajectories of each season. Some seasons show periods of rapid growth during unusually warm and dry weather (2004, 2009, 2015), while others (2004 and 2005) were prolonged into the fall in the absence of season-ending rain events. In 2004, which was Alaska’s largest wildfire season at 6.6 million acres, the trajectory was characterized by both rapid mid-season growth and extended activity into September. These different pathways to large fire seasons demonstrate the importance of intraseasonal weather variability and the timing of dynamical features. As another example, although not large in total acres burned, the 2016 wildland fire season in Alaska was more than 6 months long, with incidents requiring response from mid-April through late October (AICC, 2016).

3. Wildfires are part of the ecology cycle making the biosphere sustainable.

Forest Fire Ecology: Fire in Canada’s forests varies in its role and importance.

In the moist forests of the west coast, wildland fires are relatively infrequent and generally play a minor ecological role.

In boreal forests, the complete opposite is true. Fires are frequent and their ecological influence at all levels—species, stand and landscape—drives boreal forest vegetation dynamics. This in turn affects the movement of wildlife populations, whose need for food and cover means they must relocate as the forest patterns change.

lThe Canadian boreal forest is a mosaic of species and stands. It ranges in composition from pure deciduous and mixed deciduous-coniferous to pure coniferous stands.

The diversity of the forest mosaic is largely the result of many fires occurring on the landscape over a long period of time. These fires have varied in frequency, intensity, severity, size, shape and season of burn.

The fire management balancing act: Fire is a vital ecological component of Canadian forests and will always be present.

Not all wildland fires should (or can) be controlled. Forest agencies work to harness the force of natural fire to take advantage of its ecological benefits while at the same time limiting its potential damage and costs.

Tundra Fire Ecology

From Arctic tundra fires: natural variability and responses to climate change, Feng Sheng Hu et al. (2015)

Circumpolar tundra fires have primarily occurred in the portions of the Arctic with warmer summer conditions, especially Alaska and northeastern Siberia (Figure 1). Satellite-based estimates (Giglio et al. 2010; Global Fire Emissions Database 2015) show that for the period of 2002–2013, 0.48% of the Alaskan tundra has burned, which is four times the estimate for the Arctic as a whole (0.12%; Figure 1). These estimates encompass tundra ecoregions with a wide range of fire regimes. For instance, within Alaska, the observational record of the past 60 years indicates that only 1.4% of the North Slope ecoregion has burned (Rocha et al. 2012); 68% of the total burned area in this ecoregion was associated with a single event, the 2007 AR Fire.

The Noatak and Seward Peninsula ecoregions are the most flammable of the tundra biome, and both contain areas that have experienced multiple fires within the past 60 years (Rocha et al. 2012). This high level of fire activity suggests that fuel availability has not been a major limiting factor for fire occurrence in some tundra regions, probably because of the rapid post-fire recovery of tundra vegetation (Racine et al. 1987; Bret-Harte et al. 2013) and the abundance of peaty soils.

However, the wide range of tundra-fire regimes in the modern record results from spatial variations in climate and fuel conditions among ecoregions. For example, frequent tundra burning in the Noatak ecoregion reflects relatively warm/dry climate conditions, whereas the extreme rarity of tundra fires in southwestern Alaska reflects a wet regional climate and abundant lakes that act as natural firebreaks.

Fire alters the surface properties, energy balance, and carbon (C) storage of many terrestrial ecosystems. These effects are particularly marked in Arctic tundra (Figure 5), where fires can catalyze biogeochemical and energetic processes that have historically been limited by low temperatures.

In contrast to the long-term impacts of tundra fires on soil processes, post-fire vegetation recovery is unexpectedly rapid. Across all burned areas in the Alaskan tundra, surface greenness recovered within a decade after burning (Figure 6; Rocha et al. 2012). This rapid recovery was fueled by belowground C reserves in roots and rhizomes, increased nutrient availability from ash, and elevated soil temperatures.

At present, the primary objective for wildland fire management in tundra ecosystems is to maintain biodiversity through wildland fires while also protecting life, property, and sensitive resources. In Alaska, the majority of Arctic tundra is managed under the “Limited Protection” option, and most natural ignitions are managed for the purpose of preserving fire in its natural role in ecosystems. Under future scenarios of climate and tundra burning, managing tundra fire is likely to become increasingly complex. Land managers and policy makers will need to consider trade-offs between fire’s ecological roles and its socioeconomic impacts.

4. Arctic fire regimes involve numerous interacting factors.

Frequent Fires in Ancient Shrub Tundra: Implications of Paleorecords for Arctic Environmental Change
Philip E. Higuera et al. (2008)

Although our fire-history records provide unique insights into the potential response of modern tundra ecosystems to climate and vegetation change, they are imperfect analogs for future fire regimes. First, ongoing vegetation changes differ from those of the late-glacial period: several shrub taxa (Salix, Alnus, and Betula) are currently expanding into tundra [10], whereas Betula was the primary constituent of the ancient shrub tundra. The lower flammability of Alnus and Salix compared to Betula could make future shrub tundra less flammable than the ancient shrub tundra. Second, mechanisms of past and future climate change also differ. In the late-glacial and early-Holocene periods, Alaskan climate was responding to shrinking continental ice volumes, sea-level changes, and amplified seasonality arising from changes in the seasonal cycle of insolation [13]; in the future, increased concentrations of atmospheric greenhouse gases are projected to cause year-round warming in the Arctic, but with a greater increase in winter months [8]. Finally, we know little about the potential effects of a variety of biological and physical processes on climate-vegetation-fire interactions. For example, permafrost melting as a result of future warming [8] and/or increased burning [24] could further facilitate fires by promoting shrub expansion [10], or inhibit fires by increasing soil moisture [24].

5. The Arctic has adapted to many fire regimes stronger than today’s activity.

The Burning Tundra: A Look Back at the Last 6,000 Years of Fire in the Noatak National Preserve, Northwestern Alaska

Fire history in the Noatak also suggests that subtle changes in vegetation were linked to changes in tundra fire occurrence. Spatial variability across the study region suggests that vegetation responded to local-scale climate, which in turn influenced the flammability of surrounding areas. This work adds to evidence from ‘ancient’ shrub tundra in the southcentral Brooks Range suggesting that vegetation change will likely modify tundra fire regimes, and it further suggests that the direction of this impact will depend upon the specific makeup of future tundra vegetation. Ongoing climate-related vegetation change in arctic tundra such as increasing shrub abundance in response to warming temperatures (e.g., Tape et al. 2006), could both increase (e.g., birch) or decrease (e.g., alder) the probability of future tundra fires.

This study provides estimated fire return intervals (FRIs) for one of the most flammable tundra ecosystems in Alaska. Fire managers require this basic information, and it provides a valuable context for ongoing and future environmental change. At most sites, FRIs varied through time in response to changes in climate and local vegetation. Thus, an individual mean or median FRI does not capture the range of variability in tundra fire occurrence. Long-term mean FRIs in many periods were both shorter than estimates based on the past 60 years and statistically indistinct from mean FRIs found in Alaskan boreal forests (e.g., Higuera et al. 2009) (Figure 2). These results imply that tundra ecosystems have been resilient to relatively frequent burning over the past 6,000 years, which has implications for both managers and scientists concerned about environmental change in tundra ecosystems. For example, increased tundra fire occurrence could negatively impact winter forage for the Western Arctic Caribou Herd (Joly et al. 2009). Although the Noatak is only a portion of this herd’s range, our results indicate that if caribou utilized the study area over the past 6,000 years, then they have successfully co-existed with relatively frequent fire.

Climate Problem? Data say no.

An recent article is The Crucial Question That Requires Asking: Is There a Climate Problem?  As David Simon explains, so many take the “climate problem” as a given without looking at the evidence. Excerpts in italics with my bolds and images.

In “Coronavirus and the Climate,” Wall Street Journal columnist Walter Russell Mead swallows the big lie about global warming.

Mead’s column posted on June 15 begins by sharing a projection that draconian coronavirus lockdown measures will reduce 2020 global CO2 emissions by about the amount that the United Nations Environment Program has determined is supposedly needed annually “if the world is to have any chance of keeping the average temperature from rising more than 1.5 degrees Celsius.”

Mead then laments that most of these measures “aren’t economically sustainable.” Teleworking adopted during the lockdown may become the norm for many rather than the exception, but “[a] campaign to ‘cut the commute’ globally won’t solve the climate problem.”

But Mead never considers the key question: is there is a “climate problem”? He simply accepts as undeniable scientific truth that keeping the earth’s temperature from rising more than 1.5 degrees is necessary to prevent catastrophic harm.

The scientific evidence does not support this proposition. There are speculative, pseudo-scientific projections and models that purport to show that global warming will lead to climate doom. But actual scientific data instead show that global warming has not been harmful and presents no danger to future generations.

First, rather than imperiling human life, the data show that global warming saves lives.

A 2015 study by 22 scientists from around the world found that cold kills over 17 times more people than heat.

The scientists examined over 74 million deaths in Australia, Brazil, Canada, China, Italy, Japan, South Korea, Spain, Sweden, Taiwan, Thailand, the United Kingdom, and the United States in 1985-2012. The data they compiled show that cold caused 7.29 percent of these deaths, while heat caused only 0.42 percent. The data also show that “moderately hot and cold temperatures” caused 88.85 percent of the temperature-related deaths, while “extreme” temperatures caused only 11.15 percent. See Climate Medicine

Second, the number of natural disaster deaths declined by over 80 percent as the earth’s temperature has been rising.

NASA data show that since 1920, the earth’s temperature has risen by 1.25 degrees Celsius. Since 1920, world population also has quadrupled from less than two billion to over seven and half billion. Yet during this period, EM-DAT (The International Disaster Database) data show that the number of people killed by natural disasters has declined from almost 55,000 per year to less than 10,000 per year. See Data vs. Models #3: Disasters

Third, the global air pollution death rate has fallen by almost 50 percent since 1990.

University of Oxford economist Max Roser and researcher Hannah Ritchie show in Our World in Data that “since 1990 the number of deaths per 100,000 people have nearly halved,” declining from 111.28 to 63.82.

Fourth, even the Cassandras acknowledge that any impact on the nation’s economy is likely to be minimal.

The National Bureau of Economic Research estimated in 2019 that if the earth’s temperature rises by 0.01 degrees Celsius per year through 2100, total U.S. GDP in 2100 will be 1.88 percent lower in 2100 than it would otherwise be.

Yet based on the Congressional Budget Office’s estimate of a 1.4 percent annual real long-term potential labor force productivity growth rate, the nation’s per person GDP will be about 204 percent higher by 2100. With the reduction that NBER estimates based on global warming, GDP per person would be an almost indistinguishable 200 percent higher.

The NBER’s extreme case projection that if the earth’s temperature rises by 0.04 degrees Celsius per year through 2100 (five times the actual rate of increase since 1880), total U.S. GDP will be 10.52 percent lower in 2100 than it would otherwise be, similarly would leave GDP per person about 172 percent higher.

In other words, after taking account of the supposedly harmful impact of global warming, U.S. income per person in 2100 will be about triple today’s level.

See Also Crunching Climate $$$

Don’t swallow the big lie. Check the data. Global warming has not been harmful and presents no danger to future generations.

More Data Against Claims of a Climate Problem: Eleven Empty Climate Claims

From a previous post, below are a series of rebuttals of the 11 most common climate alarmists’ claims such as those made in the recently released Fourth National Climate Assessment Report.[2] The authors of these rebuttals are all recognized experts in the relevant fields.  H/T Joseph D’Aleo for compiling work by many experts at his website ACRESEARCH Fact Checking Climate Claims.  Excerpts in italics with my bolds.

For each alarmist claim, a summary of the relevant rebuttal is provided below along with a link to the full text of the rebuttal, which includes the names and the credentials of the authors of each rebuttal.

Claim: Heat Waves are increasing at an alarming rate and heat kills.
Fact:  They have been decreasing since the 1930s in the U.S. and globally.

There has been no detectable long-term increase in heat waves in the United States or elsewhere in the world. Most all-time record highs here in the U.S. happened many years ago, long before mankind was using much fossil fuel. Thirty-eight states set their all-time record highs before 1960 (23 in the 1930s!). Here in the United States, the number of 100F, 95F and 90F days per year has been steadily declining since the 1930s. The Environmental Protection Agency Heat Wave Index confirms the 1930s as the hottest decade.

Days over 95F vs. CO2Detailed Rebuttal and Authors: Heat Waves (08/19/19)

Claim: Global warming is causing more hurricanes and stronger hurricanes.
Fact:  Hurricane activity is flat to down since 1900, landfalls in the US are declining

The long-term linear trend in the number and intensity of global hurricane activity has remained flat or down. Hurricane activity does vary year-to-year and over longer periods as short-term ocean cycles like El Nino/La Nina and multidecadal cycles in the Pacific (PDO) and Atlantic (AMO) ocean temperature regimes favor changes in activity levels and some basins over others.

Credible data show this is true despite much better open ocean detection than before the 1960s when many short-lived storms at sea would have been missed as there were no satellites, no aircraft reconnaissance, no radar, no buoys and no automated weather stations.

Detailed Rebuttal and Authors: AC Rebuttal Hurricanes (10/19/19).

Claim: Global warming is causing more and stronger tornadoes.
Fact:  The number of strong tornadoes have declined over the last half century

Tornadoes are failing to follow “global warming” predictions. Strong tornadoes have seen a decline in frequency since the 1950s. The years 2012, 2013, 2014, 2015 and 2016 all saw below average to near record low tornado counts in the U.S. since records began in 1954. 2017 rebounded only to the long-term mean. 2018 ranked well below the 25thpercentile. Tornadoes increased this spring as extreme cold and late snow clashed with southeast warmth to produce a series of strong storms with heavy rains and severe weather including tornadoes. May ranked among the biggest months and the season rebounded after 7 quiet years above the 50th percentile.

Detailed Rebuttal and Authors: AC Rebuttals Tornadoes (08/20/19)

Claim: Global warming is increasing the magnitude and frequency of droughts and floods.
Fact: Droughts and floods have not changed since we’ve been using fossil fuels

Our use of fossil fuels to power our civilization is not causing droughts or floods. NOAA found there is no evidence that floods and droughts are increasing because of climate change.

The number, extend or severity of these events does increase dramatically for a brief period of years at some locations from time to time but then conditions return to more normal. This is simply the long-established constant variation of weather resulting from a confluence of natural factors.

Detailed Rebuttal and Authors: AC Rebuttals Droughts and Floods (08/22/19

Claim: Global Warming has increased U.S. Wildfires.
Fact: Wildfires have been decreasing since 1800s. The increase in damage in recent years is due to population growth in vulnerable areas and poor forest management.

Wildfires are in the news almost every late summer and fall. The National Interagency Fire Center has recorded the number of fires and acreage affected since 1985. This data show the number of fires trending down slightly, though the acreage burned had increased before leveling off over the last 20 years.

The NWS tracks the number of days where conditions are conducive to wildfires when they issue red-flag warnings. It is little changed.

Detailed Rebuttal and Authors: AC Rebuttal Wildfires 080719

Claim: Global warming is causing snow to disappear.
Fact: Snowfall is increasing in the fall and winter in the Northern Hemisphere and North America with many records being set.

This is one claim that has been repeated for decades even as nature showed very much the opposite trend with unprecedented snows even in the big coastal cities. Every time they repeated the claim, it seems nature upped the ante more.

Alarmists have eventually evolved to crediting warming with producing greater snowfall, because of increased moisture but the snow events in recent years have usually occurred in colder winters with high snow water equivalent ratios in frigid arctic air.

Detailed Rebuttal and Authors: AC Rebuttal Snow (09/19/19)

Claim: Global warming is resulting in rising sea levels as seen in both tide gauge and satellite technology.
Fact: The rate of global sea level rise on average has fallen by 40% the last century. Where it is increasing – local factors such as land subsidence are to blame.

This claim is demonstrably false. It really hinges on this statement: “Tide gauges and satellites agree with the model projections.” The models project a rapid acceleration of sea level rise over the next 30 to 70 years. However, while the models may project acceleration, the tide gauges clearly do not.

All data from tide gauges in areas where land is not rising or sinking show instead a steady linear and unchanging sea level rate of rise from 4 up to 6 inches/century, with variations due to gravitational factors. It is true that where the land is sinking as it is in the Tidewater area of Virginia and the Mississippi Delta region, sea levels will appear to rise faster but no changes in CO2 emissions would change that.

Detailed Rebuttal and Authors: Rebuttal – Sea Level (01/18/19)

Claim: Arctic, Antarctic and Greenland ice loss is accelerating due to global warming.
Fact: The polar ice varies with multidecadal cycles in ocean temperatures. Current levels are comparable to or above historical low levels

Satellite and land surface temperature records and sea surface temperatures show that both the East Antarctic Ice Sheet and the West Antarctic Ice Sheet are cooling, not warming and glacial ice is increasing, not melting. Satellite and land surface temperature measurements of the southern polar area show no warming over the past 37 years. Growth of the Antarctic ice sheets means the sea level rise is not being caused by melting of polar ice and, in fact, is slightly lowering the rate of rise. Satellite Antarctic temperature records show 0.02C/decade cooling since 1979. The Southern Ocean around Antarctica has been getting sharply colder since 2006. Antarctic sea ice is increasing, reaching all-time highs. Surface temperatures at 13 stations show the Antarctic Peninsula has been sharply cooling since 2000.

Arctic temperature records show that the 1920s and 1930s were warmer than in the 2000s. Official historical fluctuations of Arctic sea ice begin with the first satellite images in 1979. That happens to coincide with the end of the recent 1945–1977 global cold period and the resulting maximum extent of Arctic sea ice. During the warm period from 1978 until recently, the extent of sea ice has diminished, but increased in the past several years. The Greenland ice sheet has also grown with cooling after an anomalously warm 2012.

Detailed Rebuttal and Authors: AC Rebuttal Arctic, Antarctic and Greenland (05/19/19)

Claim: Global warming responsible for record July warmth in Alaska.
Fact:  Alaska July 2019 heat records resulted from a warm North Pacific and reduced ice in the Bering Sea late winter due to strong storms. The opposite occurred with record cold in 2012.

Alaska climate (averages and extremes) varies over time but the changes can be explained by natural variability in the North Pacific Ocean, which controls the climate regime in downstream land areas. These ocean temperature regimes (modes of the Pacific Decadal Oscillation or PDO) improves season-to-season and year-to-year climate forecasts for North America because of its strong tendency for multi-season and multi-year persistence. The PDO correlates well with tendencies for El Nino and La Nina, which have a major impact on Alaska and much of North America.

See Rebuttal: AC Rebuttal- Alaska’s hot July caused by global warming (08/21/19)

Claim: Rising atmospheric CO2 concentrations are causing ocean acidification, which is catastrophically harming marine life.
Fact: When life is considered, ocean acidification is often found to be a non-problem, or even a benefit.

The ocean chemistry aspect of the ocean acidification hypothesis is rather straightforward, but it is not as solid as it is often claimed to be. For one thing, the work of a number of respected scientists suggests that the drop in oceanic pH will not be nearly as great as the IPCC and others predict. And, as with all phenomena involving living organisms, the introduction of life into the analysis greatly complicates things. When a number of interrelated biological phenomena are considered, it becomes much more difficult, if not impossible, to draw such sweeping negative conclusions about the reaction of marine organisms to ocean acidification. Quite to the contrary, when life is considered, ocean acidification is often found to be a non-problem, or even a benefit. And in this regard, numerous scientific studies have demonstrated the robustness of multiple marine plant and animal species to ocean acidification—when they are properly performed under realistic experimental conditions.

Detailed Rebuttal and Author: AC Rebuttal – Ocean Acidification (02/04/19)

Claim: Carbon pollution is a health hazard.
Fact: Carbon dioxide (CO2) is an odorless invisible trace gas that is plant food and it is essential to life on the planet. It is not a pollutant.

The term “carbon pollution” is a deliberate, ambiguous, disingenuous term, designed to mislead people into thinking carbon dioxide is pollution. It is used by the environmentalists to confuse the environmental impacts of CO2 emissions with the impact of the emissions of unwanted waste products of combustion. The burning of carbon-based fuels (fossil fuels – coal, oil, natural gas – and biofuels and biomass) converts the carbon in the fuels to carbon dioxide (CO2), which is an odorless invisible gas that is plant food and it is essential to life on the planet.
Detailed Rebuttal and Authors: AC Rebuttal Health Impacts (02/04/19)

Claim: CO2-induced climate change is threatening global food production and harming natural ecosystems.
Fact: The vitality of global vegetation in both managed and unmanaged ecosystems is better off now than it was a hundred years ago, 50 years ago, or even a mere two-to-three decades ago thanks in part to CO2.

Such claims are not justified; far from being in danger, the vitality of global vegetation in both managed and unmanaged ecosystems is better off now than it was a hundred years ago, 50 years ago, or even a mere two-to-three decades ago.

With respect to managed ecosystems (primarily the agricultural enterprise), yields of nearly all important food crops have been rising for decades (i.e., the Green Revolution). Reasons for these increases are manifold, but they have mainly occurred in response to continuing advancements in agricultural technology and scientific research that have expanded the knowledge or intelligence base of farming (e.g., fertilizers, pesticides, irrigation, crop selection and breeding, computers, machinery and other devices).

Spatial pattern of trends in Gross Primary Production (1982- 2015). Source: Sun et al. 2018.

Detailed Rebuttal and Authors: AC Rebuttal Agriculture and NaturalEcosystems_Idso020619 (1)

Conclusion:

The well-documented invalidation of the “three lines of evidence” upon which EPA attributes global warming to human -caused CO2 emissions breaks the causal link between such CO2 emissions and global warming.

This in turn necessarily breaks the causal chain between CO2 emissions and the alleged knock-on effects of global warming, such as loss of Arctic ice, increased sea level, and increased heat waves, floods, droughts, hurricanes, tornadoes, etc. These alleged downstream effects are constantly cited to whip up alarm and create demands for ever tighter CO2 regulation. EPA explicitly relied on predicted increases in such events to justify the Endangerment Finding supporting its Clean Power Plan. But as shown above, there is no evidence to support such claims, and copious empirical evidence that refutes them.

California Newts Suffer, Because Climate Change

Two newts from Southern California, the newt on the left showing 20% reduced

Phys.org has the story:  As climate change messes with temperature and precipitation, California newts suffer by David Colgan, University of California, Los Angeles.  Excerpt in italics

That’s bad news for Los Angeles’ only newt, California newt, Taricha torosa, and other newts in the Taricha genus, particularly in the southern half of the state south of Big Sur.  A UCLA-led study, in the Nature journal Scientific Reports examined body condition of newts across their entire range, from San Diego to Mendocino. In the south, researchers discovered that body condition—a measure of health that compares weight to length—decreased by an average of 20% from 2008–2016.

Independent confirmation of the study comes in the form of California Governor Gavin Newtsom seeming to shrink before our eyes as he declared martial law on the pretext of coronavirus.

Dipole Down Under

Vijay Jayaraj explains how weather is created around the Indian Ocean in this article Record Heat and Cold Expose Climate Alarmists’ Bias. Excerpts in italics with my bolds and images.

Australia was literally on fire in December. Record heat made headlines in global media. So did the extreme rainfall in east Africa.

You and everybody else on earth can guess what climate alarmists blamed for both: man-made global warming, a.k.a. climate change.

But record cold in northern India at the same time didn’t make headlines in any major media in the United States or the United Kingdom.

Why? Because it didn’t fit expectations.

It’s a perfect example of climate alarmists’ obvious bias that’s seldom brought to light.

In December, east Africa received extremely heavy rainfall, causing widespread floods in Kenya and Djibouti. The floods impacted more than one million people and killed scores already challenged by extreme poverty.

During the same month, Australia recorded all-time highs. Widespread, devastating wildfires made the situation worse.

Climate alarmists predictably claimed these weather events for their propaganda.  Almost all news article about the Australian heat and wildfires ultimately blamed man-made climate change. But more than four-fifths of Australia’s wildfires were caused by arson, not climate change.

And what caused the extreme hot weather was not global warming but a phenomenon called Positive Indian Ocean Dipole (PIOD).

PIOD is a seasonal weather phenomenon that can affect climate in east Africa, south Asia, and Australia all at once.

The same PIOD that caused Australia’s heat (but not its wildfires) caused the year-end floods in east Africa. It also caused extreme cold in northern India in the same month. Largely underreported in global media, the cold continued right through to the end of December.

Delhi, India’s capital, recorded its second-coldest December in 118 years. Intermittent cold waves gripped Punjab, Jammu and Kashmir, Ladakh, Himachal Pradesh, Uttarakhand, and Delhi.

On December 28, the heart of Delhi recorded a minimum of 1.7˚C (35˚F). The temperature likely reached freezing outside the city’s urban heat island effect. The cold wave impacted everyday life for 29 million people in Delhi.

But neither CNN nor BBC headlines ever mentioned it. It runs contrary to their narrative. Winters are supposed to become warmer. Though the mainstream media do link the PIOD to the Australian heat and the east African floods, they never shy away from blaming man-made climate change and find ways to link both.

Now their new theory is that the PIOD itself has become more intense because of climate change. In other words, weather events are non-existent in their dictionary. Each and every extreme weather event is blamed on man-made climate change.

This is what happens when people read every weather event through the preconceived lenses of climate alarmism.

Closer inspection reveals no change in very hot days in Australia since World War I. So hot weather (short term) and hot climate (long term) have nothing to do with the wildfire outbreak.

December’s extremes — heat in Australia, flooding in east Africa, cold in India — all were caused by a strong PIOD, not climate change.

These weather events neither prove nor disprove man-made climate change. But they do expose the bias of climate alarmists who blame them on man-made global warming.

Vijay Jayaraj (M.Sc., Environmental Science, University of East Anglia, England) is a research contributor for the Cornwall Alliance for the Stewardship of Creation.

Footnote:

The real tragedy is that Australian officials keep obsessing over their bogus climate models instead taking seriously real world weather warnings. It is not like they had no advance notice; this was published May 16, 2019, which should have triggered major efforts to reduce the fuel load long before summer.

ABC Online: A positive Indian Ocean Dipole this winter is bad news for drought-hit parts of Australia

Cool seas off WA’s north-west could kick off a climatic phenomenon that may exacerbate a winter drought across central and southern Australia.

See Also Aussies’ Choice:  Burn Cool or Burn Hot

Corrections to CO2 Post

This is an update correcting a previous post Fear Not CO2!  I discovered math errors that invalidated the main conclusion.  I apologize for not seeing the problem before posting.

At Quora Paul Noel answers the question Is climate change the biggest catastrophic risk facing humanity today? Text below in italics with my bolds

NO it is not even an issue you need to worry about.

Look closely. The biological adaptation is eating up the CO2 almost as fast as it is being emitted and the adaptation is getting faster every year.

Out of the over 38 GT output in 2019 only 0.02 GT will not be sequestered naturally and by next year that will be gone. The plants are eating up the CO2 just a few days after the release. They are happily eating it up just fine. You don’t even need to plant trees. Nothing against trees here. I like them.

This is the TRUMP CARD on the game. With this known, it is impossible to imagine the problems proposed are happening regardless of all other issues.

Correction Update

I reblogged an answer from Quora with an analysis and conclusions new to me. I thought it interesting if it held up to scrutiny.. Afterward I became uncomfortable when double checking the math, and so I am retracting my support. One smaller issue was noted in my post regarding CO2 having a larger weight (44) than the average air molecule (29). Thus calculating CO2 mass in the atmosphere should apply a ratio of 1.52. That does not in itself materially affect the finding.

The Table produced by Paul Noel is shown above..

The more substantial issue is having equivalent units of mass for comparing atmospheric CO2 and human emissions of CO2. The proper unit is Gigatons since that is how emissions are reported. One GT is defined as 1 billion (10^9) metric tons and 1 metric ton is 1000 (10^3) kilograms. So one GT is 10^12 kg.

The mass of the atmosphere is calculated using air pressure and area, with a little variation in the results obtained by researchers. A typical standard is 5.148 x 10^18 kg. That converts to 5148000 x 10^12 kg or 5148000 GT. Once that value is plugged into the table, the results are very different. I had recognized that 10^15 was not GT, but thought it was only mislabeling. Later I found that the comparison was distorted in the process.

My revised Table 1 applies a weighted calculation for CO2 compared to average air molecules and derives masses and percentages using GT consistently.

It is clear that the claim of 99% sequestration of emissions is an artifact of faulty math. A better approximation is 57% for emissions reduced by natural fluxes.

This does not mean we should fear CO2. For one thing the greening of the planet and record annual crop yields are a great benefit from both warming and higher atmospheric CO2. It is also the case that estimates of human emissions (fraught with uncertainty) are small compared to natural fluxes, which are estimated with error ranges exceeding emission amounts. Further, the sensitivity of temperature to rising CO2 is assumed to lie in a wide range.

My views on the CO2 cycle are in the posts:

CO2 Fluxes, Sources and Sinks

Who to Blame for Rising CO2?