Far below the Arctic ice lies a special area with volcanic activity. What lives down there? Scientists have gone on a journey to find out.
Hydrothermal vents were first discovered in 1979. They look like pipes sticking out of the seabed and emit warm “smoke”, which is actually hot fluid loaded with minerals.
In the Atlantic and Pacific, many of these vents, also called chimneys, are surrounded by unique ecosystems with clams, blind shrimp, beard worms and extremophile bacteria.
Life there does not get its energy from the sun, but from the interior of the earth.
Microorganisms use reduced compounds from the vents as an energy source to make organic matter, just as plants and algae use photons from the sun. Larger animals live in symbiosis with these microbes.
However, no one has previously looked at the fauna in this type of area in the Arctic.
What lives in these cold, deep waters, 4,000 metres below the ice?
“We wanted to see if this ecosystem had developed in isolation — whether it is very different from other places with hydrothermal vents, or whether the fields are interconnected,” says Eva Ramirez-Llodra.
“It was hard to plan the days, because you work at the mercy of the ice,” says Ramirez-Llodra.
Arctic sea ice is not quiet. It breaks up, freezes, and varies in thickness. That made it difficult to get to the right place. The researchers towed a camera after the boat to film the seabed.
On October 3, they finally got a good position over what they believed was the field. Everyone’s eyes were fixed on the screens in the control room and the tension was high.
The pictures show the typical fauna on the Aurora volcanic field. The first picture shows a large sinkhole. (Photo: AWI, OFOBS team)
It was a huge hydrothermal vent, a black smoker, and later the researchers found two others.
“We could see that we were approaching the vents, because the sediments became coarser, and there were more stones and colours on the sea floor,” Ramirez-Llodra says.
One encounter was a little close. The researchers pulled the camera up over a mound, and suddenly they saw black smoke billowing out of a gaping, underwater crater.
“It’s not actually smoke, but very hot liquid at about 350 degrees C. The camera ran right into it. It went so fast that we couldn’t stop it. Everything went black and we were scared that we had burned everything up,” she says. “Fortunately, we got the picture back after a few minutes. We could continue. This was our first close encounter with a black smoker.”
Scientists saw fields that shone like gold on the otherwise colourless bottom around the chimneys.
The material the researchers saw wasn’t gold but sulphite that is deposited by the black “smoke”, Ramirez-Llodra says, although there are also traces of gold and silver in the fluid that gushes from the vent. Around the vents were clusters of white organisms that glistened as they reflected the light from the camera.
The area around the Aurora field was covered by a thick layer of fine-grained sediments. Where the ground was solid enough for something to stick, there were white, spooky sponges. There were shrimp frolicking in the depths, and sea cucumbers and anemones. The occasional fish also swam around.
But the bulk of the organisms in the depths were glass sponges. They are relatively rare, can grow up to a metre wide, and some of them can live for several centuries, according to an article about the trip written by National Geographic. The sponges are largely made up of silica, and only a little of their mass is organic matter. They can be said to barely be alive.
Glass sponges and shrimp do not depend on the vents but thrive in the cold depths. Researchers aren’t yet certain exactly which species these are. (Photo: AWI, OFOBS team)
The researchers did not find the diversity of life that has been discovered around hydrothermal vents in other ocean areas.
“There wasn’t much life down there,” says Ramirez-Llodra. “But we’re not exactly sure why yet.”
Hydrothermal vents in the Atlantic and Pacific contain colourful communities of beard worms, clams and crabs that have adapted to the special environment around the vents.
“Most of these have a symbiotic relationship with bacteria and microorganisms that live by chemosynthesis. The bacteria can be inside their bodies or in special organs,” says Ramirez-Llodra.
“Some organisms don’t even have a mouth or digestive system, but only live from what the microbes inside their body produce.”
Ramirez-Llodra says the researchers don’t know yet if there is a similar relationship between organisms around the vents in the Aurora field.
Additional studies of the videos and samples the researchers took will reveal more about the previously unknown environment on the Gakkel Ridge.
Ramirez-Llodra says they will embark on a new expedition later, to take samples even closer to the vents.
Postscript: How refreshing to know about scientists following their curiosity to discover something new about life and the universe. It encourages one about the future in spite of all the crazy talk of climate “crises” or “emergencies”. Best wishes and hopes for an unalarming 2020!
Global Volcanism Program, East Gakkel Ridge at 85°E
The best context for understanding decadal temperature changes comes from the world’s sea surface temperatures (SST), for several reasons:
The ocean covers 71% of the globe and drives average temperatures;
SSTs have a constant water content, (unlike air temperatures), so give a better reading of heat content variations;
A major El Nino was the dominant climate feature in recent years.
HadSST is generally regarded as the best of the global SST data sets, and so the temperature story here comes from that source, the latest version being HadSST3. More on what distinguishes HadSST3 from other SST products at the end.
The Current Context
The chart below shows SST monthly anomalies as reported in HadSST3 starting in 2015 through November 2019. A global cooling pattern is seen clearly in the Tropics since its peak in 2016, joined by NH and SH cycling downward since 2016. In 2019 all regions had been converging to reach nearly the same value in April.
Then NH rose exceptionally by almost 0.5C over the four summer months, in August exceeding previous summer peaks in NH since 2015. Now in the last 3 months that warm NH pulse has reversed sharply. Meanwhile the SH and Tropics bumped upward, but despite that the global anomaly changed little due to strong NH cooling.
Note that higher temps in 2015 and 2016 were first of all due to a sharp rise in Tropical SST, beginning in March 2015, peaking in January 2016, and steadily declining back below its beginning level. Secondly, the Northern Hemisphere added three bumps on the shoulders of Tropical warming, with peaks in August of each year. A fourth NH bump was lower and peaked in September 2018. As noted above, a fifth peak in August 2019 exceeded the four previous upward bumps in NH.
And as before, note that the global release of heat was not dramatic, due to the Southern Hemisphere offsetting the Northern one. The major difference between now and 2015-2016 is the absence of Tropical warming driving the SSTs.
The annual SSTs for the last five years are as follows:
Annual SSTs
Global
NH
SH
Tropics
2014
0.477
0.617
0.335
0.451
2015
0.592
0.737
0.425
0.717
2016
0.613
0.746
0.486
0.708
2017
0.505
0.650
0.385
0.424
2018
0.480
0.620
0.362
0.369
2018 annual average SSTs across the regions are close to 2014, slightly higher in SH and much lower in the Tropics. The SST rise from the global ocean was remarkable, peaking in 2016, higher than 2011 by 0.32C.
A longer view of SSTs
The graph below is noisy, but the density is needed to see the seasonal patterns in the oceanic fluctuations. Previous posts focused on the rise and fall of the last El Nino starting in 2015. This post adds a longer view, encompassing the significant 1998 El Nino and since. The color schemes are retained for Global, Tropics, NH and SH anomalies. Despite the longer time frame, I have kept the monthly data (rather than yearly averages) because of interesting shifts between January and July.
1995 is a reasonable (ENSO neutral) starting point prior to the first El Nino. The sharp Tropical rise peaking in 1998 is dominant in the record, starting Jan. ’97 to pull up SSTs uniformly before returning to the same level Jan. ’99. For the next 2 years, the Tropics stayed down, and the world’s oceans held steady around 0.2C above 1961 to 1990 average.
Then comes a steady rise over two years to a lesser peak Jan. 2003, but again uniformly pulling all oceans up around 0.4C. Something changes at this point, with more hemispheric divergence than before. Over the 4 years until Jan 2007, the Tropics go through ups and downs, NH a series of ups and SH mostly downs. As a result the Global average fluctuates around that same 0.4C, which also turns out to be the average for the entire record since 1995.
2007 stands out with a sharp drop in temperatures so that Jan.08 matches the low in Jan. ’99, but starting from a lower high. The oceans all decline as well, until temps build peaking in 2010.
Now again a different pattern appears. The Tropics cool sharply to Jan 11, then rise steadily for 4 years to Jan 15, at which point the most recent major El Nino takes off. But this time in contrast to ’97-’99, the Northern Hemisphere produces peaks every summer pulling up the Global average. In fact, these NH peaks appear every July starting in 2003, growing stronger to produce 3 massive highs in 2014, 15 and 16. NH July 2017 was only slightly lower, and a fifth NH peak still lower in Sept. 2018.
The highest summer NH peak came in 2019, only this time the Tropics and SH are offsetting rather adding to the warming. Since 2014 SH has played a moderating role, offsetting the NH warming pulses. (Note: these are high anomalies on top of the highest absolute temps in the NH.)
What to make of all this? The patterns suggest that in addition to El Ninos in the Pacific driving the Tropic SSTs, something else is going on in the NH. The obvious culprit is the North Atlantic, since I have seen this sort of pulsing before. After reading some papers by David Dilley, I confirmed his observation of Atlantic pulses into the Arctic every 8 to 10 years.
But the peaks coming nearly every summer in HadSST require a different picture. Let’s look at August, the hottest month in the North Atlantic from the Kaplan dataset. The AMO Index is from from Kaplan SST v2, the unaltered and not detrended dataset. By definition, the data are monthly average SSTs interpolated to a 5×5 grid over the North Atlantic basically 0 to 70N. The graph shows warming began after 1992 up to 1998, with a series of matching years since. Because the N. Atlantic has partnered with the Pacific ENSO recently, let’s take a closer look at some AMO years in the last 2 decades. This graph shows monthly AMO temps for some important years. The Peak years were 1998, 2010 and 2016, with the latter emphasized as the most recent. The other years show lesser warming, with 2007 emphasized as the coolest in the last 20 years. Note the red 2018 line is at the bottom of all these tracks. The black line shows that 2019 began slightly cooler, then tracked 2018, then rose to match previous summer pulses, before dropping the last three months to again match 2018 below other years.
Summary
The oceans are driving the warming this century. SSTs took a step up with the 1998 El Nino and have stayed there with help from the North Atlantic, and more recently the Pacific northern “Blob.” The ocean surfaces are releasing a lot of energy, warming the air, but eventually will have a cooling effect. The decline after 1937 was rapid by comparison, so one wonders: How long can the oceans keep this up? If the pattern of recent years continues, NH SST anomalies may rise slightly in coming months, but once again, ENSO which has weakened will probably determine the outcome.
Footnote: Why Rely on HadSST3
HadSST3 is distinguished from other SST products because HadCRU (Hadley Climatic Research Unit) does not engage in SST interpolation, i.e. infilling estimated anomalies into grid cells lacking sufficient sampling in a given month. From reading the documentation and from queries to Met Office, this is their procedure.
HadSST3 imports data from gridcells containing ocean, excluding land cells. From past records, they have calculated daily and monthly average readings for each grid cell for the period 1961 to 1990. Those temperatures form the baseline from which anomalies are calculated.
In a given month, each gridcell with sufficient sampling is averaged for the month and then the baseline value for that cell and that month is subtracted, resulting in the monthly anomaly for that cell. All cells with monthly anomalies are averaged to produce global, hemispheric and tropical anomalies for the month, based on the cells in those locations. For example, Tropics averages include ocean grid cells lying between latitudes 20N and 20S.
Gridcells lacking sufficient sampling that month are left out of the averaging, and the uncertainty from such missing data is estimated. IMO that is more reasonable than inventing data to infill. And it seems that the Global Drifter Array displayed in the top image is providing more uniform coverage of the oceans than in the past.
USS Pearl Harbor deploys Global Drifter Buoys in Pacific Ocean
The remarkable turnaround in the US economy was achieved despite large and expensive Green efforts to stop economic projects and infrastructure. While needed energy pipelines and power plants remain unbuilt in coastal places like New York and California, the heartland will be a battleground for activists wanting to leave the best sources underground in favor of aboveground dilute and intermittent wind and solar power.
Next year will be a pivotal one for many of Minnesota’s most controversial environmental debates, from mining to climate change and the 2020 elections. Here’s a look at some of the big questions heading into 2020:
File photo courtesy of the Timberjay PolyMet Mining has won state and federal approval to break ground on its $1 billion copper-nickel mine near Hoyt Lakes.
1. Will PolyMet move forward? PolyMet Mining has won state and federal approval to break ground on its $1 billion copper-nickel mine near Hoyt Lakes. But the project now faces serious questions after Minnesota courts put several permits on hold by this year.
First, The Minnesota Court of Appeals ordered a lower court to examine if state regulators hid concerns the federal government had with a key water safety permit. The Court of Appeals is also investigating whether Glencore, the Swiss mining giant that owns a majority of PolyMet’s shares, should be named on state permits, and whether the plan for a tailings dam at the mine is safe enough.
On top of the permit issues, PolyMet’s majority owner Glencore is now facing a bribery investigation in the United Kingdom and is in the midst of a leadership change.
After a year of turmoil, 2020 could be pivotal for a project that has faced 15 years of environmental review and could bring hundreds of jobs to the Iron Range. If built, it would be the first copper-nickel mine in the state.
2. Will the Line 3 pipeline get built?
Another controversial project on the brink of construction is Enbridge’s Line 3 oil pipeline. The Canadian energy company is hoping to build a 337-mile pipeline through northern Minnesota to replace an aging and corroding one that is operating at half capacity. State regulators on the Public Utilities Commission granted the $2.6 billion project a Certificate of Need and approved its route.
In July, however, the Court of Appeals ruled the PUC failed to consider the impact an oil spill could have on Lake Superior’s watershed, setting the project back months. A new environmental assessment was completed earlier this month by the Department of Commerce, modeling a spill into a tributary of the St. Louis River. In a worst case-type scenario, the research found oil would be unlikely to reach Lake Superior.
Final Line 3 Replacement Project routek
The five-member PUC now needs to vote again on whether to approve Line 3, which also needs federal permits from the U.S. Army Corps of Engineers, to move forward.
Opponents of Line 3, who argue building new fossil fuel infrastructure would further contribute to climate change, have protested the Walz administration at many public events and have taken steps to disrupt Enbridge’s existing infrastructure. Will wide-scale protests follow if Line 3 does get approved for construction?
3. Will the Legislature pass any climate change policy?
The 2019 session ended with very little new climate and energy policy, despite a Democratic push to make Minnesota’s power grid carbon-free by 2050 and GOP support for a measure to make it tougher to build new fossil fuel projects.
While 2019 was ultimately focused on writing a two-year budget, such debates could find new life at the Legislature in 2020. Especially since lawmakers will have a healthy pot of unused money from Xcel Energy, from the funds the energy company pays to store nuclear waste in Minnesota.
4. Will there be a showdown over the study of mining near the Boundary Waters?
Ever since the Trump administration canceled a study that could have led to a 20-year ban on copper-nickel mining in the Rainy River watershed, some Democrats have tried to finish the research or at least get the federal government to disclose what it found.
While U.S. Rep. Betty McCollum and others have not been successful in Congress, the state Department of Natural Resources has asked for the information to include in its environmental review of a mine Twin Metals Minnesota wants to build just outside the Boundary Waters Canoe Area Wilderness.
The DNR won’t say if it will proceed with its review if the federal government stonewalls the agency. But the state has left open the possibility of a showdown with the pro-mining Trump administration. “We will request the information, we expect to get it,” Barb Naramore, an assistant DNR commissioner, told reporters. “If for some reason it’s not forthcoming we’ll need to evaluate the implications of that at that point in time.”
5. How will environmental issues play in the 2020 elections?
The 2020 elections carry massive stakes for local environmental issues. If Trump is re-elected, his administration is likely to continue support for Twin Metals. Many of the Democratic frontrunners have said they oppose mining in the Rainy River watershed, including Pete Buttigieg, Bernie Sanders and Elizabeth Warren. Joe Biden has not, although the Obama-Biden administration launched the study on a 20-year mining ban in the Rainy River watershed and took other steps to stymie Twin Metals.
Trump has generally supported pipelines, while Warren and Sanders have also opposed Line 3.
At the Legislature, Republicans would likely need to keep a majority in the state Senate to head off the most aggressive parts of Gov. Tim Walz’s climate change agenda in 2021. While not all DFLers support the governor’s measures, minority Democrats in the Senate recently launched a “Clean Energy and Climate Caucus” with an eye on passing some form of Walz’s legislation.
Roy Clark explains how climate science built an house of cards obscuring the actual physical mechanisms driving observed climate fluctuations. Text of his recent post at WUWT in italics with my bolds.
The basic issue is that there is no such thing as a climate sensitivity to CO2 or any other so called ‘greenhouse gas’. Radiative forcing can politely be described as climate theology – how does a change in the atmospheric concentration of CO2 change the number of angels that may dance on the head of a climate pin? The climate equilibrium assumption was used by Arrhenius in his 1896 estimate of global warming. In this paper he traced the concept back to Pouillet in 1838. Speculation that changes in atmospheric CO2 concentration could somehow cause an Ice Age started with John Tyndall in 1863.
To get to the bottom of the radiative forcing nonsense it is necessary to go back to Fourier in 1827 and start over with the real physics of the surface energy transfer.
The essential part that almost everyone seems to have missed in this paper is the time delay or phase shift between the solar flux and the surface temperature response. The daily phase shift in MSAT can reach 2 hours and the seasonal phase shift can reach 6 to 8 weeks. This is clear evidence for non-equilibrium thermal storage. The same kind of non-equilibrium phase shift on different time and energy scales occurs with electrical energy storage in capacitors and inductors in AC circuits – low pass filters, tank circuits etc.
The equilibrium average climate assumption was used by Manabe and Wetherald (M&W) in their 1967 climate modeling paper. They abandoned physical reality and created global warming as a mathematical artifact of their input modeling assumptions. The rest of the climate modelers followed like lemmings jumping off a cliff. In the 1979 Charney report, no-one looked at the underlying assumptions. The radiative transfer results were reasonable –for the total long wave IR (LWIR) flux at the top and bottom atmosphere – and the mathematical derivation of the flux balance equations was correct. The increase in surface temperature was the a-priori expected result. Radiative forcing and the invalid equilibrium flux balance equations were discussed by Ramanathan and Coakley in 1978. The prescribed mathematical ritual of radiative forcing in climate models was described by Hansen et al in 1981. They also introduced a fraudulent ‘slab’ ocean model and did a bait and switch from surface to weather station temperatures.
The LWIR flux interacts with the surface, not the weather station thermometer at eye level above the ground.
Radiative forcing is still an integral part of IPCC climate models [IPCC, 2013]. Physical reality has been abandoned in favor of mathematical simplicity. Among other things, M&W threw out the Second Law of Thermodynamics along with at least 4 other Laws of Physics. The underlying requirement for climate stability is that the absorbed solar heat be dissipated by the surface. This requires a time dependent thermal and or humidity gradient at the surface.
The starting point for any realistic climate system is that the upward LWIR flux from the top of the atmosphere does not define an equilibrium average temperature of 255 K. Instead it is the cumulative cooling flux emitted from multiple levels down through the atmosphere. The upward emission from each level is then attenuated by the LWIR absorption/emission along the upward path to space [Feldman et al, 2008]. Another fundamental error in the radiative forcing argument is the failure to consider the molecular line width effects. Part of this was due to the band model simplifications that are still used in the climate models to speed up the calculations. The IR flux through the atmosphere consists of absorption and emission from many thousands of overlapping molecular lines, mainly from CO2 and water vapor [Rothman et al, 2005].
As the temperature and pressure decrease with altitude, these lines become narrower and transmission ‘gaps’ open up between the lines. This produces a gradual transition from absorption/emission to a free photon flux to space.
The radiative forcing argument has also obscured the fact that the heat lost to space is replaced by convection, not LWIR radiation. The troposphere is an open cycle heat engine that transports heat from the surface by moist convection. It is stored in the troposphere as gravitational potential energy. As a high altitude air parcel cools by LWIR emission, it contracts and sinks back down through the troposphere. The upward LWIR flux to space is decoupled from the surface by the linewidth effects. The downward LWR flux from the upper troposphere cannot reach the surface and cause any kind of change in the surface temperature. Almost all of the downward LWIR flux reaching the surface originated from within the first 2 km layer of the troposphere and about half of this comes from the first 100 m layer.
Figure 2: Thermal reservoirs, surface energy transfer and thermal storage (schematic). The surface is heated by the sun and cooled by a combination of net LWIR emission, convection and evaporation. Heat is stored below the surface and released over a range of time scales. There is no ‘equilibrium average temperature’. Source: Roy Clark
Near the surface, the lines in the main bands for CO2 and water vapor are sufficiently broadened that they merge into a continuum. There is an atmospheric transmission window in the 8 to 12 micron spectral region that allows part of the surface LWIR flux to escape directly to space. The magnitude of this transmitted cooling flux varies with cloud cover and humidity. The downward LWIR flux to the surface from the broad molecular emission bands provides an LWIR exchange energy that ‘blocks’ the upward LWIR flux from the surface. Photons are exchanged without any net heat transfer.
In order for the surface to cool, it must heat up until the excess absorbed solar heat is removed by moist convection. This is the real cause of the so called ‘greenhouse effect’.
It requires the application of the Second Law of Thermodynamics to the surface exchange energy. There is no equilibrium average climate so there can be no average ‘greenhouse effect temperature’ of 33 K. Instead, the greenhouse effect is just the downward LWIR flux from the lower troposphere to the surface. It can be defined as the downward flux or as an ‘opacity factor’ [Rorsch, 2019]. This is the ratio of the downward flux to the total blackbody surface emission.
The surface temperature has to be calculated at the surface using the surface flux balance. The change in local surface temperature is determined by the change in heat content or enthalpy of the local surface thermal reservoir divided by the specific heat [Clark, 2013a, b]. The LWIR flux cannot be separated from the other flux terms and analyzed independently. The land and ocean surface behave differently and have to be considered separately.
Over land, the various flux terms interact with a thin surface layer. During the day, the surface heating produces a thermal gradient both with the cooler air layer above and the subsurface layers below. The surface-air gradient drives the convection or sensible heat flux. The subsurface thermal gradient conducts heat into the first 0.5 to 2 meter layer of the ground. Later in the day this thermal gradient reverses and the stored heat is released back into the troposphere. The thermal gradients are reduced by evaporation if the land surface is moist. An important consideration in setting the land surface temperature is the night time convection transition temperature at which the surface and surface air temperatures equalize. Convection then essentially stops and the surface continues to cool more slowly by net LWIR emission. This convection transition temperature is reset each day by the local weather conditions.
The ocean surface is almost transparent to the solar flux. Approximately 90% of the solar flux is absorbed within the first 10 m ocean layer. The surface-air temperature gradient is quite small, usually less than 2 K. The excess absorbed solar heat is removed through a combination of net LWIR emission and wind driven evaporation. The penetration depth of the LWIR flux into the ocean surface is 100 µm or less and the evaporation involves the removal of water molecules from a thin surface layer [Hale and Querry, 1972]. These two processes combine to produce cooler water at the surface that sinks and is replaced by warmer water from below. This is a Rayleigh-Benard convection process, not simple diffusion. There are distinct columns of water moving in opposite directions. The upwelling warmer water allows the wind driven ocean evaporation to continue at night. As the cooler water sinks, it carries with it the surface momentum or linear motion produced by the wind coupling at the surface. This establishes the subsurface ocean gyre currents. Outside of the tropics there is a seasonal phase shift that may reach 6 to 8 weeks.
This phase shift can only occur with ocean solar heating. The heat capacity of the land thermal reservoir is too small to produce this effect. In many parts of the world, the prevailing weather systems are formed over the ocean. The temperature changes related to the ocean surface are stored by the weather system as the bulk surface air temperature and this information can be transported over very long distances. Such ocean related phase shifts can be found in the daily climate data for weather stations in places like Sioux Falls SD.
Over the oceans, the wind driven evaporation can never exactly balance the solar heating. This produces the ocean oscillations such as the ENSO, PDO and AMO.
These surface temperature changes are incorporated into the various weather systems and can be seen in the long term climate data, particularly the minimum MSAT. The whole global warming scam is based on nothing more than the last AMO warming cycle coupled into the weather station data [Akasofu, 2010].
Figure 1: Change in wind speed (cm s-1) needed to restore the ocean surface cooling flux when the downward LWIR flux is increased by 2 W m-2 Both the fixed and the temperature dependent LWIR window flux cases are shown.
A fundamental failure of the radiative forcing argument is the lack of any error analysis. Over the last 200 years, the atmospheric CO2 concentration has increased by a little over 120 ppm. This has produced an increase in the downward LWIR flux at the surface of about 2 W m-2 [Harde, 2017]. Over the oceans this is coupled into the first 100 micron layer of the ocean surface. Here it is fully coupled to the wind driven evaporation. Using long term ocean evaporation data from Yu et al, 2008, an approximate estimate of the evaporation rate within the ±30 degree latitude region is 15 Watts per square meter for each change in wind speed of 1 meter per second.
This means that the radiative forcing from an increase of 120 ppm in the CO2 concentration amounts to a change in wind speed of about 13 CENTIMETERS per second.
This is at least two orders of magnitude below the normal variation in ocean wind speed. Similarly, a reasonable estimate of the bulk convection coefficient for dry land is 20 Watts per square meter per degree C difference between surface and air temperature. Here a 2 W m-2 change in convection requires a change of 0.1 C in the surface air thermal gradient.
Once the physics of the time dependent surface energy transfer is restored, global warming and radiative forcing disappear into the realm of computerized climate fiction.
The topic of radiative forcing was recently reviewed in detail by Ramaswamy et al [2019] as part of the American Meteorological Society monographs series. This review provides a good start for a scientific and criminal fraud investigation into the climate modeling fraud. To begin, the scientific community should demand that this particular monograph be retracted and all further work on equilibrium climate modeling be stopped. Any climate model that uses radiative forcing is by definition invalid. There is no need to try and validate the computer code of any equilibrium climate model. The use of radiative forcing alone is sufficient to render the results totally useless. These modelers are not scientists, they are mathematicians playing with a set of physically meaningless equations. They left physical reality behind when they made the climate equilibrium assumption. They are now members of a rather unpleasant quasi-religious cult. They believe that the divine spaghetti plots created by the computer climate models come from a higher authority that the Laws of Physics.
Figure 12: The ocean surface energy balance in the tropical warm pool. The evaporative surface cooling is strongly dependent on the wind speed. Source: Roy Clark
Any realistic climate model must correctly predict the changes in ocean temperature caused by the ocean oscillations. These must then be used to predict the changes in the weather station data.
This must include the minimum and maximum surface air temperatures, surface temperatures and the phase shifts. There are no forcings, feedbacks or climate sensitivities, just time dependent rates of heating and cooling. It is time to welcome the Second Law of Thermodynamics back to the climate models. It has always been part of the Earth’s climate system. [See linked post for references]
Roy Clark’s research studies are available at his website Ventura Photonics
[I just noticed that Quora buried Walker’s 12 point answer to the query, and only shows others’ comments afterward. In order to see the actual response you have to go here: https://www.quora.com/profile/John-Walker-922/answers
and then search for “skeptics”. There are many persuasive exhibits there, perhaps the reason for suppressing the document.]
An extensive and documented reply is given at Quora from John Walker, former Laboratory Medical Director/Pathologist (1984-2011). Excerpts in italics with my bolds.(red text is link).
There are very few individuals who are skeptical that the climate changes. But there are millions and millions of individuals (and growing), who are quite skeptical that human emissions of CO2 are causing apocalyptic global warming, including many scientists, climate scientists, Nobel Laureates, and other highly educated individuals.
The reason for this is multi-factorial and very voluminous. The following presents condensed summaries of 12 of the reasons that so many individuals have become highly skeptical of the theory of CAGW. Even though it is rather long, it represents only a small portion of the information, studies and references engendering skepticism of this unproven assemblage of hypotheses. Most of it is taken from my 250+ page treatise on the fallacies of the theory of CAGW.
1 . First and foremost is the fact that there is currently NO experimental evidence validating the theory of CAGW. Rather CAGW is a collection of unproven/unvalidated hypotheses, which can only be accepted by faith. However, most of these hypotheses have been shown to contain fallacies and/or misinformation.
2 . The “science” behind the theory of CAGW has not been sufficiently rigorous, non-biased, or open, and, crucially, does not comply with the tenets of the scientific method since it is not subject to potential falsification by testing/experiment.
3 . The theory of CAGW is based entirely upon:
a . Atmospheric CO2 versus temperature correlation studies(which are not proof of cause and effect, are partially based upon fictitious/manipulated/estimated temperature data [as in the “hockey stick” graph and altered NASA/NOAA/CRU data], and actually do not correlate all that well):
The original MBH graph compared to a corrected version produced by MacIntyre and McKitrick after undoing Mann’s errors.
b . Partially altered, manipulated, selective, imprecise, incomplete, extrapolated and unverified/fictitious temperature data (as revealed by Climategate, the “Hockey Stick” confutation, and other sources), with frequent measurements selected from urban concrete and asphalt hot spots, naturally producing higher temps, which increase in number over time due to continued urban growth).
“Government reports, writers of opinion pieces, and bloggers posting graphs purporting to show rising or record air temperatures or ocean heat, are misleading you. This is not actual raw data. It is plots of data that have been ‘adjusted’ or ‘homogenized’ (i.e., manipulated) by scientists – or it is output from models that are based on assumptions, many of them incorrect. UK Meteorological Office researcher Chris Folland makes no apologies for this. ‘The data don’t matter. We’re not basing our recommendations [for reductions in carbon dioxide emissions] upon the data. We’re basing them upon the climate models’.” Climate: The Real ‘Worrisome Trend’ (Part I: Faulty Science) – Master Resource
c . Unreliable computer models(based upon partially altered, manipulated, selective, imprecise, incomplete, extrapolated and unverified/fictitious temperature data, woefully inadequate/incomplete input data regarding thousands of climate parameters, and “educated guesses” about the climate sensitivity to atmospheric CO2), which can be programmed to reveal whatever result the programmer desires, and many of which have already been proven incorrect or exaggerated.
d . Insufficient understanding of the role and relative magnitude/sensitivity of CO2 as a “greenhouse” gas,and the unproven (and many would say ludicrous) hypothesis thatthe earth’s atmosphere (with all its enormity, complexity, multiple layers, convection, layers of exceedingly cold air [as low as -60F] and even colder adjacent outer space [-455F] as well as extremely hot (high kinetic energy) upper layers, huge underlying oceans with complex currents and temperature fluctuations, varying molecular compositions, stratospheric ozone [which absorbs both UV and IR radiation], variable humidity, massive heat-absorbing evaporative processes, extensive cloud formations, variably intense winds, the jet stream, varying barometric pressures, cosmic ray effects, and NO glass ceiling or walls) functions identically to a glass-enclosed greenhouse. (Yes, that does seem rather ludicrous!)
5 . Promoters of the theory of CAGW falsely claim there is a 97% “consensus” among climate scientiststhat the theory is true. Indeed the 97% figure is false and based upon poorly contrived surveys/studies by CAGW promoters and “peer-reviewed” (i.e., “pal-reviewed”) by other CAGW promoters. If one reads the original papers where the 97% figure was contrived, it is quite easy to see how poorly designed and biased these surveys were. All of these surveys/studies have been debunked by multiple statistical analyses and better defined and controlled surveys and studies, revealing that less than half of climate scientists believe in the theory of CAGW.
“Claims that a ‘consensus’ exists among climate experts regarding the causes of the modest warming of the past century are contradicted by thousands of independent scientists.” – International Climate Science Coalition Core Principles
The fact is that tens of thousands of scientists, including climate scientists and many Nobel Laureates, do NOT accept the theory of CAGW:[Numerous examples are provided in linked article]
6 . Thus, in essence, CAGW promoters are demanding we accept their conclusions based upon consensus and faith(normally antithetical to most modern liberals’ thinking), just as theocrats and other religious fundamentalists argue. But the inability to follow the rigorous scientific method by the use of repeatable double blind, controlled experiments for validation does not justify acceptance of a theory without such experiments simply because they cannot be performed. It may be fine to accept beliefs by consensus or even by faith on personal or other matters which do not materially affect other people. But those pushing the theory of CAGW are demanding draconian changes affecting everyone on the planet, such as diverting tens of trillions of dollars from solving known existing existential problems (poverty, hunger, violence, war, infectious disease, cancer research, pollution and over-fishing of our oceans, lack of adequate sanitation, education and clean water, etc.) in order to “fight” an unproven future potentially existential problem with costly methods which have not been proven effective, replacing capitalism and democracy with global socialism and authoritarian one world government, and redistributing global wealth. Such actions would be premature, irresponsible, illogical, socialistic, cruel and lead to massive morbidity and mortality!
7 . In addition to the “97% consensus” falsehood, CAGW promoters and alarmists have promulgated many other lies, failed predictions (for both catastrophic global cooling and global warming) based upon their flawed computer models, abundant misinformation and disinformation. If the theory of CAGW is true, why the need to prevaricate? Anyone who is aware of this widespread sophistry must become skeptical of the theory. [Many examples are given in the linked article]
8 . Another clue that the theory of CAGW is fallacious is the fact that many promoters and alarmists so frequently resort to ad hominen attacks or demand that skeptics be banned from discussions.The former is another logical fallacy, which is used when the promoter has no real evidence to back up his/her claim and is unable to respond in a logical and respectful manner. They feel cornered because of their lack of intelligent retort. They hope that such attacks will make the skeptic afraid to make further comments.
Banning and refusing to hear/discuss information contrary to one’s dogmatic belief is characteristic of a fundamentalist who has been indoctrinated, often with propaganda. It is characteristic of religious fanaticism, not science. While it is prohibited under Quora policy, you will discover that some CAGW alarmist authors just can’t stop themselves from indulging in this fallacious and destructive tactic.
Again, this engenders more skepticism in their beliefs.
9 . Climategate.Climategate was a notorious event initiated by leaked emails in 2009 (with a second batch released in 2011) allegedly revealing the deceit and deception practiced by a prominent group of British (Climatic Research Unit or CRU) and American climate researchers (including Michael Mann of Penn State) who promote the theory of CAGW and supply much of the climate and temperature data and reports to the IPCC. The latter gives this group tremendous influence regarding the UN’s climate change agenda.
“There are three threads in particular in the leaked documents which have sent a shock wave through informed observers across the world. Perhaps the most obvious, as lucidly put together by Willis Eschenbach (see McIntyre’s blog Climate Audit and Anthony Watt’s blog Watts Up With That ), is the highly disturbing series of emails which show how Dr Jones and his colleagues have for years been discussing the devious tactics whereby they could avoid releasing their data to outsiders under freedom of information laws.
“But the question which inevitably arises from this systematic refusal to release their data is – what is it that these scientists seem so anxious to hide? The second and most shocking revelation of the leaked documents is how they show the scientists trying to manipulate data through their tortuous computer programmes, always to point in only the one desired direction – to lower past temperatures and to ‘adjust’ recent temperatures upwards, in order to convey the impression of an accelerated warming. This is what Mr McIntyre caught Dr Hansen doing with his GISS temperature record last year (after which Hansen was forced to revise his record), and two further shocking examples have now come to light from Australia and New Zealand.
“The third shocking revelation of these documents is the ruthless way in which these academics have been determined to silence any expert questioning of the findings they have arrived at by such dubious methods – not just by refusing to disclose their basic data but by discrediting and freezing out any scientific journal which dares to publish their critics’ work. It seems they are prepared to stop at nothing to stifle scientific debate in this way, not least by ensuring that no dissenting research should find its way into the pages of IPCC reports.”
10 . The IPCC, which is the primary authority driving the CAGW agenda is a political body, not a scientific body. It’s originating mission was to find human causes of climate change.
“It is to specifically find and report a human impact on climate, and thereby make a scientific case for the adoption of national and international policies that would supposedly reduce that impact.
[Thus, the IPCC has been directed to attribute the cause, or at least significant portions of the cause, of climate change to human influences. If it does not make claims of significant human influence, it’s function would be obviated and its members likely out of their UN jobs!]
“The IPCC is also designed to put political leaders and bureaucrats rather than scientists in control of the research project. It is a membership organization composed of governments, not scientists. The governments that created the IPCC fund it, staff it, select the scientists who get to participate, and revise and rewrite the reports after the scientists have concluded their work. Obviously, this is not how a real scientific organization operates.
11 . Much of the motive behind the promotion of the theory of CAGW is driven by money, power, and politics.Socialists, globalists and radical environmentalists are using the fear of CAGW to convince the world to replace capitalism with authoritative global socialism. The climate change industry now exceeds $1.5 trillion. If “cap-and-trade” legislation is ever passed in the US, as Al Gore, Goldman-Sachs, and other wealthy investors hope, they could potentially make $trillions via the buying and selling of carbon credits on a commodities exchange. Gore and Goldman tried desperately to get such legislation passed during the Obama administration. They were major investors in the Chicago Climate Exchange, which would have been the commodities exchange for carbon credits.
12 . There are better alternative theories regarding the mechanisms that drive the earth’s climate.Most of the theories derive from the observation that the earth’s climate goes through multiple, well-defined cycles (and cycles within cycles) of warming and cooling, and have done so for millennia. They generally involve various changes in total solar radiation reaching the earth and the adiabatic heating of the earth’s atmosphere due to atmospheric pressure. The theory of Cosmoclimatology is gaining credence among many climate scientists and astrophysicists.
Many other theories about the cause of climate change also involve solar influences. Think of the extreme temperature changes that are caused by changes in the amount of solar radiation the earth receives. Just the variation in the tilting of the earth leads to 4 seasons with temperatures varying from over 100 F to minus 20 F (or even colder) between summer and winter months in many locations. Temperatures increase dramatically just by moving towards the equator from higher or lower latitudes, due to differences in solar radiation. Day and night temperatures can easily differ by as much as 30 F or more, all in a 12 hour span. Temperatures on a sunny summer day can drop by 5 F in a matter of seconds if a cloud passes overhead. Compare that to the claimed increase in global temp of 1.4 F over 150 years supposedly caused by anthropogenic CO2.
In addition to the multiple periodic clusterings creating grand solar minima and maxima, there are multiple additional cyclic changes of solar activity, which are being elucidated with continuing climate research (another reason to stop making the absurd, counter-productive and pseudoscientific claim that the “science is settled”). There are centennial and bicentennial cycles of grand solar minima and maxima, along with many other cyclic processes of longer time intervals related to celestial changes:
There have been numerous glacial cycles, each lasting an average of 100,000 years. They coincide with the Milankovitch Eccentricity cycle of the earth’s orbit around the sun. Within each cycle is a period of marked global cooling (lasting from 70k to 90k years in which immense glaciers cover much of the land surface, and much of the ocean surface freezes. The cold periods are followed by interglacial (warm) periods lasting from 10k to 30k years. Some climatologists believe that the Earth is on the downward slope of the current interglacial period and headed towards the next ice age, which could arrive in the next several thousand years. During this downward slope, global temperatures are expected to slowly decrease with intermittent warmer and cooler trends. Milankovitch cycles – Wikipedia
And there is so much more but not enough time and space to present it all.
The term “glittering generality” was impressed on me by an English teacher who red-circled several expressions in my essay with the label “GG”. When I asked what was wrong, she told me pretty much what Wikipedia says:
A glittering generality is an emotionally appealing phrase so closely associated with highly valued concepts and beliefs that it carries conviction without supporting information or reason. Such highly valued concepts attract general approval and acclaim.
Background on Greta’s Pretences
In September Greta spoke to the UN Climate Summit in NYC and attempted to browbeat the world’s leaders into doing something about global warming/climate change. However, she came off as a whiny, spoiled brat throwing a tantrum in public to get her way. Her speechwriters took note of the negative responses and regrouped for her speech to the Madrid COP. The new approach was to elicite the audience’s concern by appealing to a bunch of glittering generalities. H/T to Patrick Moore for leading in the effort to challenge her platitudes. After all, it is irresponsible to let a child get away with telling falsehoods; that only spurs them on to become liars as adults. And teenage is the critical period to learn the dfference between imaginary things and realities, to engage with life’s school of hard knocks rather than retreat into wishdreams and fantasies, drug-induced or othewise.
The title links to a transcript of the climate activist’s message to the UN’s climate conference on Wednesday, December 11, at the United Nations Climate Change Conference COP25 in Madrid, Spain. Excerpts in italics with my bolds, images and comments.
Greta Thunberg: “Hi. A year and a half ago, I didn’t speak to anyone unless I really had to but then I found a reason to speak. Since then, I’ve given many speeches and learned that when you talk in public, you start with something personal or emotional to get everyone’s attention. Say things like, ‘our house is on fire, I wanted to panic or how dare you’.
“But today I will not do that because then those phrases are all that people focus on. They don’t remember the facts, the very reason why I say those things in the first place, we no longer have time to leave out the science.
“For about a year I have been constantly talking about our rapidly declining carbon budgets over and over again. But since that is still being ignored, I will just keep repeating it
“In chapter two, on page 108 in the SR 1.5 IPCC report that came out last year, it says that if we ought to have a 6 percent to 7 percent chance of limiting the global temperature rise to below 1.5C degrees, we had on January 1, 2018, 420 gigatons of CO2 left to emit in that budget. And of course, that number is much lower today as we emit about 42 gigatons of CO2 every year including land use.
“With today’s emissions levels, that remaining budget will be gone within about eight years. These numbers aren’t anyone’s opinions or political views. This is the current best available science.
Heat Waves Compared to Atmospheric CO2
“Though many scientists suggest these figures are too moderate. These are the ones that have been accepted through the IPCC, and please note that these figures are global and therefore do not say anything about the aspect of equity, which is absolutely essential to make the Paris Agreement to work on a global scale.
“That means that richer countries need to do their fair share and get down to real zero emissions much faster and then help poorer countries do the same, so people in less fortunate parts of the world can raise their living standards. These numbers also don’t include most feedback loops, nonlinear tipping points, or additional warming hidden by toxic air pollution.
Atlantic Storm Activity Compared to Atmospheric CO2
“Most models assume, however, that future generations will somehow be able to suck hundreds of billions of tons of CO2 out of the air with technologies that do not exist in the scale required and maybe never will. The approximate 6 percent to 7 percent chance budget is the one with the highest odds given by the IPCC. And now we have less than 340 gigatons of CO2 left to emit in that budget to share fairly.
[Let’s deconstruct Greta’s cabon budget “science.” It is math alright, but she apparently lacks the will or critical intelligence to challenge the stack of suppositions underneath.
Assume that Global Mean Temperatures (GMT) are driven by rising CO2 in the air.
Assume that Rising CO2 comes entirely from burning fossil fuels.
Assume that keeping CO2 below 450ppm limits warming to 2C over preindustrial.
Assume that keeping CO2 below 430ppm limits warming to 1.5C over preindustrial.
Assume that GMT warming over 1.5C will cause dangerous weather events.
Assume that future warming of 2C will not benefit mankind as did the last 2C since the LIA.
The Longest Temperature Record compared to CO2 Emissions.
“Why is it so important to stay below 1.5 degrees? Because even at one degree people are dying from the climate crisis. Because that is what the United Science calls for to avoid destabilising the climates.
[What’s this, a new US? The United States is a thing, United Science, not so much.]
In Fact, fewer and fewer people are dying from climate events.
“So that we have the best possible chance to avoid setting off irreversible chain reactions such as melting glaciers, polar ice and thawing Arctic permafrost. Every fraction of a degree matters. So there it is, again. This is my message. This is what I want you to focus on.”
“So please tell me, how do you react to these numbers without feeling at least some level of panic? How do you respond to the fact that basically nothing is being done about this without feeling the slightest bit of anger? And how do you communicate this without sounding alarmist? I would really like to know.
“Since the Paris Agreement, global banks have invested 1.9 trillion US dollars in fossil fuels. One hundred companies are responsible for 71 percent of global emissions.
“The G20 countries account for almost 80 percent of total emissions. The richest 10 percent of the world’s population produce half of our CO2 emissions, while the poorest 50 percent account for just one-tenth. We indeed have some work to do but some more than others.
“Recently, a handful of rich countries pledged to reduce their emissions of greenhouse gases by so-and-so many percent by this or that date or to become climate neutral or net zero in so-and-so many years. This may sound impressive at first glance but even though the intentions may be good, this is not leadership.
“This is not leading. This is misleading because most of these pledges do not include aviation, shipping, and imported and exported goods and consumption. They do, however, include the possibility of countries to offset their emissions elsewhere.
“These pledges don’t include the immediate yearly reduction rates needed for wealthy countries, which is necessary to stay within the remaining tiny budget. Zero in 2050 means nothing, if high emission continues even for a few years, then the remaining budget will be gone.
“Without seeing the full picture, we will not solve this crisis. Finding holistic solutions is what the cup should be all about, but instead, it seems to have turned into some kind of opportunity for countries to negotiate loopholes and to avoid raising their ambition.
Area Burned by Forest Fires Compared to CO2 Emissions.
“Countries are finding clever ways around having to take real action. Like double-counting emissions reductions and moving their emissions overseas and walking back on their promises to increase ambition or refusing to pay for solutions or loss of damage. This has to stop.
“What we need is real drastic emission cuts at the source but of course, just reducing emissions is not enough. Our greenhouse gas emissions has to stop. To stay below 1.5 degrees. We need to keep the carbon in the ground. Only setting up distant dates and saying things which give the impression of the action is underway will most likely do more harm than good because the changes required are still nowhere in sight.
“The politics needed does not exist today despite what you might hear from world leaders. And I still believe that the biggest danger is not inaction. The real danger is when politicians and CEOs are making it look like real action is happening when in fact almost nothing is being done apart from clever accounting and creative PR.
US Droughts and Flooding Compared to Atmospheric CO2.
“I have been fortunate enough to be able to travel around the world. And my experience is that the lack of awareness is the same everywhere, not the least amongst those elected to lead us. There is no sense of urgency whatsoever. Our leaders are not behaving as if we were in an emergency.
“In an emergency, you change your behaviour. If there is a child standing in the middle of the road and cars are coming at full speed, you don’t look away because it’s too uncomfortable. You immediately run out and rescue that child.
“And without that sense of urgency, how can we, the people understand that we are facing a real crisis. And if the people are not fully aware of what is going on, then they will not put pressure on the people in power to act. And without pressure from the people, our leaders can get away with basically not doing anything, which is where we are now. And around and around it goes.
“Well, I’m telling you, there is hope. I have seen it but it does not come from the governments or corporations. It comes from the people.
“The people who have been unaware but are now starting to wake up. And once we become aware, we change. People can change. People are ready for change. And that is the hope because we have democracy and democracy is happening all the time.
“Not just on election day but every second and every hour. It is public opinion that runs the free world. In fact, every great change throughout history has come from the people. We do not have to wait. We can start the change right now.
Dr. Arnd Bernaerts in a recent article provides the historical context necessary to get our bearings straight despite today’s overheated, bizarre media-drenched tirades.
As he explains, climate has always been particular and personal, not global or objective. And that has led us into our current impasse, unable to talk productively about weather and climate. It is as though we can not come to grips with the climate issue because our very language and terminology is itself a prior problem preventing any progress. In brief, the terms “weather” and “climate” are loaded with emotion, but not with clear, definitive scientific meaning. IOW plenty of connotation (heat) and very little denotation (light). Dr. Bernaerts faults scientists for failing to develop a rational framework for discovery and research, and instead opting for an activist agenda which benefits from the ambiguity and misrepresentation.
Since the last half of the 20th Century the world has a big problem. Science abuses the laymen terms used since time immemorial: weather and climate. Each term is connected closer to our bodies than our shirts, 24/7 throughout our lives. Alexander von Humboldt (1769 –1859), the great German naturalist and geographer defined climate as ‘all the changes in the atmosphere that perceptibly affect our organs’. According to A.v.Humboldt, ‘climate’ was even closer to the skin of any person than their clothing during day and night. Intellectuals in those days lived closer to nature than academics nowadays.
Climate is the imaginary idea of an individual person from a possible state of the atmosphere, at one place or in one region, about a shorter or longer period of time from own experience or narrative of others or e.g. out of Guidebooks. This means: More than 5 billion adults are living on Earth, and:
Everyone has their own view of climate and describes it corresponding to his own ideas, for the moment or the given circumstances.
During A. v. Humboldt’s lifetime, meteorology was emerging and still at a low level. Now for more than 100 years acknowledged as an academic discipline, scientists remained incapable to tell what ‘climate’ is, indicating their incompetence to formulate terms, without which nothing is explained and is completely useless for scientific research. In the early 20th Century climate was defined as average weather and in the 1930s, the thirty-year period from 1901 to 1930 considered as the baseline for measuring climate fluctuations. Several decades later the prominent meteorologist H.H. Lamb regarded the definition of climate as “average weather” quite inadequate, mentioning that until recently climatology was generally regarded as the mere dry-as-dust bookkeeping end of meteorology (FN. 1). Also the well-known F. Kenneth Hare wrote in 1979: You hardly heard the word climate professionally in the 1940s. It was a layman’s word. Climatologists were the halt and the lame (FN. 2).
As a daily slang word, climate is closer to everyones’ skin than their shirts, it is an abuse every time a scientist uses it. This is presumably a major reason that the climate-change debate has been getting more and more hysterical during the last decades.
But the story gets even worse, completey preposterous, when asking how IPCC defines “weather”. The result is shocking; the Glossary of IPCC offers nothing. But IPCC and other institutions, like the recent UN Climate Change Conference COP 25 (2 – 13 December 2019) in Madrid, do not care.
Even the definition of weather in the AMS – Glossary (American Meteorological Society) does not provide a usable solution, by explaining that:
Popularly, weather is thought of in terms of temperature, humidity, precipitation, cloudiness, visibility, and wind, and
the “present weather” table consists of 100 possible conditions, and
the “past weather”; of 10 possible conditions.
The AMS Glossary does not clear the matter, as it is superficial on several aspects. Already false is the explanation of ‘popularly weather’. The layman is able to use and explain the current weather in presumably several hundred versions, and ‘popularly weather’ is extremly far away from a transparent and workable academic term, as explained above.
It is naive not to realize that if you define climate as average weather, you have to say clearly what weather is. Weather has to be defined first. Meteorology has always ignored this point or – meanwhile – making nebulous statements about it.
Actually it is fair to say that the layman understanding and use of the word “weather” is closer to the following description:
Weather is a personal rating by any person over the condition of the atmosphere, in its various manifestations, at a certain time, usually for the current situation or in temporal proximity.
With such an explanation the story is close to the understanding in ancient Greek, and how A. v. Humboldt (1769 –1859) approached the matter.
The failure of science is that it uses layperson terms, but cannot define them transparently. No wonder that there now are the movements ‘Fridays for Future’ and ‘Extinction Rebellion’, and a discussion at a hysterical level. But science seems happy with the situation, which they have caused. Their prominence grows, the money is coming in; they are able to influence long term political decisions. The biggest tragedy in the whole scenario is that the undeniable rise in temperatures since the mid-19th Century, is discussed on the most superficial childish level.
Folks, keep your way of using the terms: weather and climate, as you have always done, and do not allow scientists to abuse them for selfish reasons.
Thanks to Andreas Müller for writing at his blog hintermbusch on four key presentations at the EIKE Climate Conference on Nov. 23, 2019. As many have read, eco-terrorists forced the sessions out of the scheduled venue, but the gatherings went on elsewhere. So much for dialogue in search of scientific truth. Here are some excerpts in italics with my bolds to encourage readers to read his informative report. (link in red above).
In this blog post, I summarize these lectures and add links to the video clips for you to follow the lectures on your own and in full detail (Only the first talk was in German and is not easily accessible for most of the international public).
Christian Schlüchter, Switzerland
Prof. em. Christian Schlüchter is a geologist and has studied the glaciers of the Alps in great detail. He reports the findings of very old timber in and below glaciers and what those trees taught him about the glacial epochs of the Alps.
One of the most intuitive finds of Schlüchter’s is this huge tree trunk, found at a glacier tongue (see the most beautiful glacier snout behind!).
This place nowadays is clearly above the limit of vegetation and still there is this tree which attracted Schlüchter’s curiosity and fuelled his research: How old is it? Where and under what conditions has it grown and why is it here.
The key message from his slides is that all of these records were left in times when the alpine glacier extent was smaller than in 2005.
Warm periods: more life
The timberline was at least 300 meters higher which indicates a minimum of 1.8° C higher temperatures. An example of this gives Hannibal, who managed to cross the Alps with elephants because the higher regions were much less covered by ice than in recent centuries.
Warm periods: more civilization
As his summary, Schlüchter gave the following facts:
More than 50% of the last 11000 years alpine glaciers were smaller than 2005
This fact he baptized, “dominance of the Hannibalistic world”
Alpine glaciers have shown huge dynamics
Events of glacier growth were fast and short
The little ice age (from the end of the medieval warm period to about 1850) was the longest glacier extension since the last ice age 12000 years ago
Every warming followed an accelerated glacier growth
Nicola Scafetta, Italy
Nicola Scafetta is an italian physicist und climate modeller who works at Naples university. He is well-known for his criticism of IPCC climate models and, of course not uncontested for creating his own climate models and comparing them to IPCC results. His talk in Munich again took aim at the weaknesses und faults of IPCC climate models.
He notes that the models tend to reproduce the notorious “hockeystick” shape and therefore fail at the medial warming bump! (This is an echo of a very old climate change controversy, documented here).
He also shows similar failures for longer periods and demonstrates that the ulimate reason for this is that the models are not capable of reproducing climate variations which follow periodic solar activity.
Therefore, ten years ago, he contrasted his own model forecasts, which take those into account, (black line) to those of the IPCC (dashed blue line), which leads to the climax of the talk Below is an upadated graph of his 2010 projections (cyan color) compared to observations and to IPCC models (green).
Nir Shaviv, Israel
Nir Shaviv is a well-known but moderate climate skeptic. Besides the lecture on alpine glaciers by Christian Schlüchter, he was my main reason to choose this half day from the conference program. Shaviv continued where Scafetta had ended and discussed the IPCC world and its errors.
For a start, he presented its lines of thinking:
Next, he discussed the validity of each building block, marked the errors und deconstructed the standard picture. He emphasized that the climate sensitivity of CO2 is a priori unknown and largely overestimated by the IPCC. He judged it a severe shortcoming that other forcings than green house gases are ruled out by the IPCC: the sun!
He pointed out that the IPCC overestimates climate sensitivity of CO2 at the expense of solar influences. While IPCC modelers managed to hide this for 20th century data, it will lead to a serious overestimate of temperatures in the 21st when solar influences will be cooling. He therefore expects a much lower temperature rise than predicted by the IPCC, a modest (and manageable) one:
Using physical arguments Shaviv manages to set an upper limit for the climate sensitivity of CO2. This should convince the audience to accept additional forcings behind the 20th century temperature rise. Like Scafetta he points at a solar driven forcing.
Henrik Svensmark, Denmark
Henrik Svensmark is a Danish physicist und climate researcher. As other speakers he reports that he finds it more and more difficult to raise funds for his research because its results contradict the IPCC position:
By experiments and also by correlation measurements Svensmark has investigated this mechanism of cloud creation by cosmic rays. This is interesting because IPCC researchers cite reduction of cloud creation by global warming as a possible positive feedback mechanism which could escalate global warming to catastrophic levels. Svensmark assumes that it provides a way how solar activity, via its solar winds, has a climate impact on the earth which adds to the direct impact of solar irradiation to the earth.
Scientific summary
As a physicist I found all 4 talks interesting. They demonstrate that real and sophisticated science on climate was presented at that conference. Nothing suggests that this is less serious or valid science than anything I experienced during my time as a master and Ph.D student in physics. The presented results make it seem rather improbable that the climate models of the IPCC are complete, beyond any doubt or worth a 97% consensus.
The image above, supported by the table later on shows that in December ice has recovered in the central Arctic with open water found only on the margins, as is typical this time of year. The animation shows progression of ice extent from Dec. 1 to Dec. 22, 2019.
Most dramatic is Hudson Bay on the left filling in over these 3 weeks, from 445k km2 up to 1214k km2, 96% of maximum. At the top, Chukchi Sea also ices over, from 589k km2 to 933k km2, 97% of max. Above Chukchi is Bering Sea just starting with fast ice, and Okhotsk upper right growing ice as usual. The two places lagging behind in ice recovery are Bering Sea and Baffin Bay.
The graph below shows the ice extent growing during December compared to some other years and the 12 year average (2007 to 2018 inclusive).
Note that the NH ice extent 12 year average increases almost 2M km2 during December, up to 13.1M km2. MASIE 2019 shows a faster icing rate, starting 600k km2 lower than average and now down 200k km2, or 1.5%. MASIE and SII are tracking quite closely this month. By month end all years appear to be converging on the 12-year average.
Region
2019356
Day 356 Average
2019-Ave.
2010356
2019-2010
(0) Northern_Hemisphere
12428357
12623541
-195184
12257118
171239
(1) Beaufort_Sea
1070223
1070266
-42
1070445
-222
(2) Chukchi_Sea
933276
953650
-20374
964317
-31041
(3) East_Siberian_Sea
1087137
1087133
4
1087137
0
(4) Laptev_Sea
897845
897842
3
897845
0
(5) Kara_Sea
929742
864955
64786
934937
-5195
(6) Barents_Sea
447093
358194
88899
607130
-160037
(7) Greenland_Sea
533666
562497
-28831
579647
-45980
(8) Baffin_Bay_Gulf_of_St._Lawrence
751185
924722
-173536
630041
121144
(9) Canadian_Archipelago
854282
853082
1201
853214
1068
(10) Hudson_Bay
1213848
1199010
14839
767479
446370
(11) Central_Arctic
3225391
3199892
25499
3244808
-19417
(12) Bering_Sea
147493
312873
-165379
219969
-72475
(13) Baltic_Sea
11462
20025
-8564
100363
-88902
(14) Sea_of_Okhotsk
324167
306066
18101
283712
40455
The table shows where the ice is distributed compared to average. Bering Sea and Baffin Bay have the only large deficits to average, while Kara and Barents Seas are in surplus.
Footnote: Interesting comments today by Dr. Judah Cohen at his blogregarding the Arctic fluctuations. Excerpts with my bolds.
I have said many times the first thing that you learn as a seasonal forecaster is humility and these are one of those times. What is humbling me at the moment is that I have expected a weakening of the stratospheric polar vortex (PV) based on fall Arctic predictors – extensive Siberian snow cover, more limited Arctic sea ice extent and a relatively warm Arctic. Following the PV weakening or disruption, severe winter weather would be more frequent at least regionally across the mid-latitudes of the Northern Hemisphere (NH). But to be honest it is hard to see from today’s viewpoint how this verifies. And as I have shared on Twitter the new operational GFS, the FV3, has been especially bullish on a strong PV.
The biggest challenge that I see right now is the center of low mid-tropospheric heights currently just north of Alaska and is expected to expand in breadth over the next two weeks enough so to fill the entire Arctic basin. This a fairly class pattern of low heights in the Arctic and high heights in the mid-latitudes resulting in a cold Arctic/warm continents pattern, all consistent with a positive AO. It seems a bit ironic (at least to me) that with the record low sea ice in the Chukchi-Bering seas this fall, the incredibly warm year Alaska just experienced both in part due to persistent ridging in the region, this same region is predicted to now experience an extended period of low heights and below normal temperatures. As an aside, this is something that I had a hard time anticipating even just a few weeks ago.
So, for now I remain steadfast in the winter forecast that based on high fall snow cover/low Arctic sea ice that they will in tandem perturb the PV. Given the westerly quasi-biennial oscillation (QBO) I expect a scenario somewhere between winter 2016/17 and winter 2017/18. Both of those winters were westerly QBO winters and the most significant disruption of the stratospheric PV took place in February.
Illustration by Eleanor Lutz shows Earth’s seasonal climate changes. If played in full screen, the four corners present views from top, bottom and sides.
In approximately half an hour, Senator McConnell did what so many Democrats have claimed to do over these last several weeks: He meticulously applied the Constitution and historical precedent to the facts at hand and to the articles of impeachment the House passed on Wednesday.
Let’s start with the fact that Washington Democrats made up their minds to impeach President Trump since even before he was inaugurated. Here’s a reporter in April of 2016—April of 2016! “Donald Trump isn’t even the Republican nominee yet. But impeachment is already on the lips of pundits, newspaper editorials, constitutional scholars, and even a few members of Congress.”
Justifications for impeachment included rude behavior to professional athletes and reporters, changing Obama’s policy on transgender in the military. “A few months ago,” McConnell added, “Democrats’ three-year-long impeachment in search of articles found its way to the subject of Ukraine. House Democrats then embarked on the most rushed, least-thorough impeachment inquiry in modern history.”
McConnell then contrasts the “Get Trump” effort to the “mountains of evidence” gathered in both the Nixon and Clinton processes. The Nixon impeachment process required 14-months of hearings in addition to a special prosecutor. The Clinton impeachment followed years of an independent counsel investigation.
“House Democrats’ rushed and rigged process produced two articles of impeachment [which] are fundamentally unlike any articles that any prior House of Representatives have ever found,” McConnell explained. Article I involves the “timing of aid to Ukraine.” But the articles do not even purport to allege an actual crime. “Instead, they deploy the vague phrase ‘abuse of power’ to impugn the president’s actions in a general and indeterminate way.”
The Democrats might not be required to allege a crime, but McConnell warned, “history matters and precedent matters. And there were important reasons why every previous House of Representatives in American history restrained itself . . . from crossing the Rubicon.”
The vagueness of the “abuse of power” article is effectively a “mal-administration” charge rejected by the Constitution’s Framers because it would so easily be used to attack presidents over policy differences. If the Democrats are successful, all presidents henceforward will be impeached whenever the opposition party achieves power in the House.
“So there were powerful reasons why every House of Representatives for 230 years . . . required presidential impeachment to revolve around clear, recognizable crimes,” McConnell said. “That 230-year tradition died last night.”
Of the second article of impeachment, “Obstruction of Congress,” McConnell said, “What it really does is impeach the president for asserting executive privilege . . . a two-century-old constitutional tradition.” Presidents beginning with Washington have invoked it and courts repeatedly have recognized it. The House requested extraordinarily sensitive information—exactly the type of requests against which presidents from both parties have asserted privilege.
“It’s not a constitutional crisis for a House to want more information than a president wants to give up,” McConnell said. “That’s not a constitutional crisis! It’s a routine occurrence. Separation of powers is messy—by design. Here’s what should have happened . . . either the president and Congress negotiate a settlement or the third branch of government, the judiciary, addresses the dispute between the other two.”
That’s what happened in both the Nixon and Clinton impeachment inquiries. In both instances, the House went to court to resolve the disputes.
Following this process, “takes time, it’s inconvenient,” the majority leader said. “That’s actually the point. Due process is not meant to maximize the convenience of the prosecutor. It’s meant to protect the accused.”
McConnell shot down the suggestion that the Senate should force the president to give up more information to facilitate the trial. As I recently wrote (perhaps McConnell is a reader), impeachment means “ready for trial.” It’s not the proper role of the Senate to investigate and impeach the president. “Nobody made Chairman Schiff do this,” McConnell said of Schiff’s decision to forego court assistance to overcome the president’s lack of cooperation with the probe. “In Nixon, the courts were allowed to do their work. In Clinton, the courts were allowed to do their work.”
But these House Democrats, he added, “decided that due process is too much work.”
McConnell further challenged House Intelligence Committee Chairman Adam Schiff’s attempt to bully the executive branch out of asserting executive privilege. He quoted Schiff saying, “any action that forces us to litigate . . . will be considered further evidence of obstruction of justice.”
What the Democrats are trying to say, in effect, is that if the president asserts his constitutional rights, it’s just that much more evidence that he’s guilty.
McConnell further explained how the House impeachment effort harms separation of powers by attempting to make the president serve at the pleasure of Congress. But the process also infringes upon the Senate as an independent body.
The House can follow whatever process it chooses for impeachment. But it is now attempting to dictate how the Senate discharges its duties. The House has made a “demand that this body redo House Democrats’ homework for them. That the Senate should supplement Chairman Schiff’s work to make it more persuasive.” Further, the House could effectively swamp the Senate whenever it wants by passing flimsy impeachment articles to force a Senate trial.
Quoting Pelosi’s now-abandoned warnings that impeachment should not be done without an overwhelming and bipartisan case, McConnell said, “by the speaker’s own standard . . . she has failed the country. The case is not compelling, not overwhelming, and as a result not bipartisan.”
The weakness of the Democrats’ case is demonstrated by Senate Minority Leader Chuck Schumer’s calls to supplement the House’s shoddy work with new Senate-led investigations. And now, McConnell observed, it appears that the House is too afraid to send the articles of impeachment to the Senate where they rightly fear they will lose their case.
“It looks like the prosecutors are getting cold feet in front of the entire country,” McConnell added. “The articles aren’t just unproven, they’re also constitutionally incoherent.” If the Senate blesses either of these articles, “we will invite the impeachment of every future president.”
Pelosi was shell-shocked. Watch her stammer during her own press conference just a few minutes after McConnell concluded his speech. A friendly reporter asked whether the Republicans might accuse the House of playing games by holding onto the impeachment articles too long. Pelosi mumbled something about needing to know Senate trial procedures before she could appoint House managers. It’s a nonsense argument that she can’t even explain.
Trump Strikes Back:
The Democrats have their impeachment. There will be no Trump surrender. There’s nothing left for them to do but begin the long retreat.


 The best context for understanding decadal temperature changes comes from the world’s sea surface temperatures (SST), for several reasons:


 5. How will environmental issues play in the 2020 elections?


 The term “glittering generality” was impressed on me by an English teacher who red-circled several expressions in my essay with the label “GG”. When I asked what was wrong, she told me pretty much what Wikipedia says:
 “For about a year I have been constantly talking about our rapidly declining carbon budgets over and over again. But since that is still being ignored, I will just keep repeating it

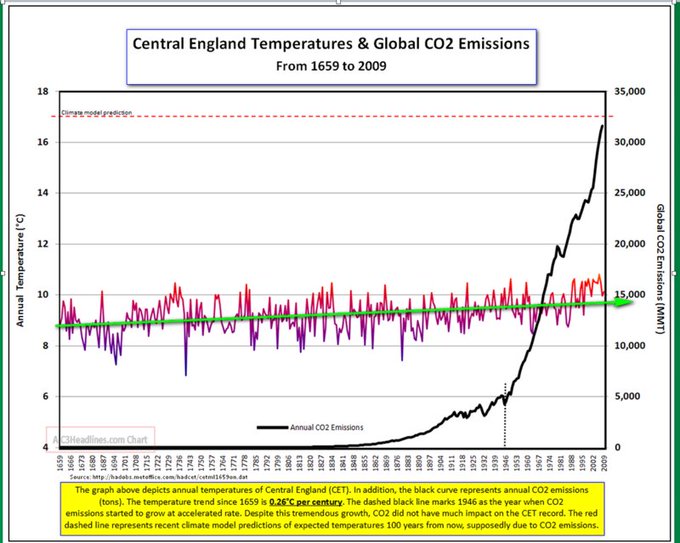


 McConnell further challenged House Intelligence Committee Chairman Adam Schiff’s attempt to bully the executive branch out of asserting executive privilege. He quoted Schiff saying, “any action that forces us to litigate . . . will be considered further evidence of obstruction of justice.”