An important test of “institutional neutrality” — a pillar of campus free speech — is now playing out in North Carolina, where the University of North Carolina Asheville (UNCA) recently chose to divest a portion of its endowment from companies selling “fossil fuels” (coal, oil, and natural gas).
Institutional neutrality means that universities should avoid taking official political stands at the institutional level, such as divestment from fossil fuels, since such actions tend to pressure faculty and students holding contrary views into silence. This is particularly true for public universities such as UNCA, for they belong to every citizen of the state.
What makes the UNCA test case especially important is that two years ago North Carolina passed HB 527, one of the first comprehensive campus free-speech laws in the country. HB 527 not only affirms institutional neutrality as a foundational principle of campus free speech at UNC schools, it mandates that an annual report by a committee of the UNC Board of Governors (which oversees the entire state university system) weigh in on any “difficulties, controversies, or successes in maintaining a posture of administrative and institutional neutrality with regard to political or social issues.”
The question now is how the annual report, due in September, will handle this decision by a public university to throw in its lot with the fossil-fuel-divestment movement. More broadly, the question is whether the UNC Board of Governors will act to halt and reverse this clear violation of institutional neutrality by UNC Asheville. Students and administrators at UNCA intend their move to pressure the entire UNC system to divest. That means the UNC Board of Governors’ response to UNCA’s divestment bandwagon will have an enormous impact on the survival of institutional neutrality at every public campus in the state.
Students and faculty at public universities have every right to take whatever stand they like on issues like fossil-fuel divestment, climate change, and the Green New Deal. It is precisely the neutrality of public universities at the official institutional level that supports and guarantees the ability of individual faculty and students to freely speak their minds on these issues. Public universities shouldn’t have an official political line. We wouldn’t tolerate a public university endorsing Bernie Sanders, Kamala Harris, or Donald Trump for president. Nor should a public university throw its official institutional weight behind a thoroughly political movement whose aims are the subject of active, widespread, and unresolved public debate, particularly when state law cites the principle of institutional neutrality as an essential component of campus free speech.
True, UNC Asheville is known to lean heavily to the left, but that does not matter. After all, there are conservative students there as well; there is no political litmus test required and UNCA must remain open to all points of view. An institutional decision to divest from fossil fuels is like a neon sign flashing: “Conservatives need not apply.” Divestment purports to settle a political argument that students ought to be having with each other.
Determining whether a particular policy stand violates institutional neutrality always entails a degree of judgement. HB527 doesn’t ban institutional policy stands outright, because complete neutrality is impossible. Universities have to be able to advocate for a tuition increase, for example. That’s why North Carolina’s campus free speech law leaves it up to the system’s Board of Governors to weigh in on potential violations of neutrality. Nonetheless, it’s tough to see how a state that has enshrined the principle of institutional neutrality in law can fail to condemn fossil fuel divestment by a public university.
HB 527 begins by citing the University of Chicago’s famous 1967 Kalven Report as the classic articulation of the neutrality principle. While the Kalven Report acknowledges that there may be rare exceptions, it establishes a “heavy presumption against the university taking collective action or expressing opinions on the political and social issues of the day.” Such a stand, the report says, comes “at the price of censuring any minority who do not agree with the view adopted.” The Kalven Report emphasizes that the university “is not a lobby,” but instead must “maintain an independence from political fashions, passions, and pressures.” And universities do this precisely because they are obligated “to provide a forum for the most searching and candid discussion of political issues.” In other words, neutrality at the official institutional level encourages and makes possible free debate by members of the campus community. Or, as the Kalven Report puts it, “the instrument of dissent and criticism” is not the university but “the individual faculty member or the individual student.”
In 2015, President Robert Zimmer of the University of Chicago, renowned for his support of campus free speech, invoked the Kalven Report to explain why his school would not divest from fossil fuels. When student advocates of divestment pointed out that even the Kalven Report allows for exceptions in certain circumstances, Zimmer said fossil fuel divestment was not such a case.
“We should … be very wary of steps intended to instrumentalize our endowment in ways that would appear to position the University as a political actor rather than an academic institution. Conceiving of the endowment not as an economic resource, but as a tool to inject the University into the political process or as a lever to exert economic pressure for social purposes, can entail serious risks to the independence of the academic enterprise. The endowment is a resource, not an instrument to impel social or political change.”
UNC Asheville, in contrast, touts its decision to divest from fossil fuels as a “groundbreaking” move designed to lend “momentum” to a “movement” that it hopes will sweep the entire UNC system. UNCA Chancellor Nancy J. Cable called the decision “a defining moment” for the university. That’s the problem. Fossil-fuel divestment sends out a message that identifies the university on the official institutional level with a political movement that excludes — and is even directly at odds with — roughly half the taxpayers and potential students in North Carolina.
UNC Asheville is open about the fact that its decision was a direct response to student pressure for divestment.
And the political nature of the UNCA student fossil fuel divestment movement is evident. An opinion piece by leaders of UNCA Divest three months before the school’s final divestment decision, for example, positioned divestment as a repudiation of President Trump. Meanwhile, the UNCA school paper reports that many conservatives “feel like outcasts on campus.” How can UNC Asheville’s divestment decision fail to intensify and confirm that feeling, further chilling conservative speech? If anything, the school ought to be making of point of welcoming a wide range of student views on political issues.
Has UNC Asheville even thought about how its divestment decision might endanger free speech by creating an official university ideological line? Has it contemplated its decision in light of the new state law? Is the very concept of institutional neutrality and its importance for free speech even on the UNCA administration’s radar? Apparently not. In an excellent account of the UNCA neutrality controversy, Jay Schalin of North Carolina’s James G. Martin Center for Academic Renewal reports that when asked whether divestment was at odds with the principle of institutional neutrality, UNCA issued a bland statement that failed even to address the question.
It’s evident that UNC Asheville’s decision to divest from fossil fuels was taken without any regard for the neutrality issue in general, or for the new state law in particular.
At this point, it’s tough to see how the forthcoming annual report mandated by HB 527 can fail to condemn UNC Asheville’s decision to divest from fossil fuels. The committee of the UNC Board of Governors charged with issuing the report is legally obligated to address controversies over institutional neutrality, and this is certainly such a controversy. On the face of it, fossil fuel divestment violates the principles of neutrality set forth in the University of Chicago’s Kalven Report, which is cited as authoritative by the new law. After all, the University of Chicago itself currently cites the Kalven Report to explain why it won’t divest from fossil fuels, and Harvard has made effectively the same argument. How much more is it vital for a public university to uphold institutional neutrality, given that the UNC system serves citizens in a state where the full range of American political views is robustly represented? Why should the taxpayers of North Carolina support institutions that turn themselves into political actors? It’s also perfectly clear that UNCA’s divestment decision was taken without any serious regard to the neutrality issue, much less the new law. In short, to allow UNC Asheville’s divestment decision to pass without condemnation in the annual oversight report would be to violate the fundamental intent of HB 527.
North Carolina must prevent the thoroughgoing politicization of an important state university system by upholding institutional neutrality — one of the central pillars of campus free speech and a principle now enshrined in North Carolina state law. If UNC Asheville’s fossil fuel divestment decision holds — or worse, spreads as planned through the entire UNC system — the clear intent of HB 527 will have been violated, and the system’s Board of Governors will have failed to protect the state’s students from unwanted, unneeded, and thoroughly inappropriate ideological pressure.If, on the other hand, the UNC system reverses Asheville’s divestment decision and literally lays down the law on institutional neutrality, it will confirm North Carolina’s reputation as a leader of the movement to restore free speech at America’s public colleges and universities. We should know more by September, when the Board of Governors’ committee report is due.
Footnote Update July 31, 2019
Reuters provides additional evidence that climate opinions are divided along political lines. H/T GWPF
Reuters reports that a poll it did with Ipsos shows “Democrats are far more likely to believe droughts, floods, wildfires, hurricanes and tropical storms have become more frequent or intense where they live in the last decade”. And of course polls are likely to show wide disagreement on all manner of subjects, especially among political partisans. But even in these broad-minded times, there’s one thing we should all agree on: If two people argue about whether, say, hurricanes have become more frequent or intense where they live, they can’t both be right and it is possible to check.
Reuters agrees, rejecting fashionable relativism on this topic at least. Nevertheless you can guess which side it thinks is right: it sides with the Democrats. “U.S. government researchers have concluded that tropical cyclone activity, rainfall, and the frequency of intense single-day storms have been on the rise, according to data compiled by the Environmental Protection Agency.”
Really? Where? When? We have pretty good data on tropical cyclones in particular and they aren’t increasing.
Neither are US floods. Well, what about the other stuff including droughts?
People who bother to check will thereafter doubt claims that these things are all increasing, so if Republicans are doubters, maybe it just means they looked up the numbers. And you don’t win the argument by appealing to the speculative future. “’We do expect to see more intense storms,’ said David Easterling, a spokesman for the National Oceanographic and Atmospheric Administration’s National Centers for Environmental Information.” Expect to see? Wasn’t the topic what we’d already seen?
Silly Republicans. “An overwhelming majority of scientists believe human consumption of fossil fuels is driving sweeping changes in the global climate by ramping up the concentration of heat-trapping gases in the atmosphere. But it is impossible to draw a direct link between the changes in U.S. weather in the recent past to the larger trend of warming.” Whereas an innuendo about the indirect links, followed by a snide reference to Donald Trump, should do the trick. “President Donald Trump has cast doubt on the science of climate change… Still, a majority of Republicans believe the United States should take “aggressive action” to combat global warming, Reuters polling shows.”
Good old Reuters polling. The story goes on to note that “Liberals are more likely to expose themselves to news outlets and people who believe climate change is an urgent threat that affects current weather patterns.” Like Reuters, for instance.
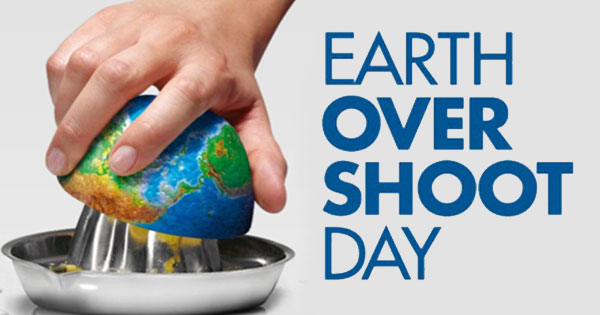
Starting today through the end of the year, humankind will start consuming more resources than our planet can sustainably produce, according to the Global Footprint Network (GFN), which has been organizing such days since 1986.
“Humanity is using nature 1.75 times faster than our planet’s ecosystems can regenerate,” says the group. “This is akin to using 1.75 Earths.”
Rich nations use up resources faster than poor ones, GFN says. The US, Australia, Denmark and Canada use up their resources before the end of March, while Cuba, Nicaragua, Iraq, and Ecuador don’t do so until December.
“Earth Overshoot Day” is based on something called the “Ecological Footprint,” which is used by the World Wildlife Fund, the United Nations Environment Program, the United Nations Development Program’s Human Development Report, and the International Union for Conservation of Nature.
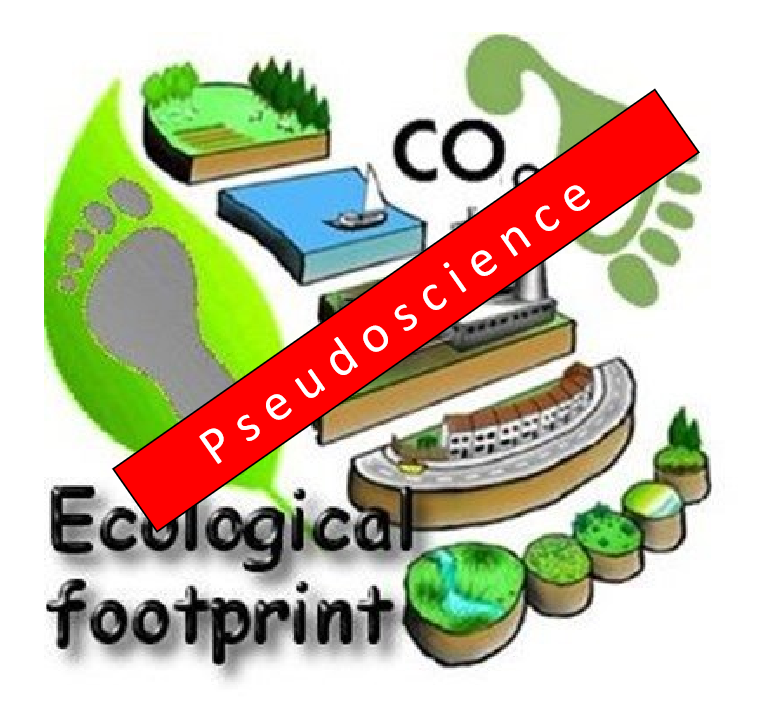
But is the Ecological Footprint good science? It’s not.
Six years ago I helped debunk Earth Overshoot Day and the Ecological Footprint calculation it’s based upon in a paper for the peer-reviewed scientific journal, PLOS Biology called “Does the Shoe Fit? Real vs. Imagined Footprints.”
We broke down the six measures that comprise the Ecological Footprint and found that five of the six, including food and forestry, were either in balance or surplus. The only thing out-of-balance were humankind’s carbon emissions.
But solving that problem doesn’t require that rich nations become poor — or that poor nations remain poor — but simply that we move toward energy sources that don’t produce carbon emissions, a process known as “decarbonization.”
And the only two cases of nations significantly decarbonizing their energy supplies, France and Sweden, did so not by becoming poor but rather by becoming far richer thanks to the use of nuclear energy. Today, France spends little more than half as much as Germany to produce electricity that produces one-tenth of the carbon emissions, thanks to nuclear.
How did the creators of the Ecological Footprint hide what they had done? By assuming that the only way to solve climate change was by expanding forest cover to absorb all industrial carbon emissions.
In other words, the Ecological Footprint converts emissions of carbon dioxide into a land-use category, thereby ignoring all the other ways of absorbing or never emitting CO2.
It gets worse. Different forests absorb carbon dioxide at different rates over time. But the Ecological Footprint arbitrarily chooses a single number to represent the rate of carbon uptake for all forests around the world for all time. The Ecological Footprint method is best known as “garbage in, garbage out.”
The implication of the Ecological Footprint is thus either that everyone in wealthy developed nations like the US, Europe, and Australia should try to live like Cubans and Nicaraguans, or that we should convert all of the world’s old-growth forests to fast-growing tree farms.
When we published our paper in 2013, it was widely covered in the media, including by Scientific American, New Science, and Le Monde, but that hasn’t stopped the European Commission and other governmental bodies from recognizing “Earth Overshoot Day” on social media.
The Ecological Footprint and Earth Overshoot Day were created at the same time that Western European nations and the United Nations embraced a neo-Malthusian approach to environmental problems.
Ironically, the UN promoted the use of wood fuels over nuclear. In a 1987 report called “Our Common Future,” the UN denounced nuclear energy and insisted that poor nations should use wood fuel more sustainably. “The wood-poor nations must organize their agricultural sectors to produce large amounts of wood and other plant fuels.”
The lead author of “Our Common Future” was Gro Brundtland, former Prime Minister of Norway, a nation which just a decade earlier had become fabulously wealthy thanks to its abundant oil and gas reserves.
Figures like Brundtland promoted the idea that poor nations didn’t need to consume much energy, which turned out to be howlingly wrong. Energy consumption is as tightly coupled to per capita GDP today as it was when today’s rich nations were themselves poor.
There is no rich nation that depends primarily on wood for energy, just as there is no poor nation that depends primarily on fossil fuels or nuclear.
The Ecological Footprint has as much scientific merit as astrology, phrenology, and flat-earth theories. It’s time to treat the Ecological Footprint as the pseudoscientific theory it is.
Ecological Footprint theory is pseudoscience on par with astrology, phrenology, and flat earth theories. SHUTTERSTOCK
Footnote:
Steve Maley wrote at Quora on When Global Warming Began:
Global Warming began in Muncie, Indiana on June 17, 1953 at 2:30 in the afternoon. It was a Tuesday.
Up until that time, weather was “average” all the time.
That is, except for the Dust Bowl, the Little Ice Age, Medieval Warm Period, etc.
Up until then, people had ideal, sustainable lifestyles. 90% of men spent all day in the fields looking at the backsides of two mules. Their spare time was spent chopping wood in hopes they could make it through another winter.
Women stayed at home and had babies. They had to have 8–10 because 2 or 3 of them wouldn’t live to see their 10th birthday.
Farm to Table was a thing. Since nobody had any money, it was a choice between raising your own food or starving.
Yes, it was an idyllic lifestyle. Damn fossil fuels screwed it all up.
How? By changing the atmosphere. Gases other than CO2 used to be 99.97% of the air we breathe. Now it’s 99.96%.
In a modern example of winning, yet being clueless without the slave’s reminder, we have Andrew Klaven writing at the Daily Wire about the downfalls of partisan triumphalism: Clueless Chuck Todd And The Democrats. Excerpts in italics with my bolds.
This week, we witnessed a delightfully comic demonstration of why it’s not such a good thing for the Democratic Party to own at least 90 percent of the communication apparatus in America. The mainstream news media is nearly all Democrat. Hollywood blacklists you if you’re not Democrat. The universities, publishing companies and most of the music industry are populated by Democrats. So Democrats, wrapped in a smothering blanket of mirrors, their own ideas reflected back to them endlessly, begin to develop the wholly ridiculous idea that their absurd version of reality is reality in fact.
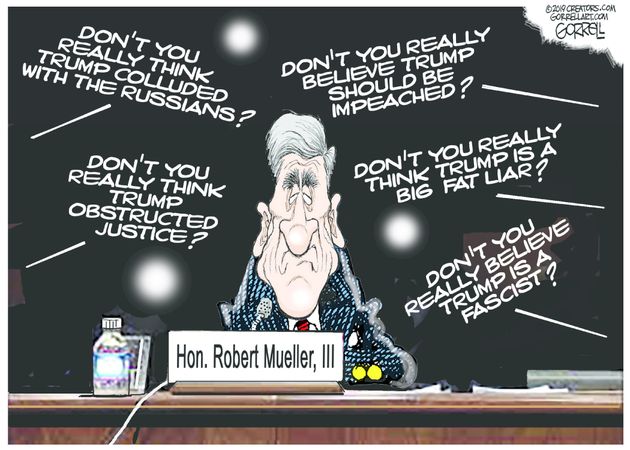
As a result, when Robert Mueller released a report revealing that Donald Trump had not colluded with the Russians to steal the election, and that, by any normal legal standard, he had to be considered not guilty of attempting to obstruct justice, the Democrats felt justified in thinking the report provided them with grounds for impeachment. After all, the news media agreed. The late-night comics all agreed. The experts wrote op-eds and they agreed. Even search engines and social media highlighted all the agreement.
So why wasn’t the public demanding impeachment too? Weren’t they watching the news? Weren’t they listening to the late-night comedians? Weren’t they reading the articles by professors? How could they be so blind as to think that a report clearing Trump had cleared Trump?
The Democrats’ answer: it must be because reading the report was too hard for ordinary folks. Maybe if Mueller testified to what was in the report, then the public would see what the Democrats saw all around them: in the news, on the comedy shows, in the academic op-eds and online.
So Mueller testified.
“We found insufficient evidence of the president’s culpability,” he said.
“At any time during your investigation was your investigation curtailed or stopped or hindered?” he was asked.
“No,” he said.
In the eloquent phraseology of Donald Trump: “No collusion, no obstruction.”
Only a Democratic Party swathed and smothered in media mirrors could have been shocked to hear Mueller declare that what was in the Mueller report was in the Mueller report.
Which brings me back to Chuck Todd, the pure spirit of Cluelessness in the Clueless Holy of Holies in the land of Clueless. Todd diagnosed the Democrats’ problem thusly: “The fact is we are living in this 21st century new type of asymmetrical media warfare that we’re in. And you have a propaganda machine on the right. And that’s what it is. It’s a full-fledged propaganda machine on the right that the Democrats haven’t figured out how to combat very well yet.”
I would feel better about the news media if I thought Todd was just a liar, but, no, I think he is actually clueless. Because as an American journalist he is, just like the Democrats, surrounded by people who reflect and echo his ideas. There’s no one near him to ask: What propaganda machine, Chuck? Aside from one cable station — Fox News — what network, what newspaper, what university, what comedian or movie-maker or search engine or social media does anything but spew left-wing propaganda all day every day? There’s no one to demand he produce his evidence. There’s no one to require him to show his work.
Every once in a while, they ought to visit the rest of us, here in Reality. It might keep them from making such utter fools of themselves.
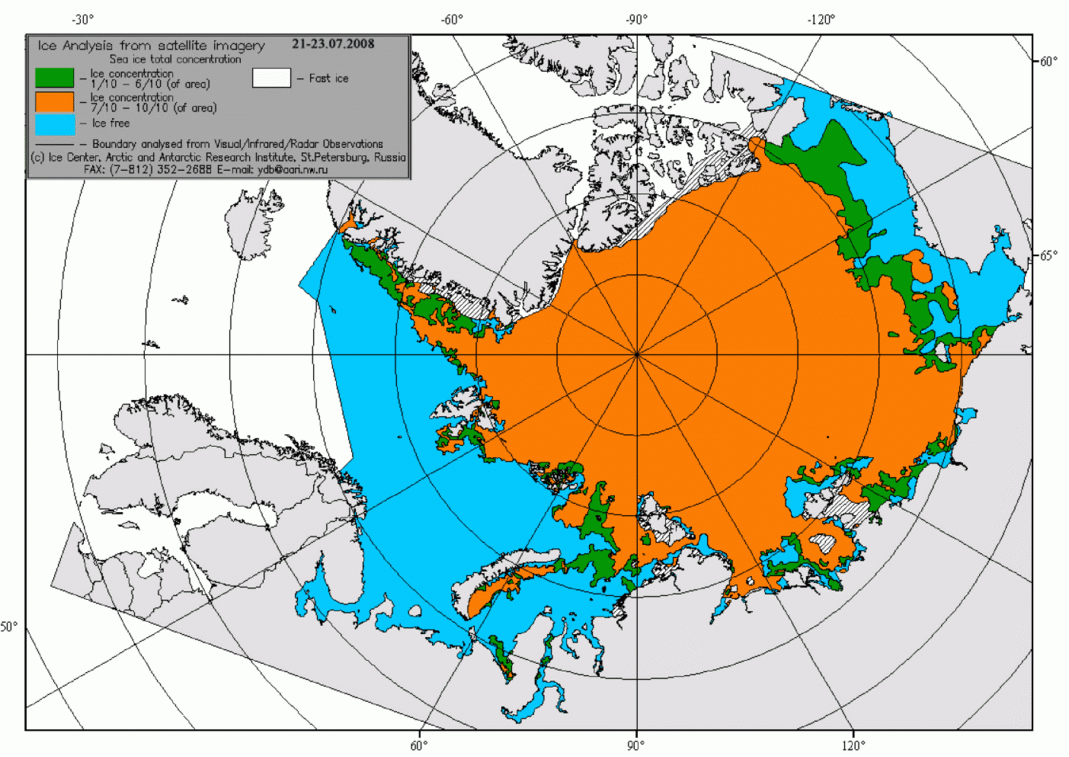
We are about 50 days away from the annual Arctic ice extent minimum, which typically occurs on or about day 260 (mid September). Some take any year’s slightly lower minimum as proof that Arctic ice is dying, but the image below shows the third week in July over the last 11 years. The Arctic heart is beating clear and strong.
Open image in new tab to enlarge.
These are weekly ice charts from AARI in St. Petersburg. The legend says the brown area is 7/10 to 10/10 ice concentration, while green areas are 1/10 to 6/10 ice covered. North American arctic areas are not analyzed in these images.
Over this decade, the Arctic ice minimum has not declined, but since 2007 looks like fluctuations around a plateau. By mid-September, all the peripheral seas have turned to water, and the residual ice shows up in a few places. The table below indicates where we can expect to find ice this next September. Numbers are area units of Mkm2 (millions of square kilometers).
Day 260
12 yr
Arctic Regions
2007
2010
2012
2014
2015
2016
2017
2018
Average
Central Arctic Sea
2.67
3.16
2.64
2.98
2.93
2.92
3.07
2.91
2.93
BCE
0.5
1.08
0.31
1.38
0.89
0.52
0.84
1.16
0.89
LKB
0.29
0.24
0.02
0.19
0.05
0.28
0.26
0.02
0.16
Greenland & CAA
0.56
0.41
0.41
0.55
0.46
0.45
0.52
0.41
0.46
B&H Bays
0.03
0.03
0.02
0.02
0.1
0.03
0.07
0.05
0.03
NH Total
4.05
4.91
3.4
5.13
4.44
4.2
4.76
4.56
4.48
The table includes three early years of note along with the last 5 years compared to the 12 year average for five contiguous arctic regions. BCE (Beaufort, Chukchi and East Siberian) on the Asian side are quite variable as the largest source of ice other than the Central Arctic itself. Greenland Sea and CAA (Canadian Arctic Archipelago) together hold almost 0.5M km2 of ice at annual minimum, fairly consistently. LKB are the European seas of Laptev, Kara and Barents, a smaller source of ice, but a difference maker some years, as Laptev was in 2016. Baffin and Hudson Bays are almost inconsequential as of day 260.
For context, note that the average maximum has been 15M, so on average the extent shrinks to 30% of the March high before growing back the following winter.
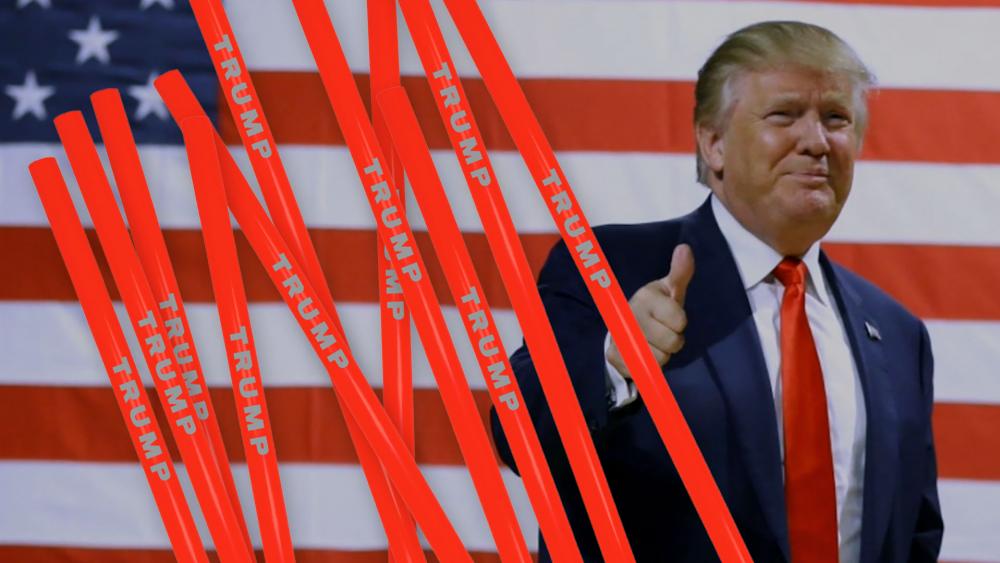
Reuseable Trump straws in durable plastic never stop keeping you hydrated. Now available for $15 a pack; proceeds go to a worthy cause: Trump re-election campaign.
“Now you can finally be free from liberal paper straws that fall apart within minutes and ruin your drink,” stated Trump Campaign Manager Brad Parscale in a fundraising email. “Trump Straws are custom made with the Official Trump Logo, recyclable and reusable, and, as always, 100% MADE IN AMERICA.”
Liking him or not doesn’t matter: He is the one stopping the climate lunatics from taking over the asylum.
All the doom-mongers said that Greenland would melt from the Europe stagnant air. Ha! This demonstrates interesting physics.
The warm air just bounces off Greenland. This shows the permanent high pressure air over the ice, and shows the winds.
And the ice stays as cold as ever. I never realized it before, but this demonstrates my concept of an ‘ice block’, which is a major component of my hypothesis for major ice advances. No need for solar cycles.
The glacier creates its own weather. That comes mainly from the ability to shed off solar heat flux, and to maintain a high pressure zone. This seems to only happen for continental ice sheets, the Arctic ocean has its own problems with the sea trying to melt it from below, so it isn’t cold enough for weather-making.
Thus, once a continental ice sheet starts (or the Arctic ice becomes very thick), then it’s a ‘snowball’ effect. The true Ice Age starts. But, as I have said, there is the little problem of the continents sinking under ice load, so we won’t have this for another few thousand years.
All the papers that reported this doom won’t follow through. People will be left with the impression that Greenland is melting, and impressions are what the warmies live on.
People who struggle with anxiety are known to have moments of “hair on fire.” IOW, letting your fears take over is like setting your own hair on fire. Currently the media, pandering as always to primal fear instincts, is declaring that the Arctic is on fire, and it is our fault. Let’s see what we can do to help them get a grip.
1. Summer is fire season for northern boreal forests and tundra.
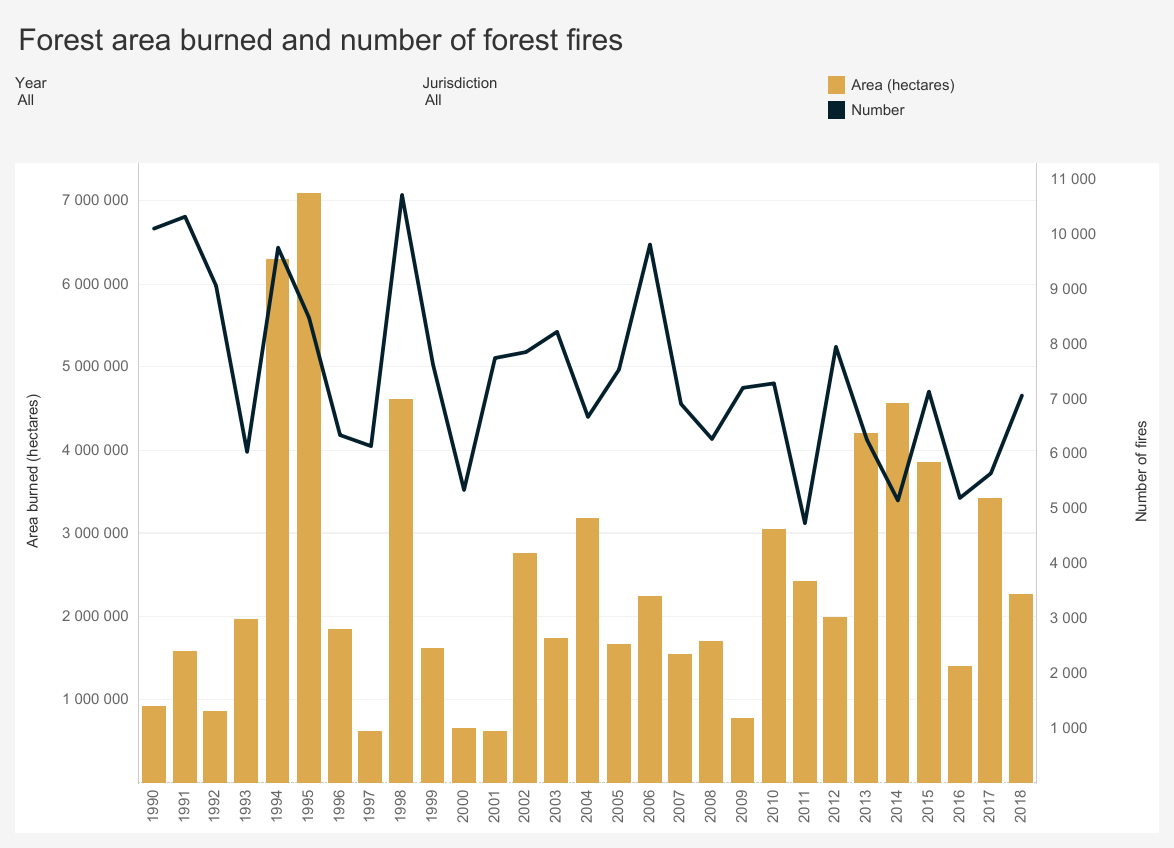
Since 1990, “wildland fires” across Canada have consumed an average of 2.5 million hectares a year.
Recent Canadian Forest Fire Activity
2015
2016
2017
Area burned (hectares)
3,861,647
1,416,053
3,371,833
Number of fires
7,140
5,203
5,611
The total area of Forest and other wooded land in Canada is 396,433,600 (hectares). So the data says that every average year 0.6% of Canadian wooded area burns due to numerous fires, ranging from 1000 in a slow year to over 10,000 fires and 7M hectares burned in 1994.
2. With the warming since 1980 some years have seen increased areas burning.
Despite the low annual temperatures and short growing seasons characteristic of northern ecosystems, wildland fire affects both boreal forest (the broad band of mostly coniferous trees that generallystretches across the area north of the July 13° C isotherm in North America and Eurasia, also known as Taiga) and adjacent tundra regions. In fact, fire is the dominant ecological disturbance in boreal forest, the world’s largest terrestrial biome. Fire disturbance affects these high latitude systems at multiple scales, including direct release of carbon through combustion (Kasischke et al., 2000) and interactions with vegetation succession (Mann et al., 2012; Johnstone et al., 2010), biogeochemical cycles (Bond-Lamberty et al., 2007), energy balance (Rogers et al., 2015), and hydrology (Liu et al., 2005). About 35% of global soil carbon is stored in tundra and boreal systems (Scharlemann et al., 2014) that are potentially vulnerable to fire disturbance (Turetsky et al., 2015). This brief report summarizes evidence from Alaska and Canada on variability and trends in fire disturbance in high latitudes and outlines how short-term fire weather conditions in these regions influence area burned.
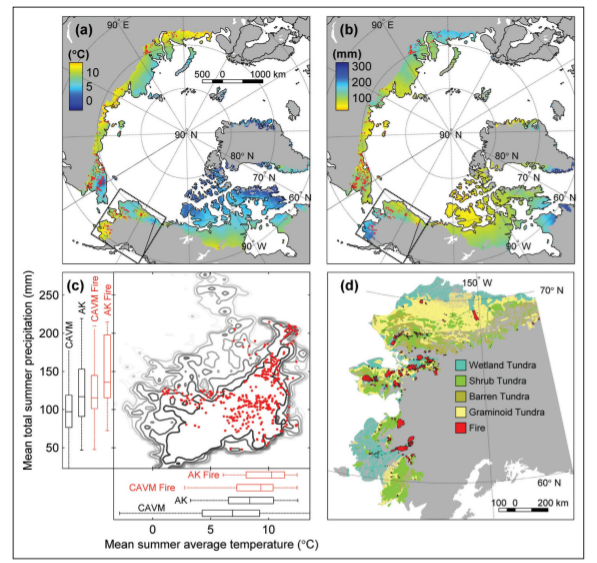
Climate is a dominant control of fire activity in both boreal and tundra ecosystems. The relationship between climate and fire is strongly nonlinear, with the likelihood of fire occurrence within a 30-year period much higher where mean July temperatures exceed 13.4° C (56° F) (Young et al., 2017). High latitude fire regimes appear to be responding rapidly to recent environmental changes associated with the warming climate. Although highly variable, area burned has increased over the past several decades in much of boreal North America (Kasischke and Turetsky, 2006; Gillett et al., 2004). Since the early 1960s, the number of individual fire events and the size of those events has increased, contributing to more frequent large fire years in northwestern North America (Kasischke and Turetsky, 2006). Figure 1 shows annual area burned per year in Alaska (a) and Northwest Territories (b) since 1980, including both boreal and tundra regions.
[Comment: Note that both Alaska and NW Territories see about 500k hectares burned on average each year since 1980. And in each region, three years have been much above that average, with no particular pattern as to timing.]
Recent large fire seasons in high latitudes include 2014 in the Northwest Territories, where 385 fires burned 8.4 million acres, and 2015 in Alaska, where 766 fires burned 5.1 million acres (Figs. 1 & 2)—more than half the total acreage burned in the US (NWT, 2015; AICC, 2015). Multiple northern communities have been threatened or damaged by recent wildfires, notably Fort McMurray, Alberta, where 88,000 people were evacuated and 2400 structures were destroyed in May 2016. Examples of recent significant tundra fires include the 2007 Anaktuvuk River Fire, the largest and longest-burning fire known to have occurred on the North Slope of Alaska (256,000 acres), which initiated widespread thermokarst development (Jones et al., 2015). An unusually large tundra fire in western Greenland in 2017 received considerable media attention.
Large fire events such as these require the confluence of receptive fuels that will promote fire growth once ignited, periods of warm and dry weather conditions, and a source of ignition—most commonly, convective thunderstorms that produce lightning ignitions. High latitude ecosystems are characterized by unique fuels—in particular, fast-drying beds of mosses, lichens, resinous shrubs, and accumulated organic material (duff) that underlie dense, highly flammable conifers. These understory fuels cure rapidly during warm, dry periods with long daylight hours in June and July. Consequently, extended periods of drought are not required to increase fire danger to extreme levels in these systems.
Most acreage burned in high latitude systems occurs during sporadic periods of high fire activity; 50% of the acreage burned in Alaska from 2002 to 2010 was consumed in just 36 days (Barrett et al., 2016). Figure 3 shows cumulative acres burned in the four largest fire seasons in Alaska since 1990 (from Fig. 1) and illustrates the varying trajectories of each season. Some seasons show periods of rapid growth during unusually warm and dry weather (2004, 2009, 2015), while others (2004 and 2005) were prolonged into the fall in the absence of season-ending rain events. In 2004, which was Alaska’s largest wildfire season at 6.6 million acres, the trajectory was characterized by both rapid mid-season growth and extended activity into September. These different pathways to large fire seasons demonstrate the importance of intraseasonal weather variability and the timing of dynamical features. As another example, although not large in total acres burned, the 2016 wildland fire season in Alaska was more than 6 months long, with incidents requiring response from mid-April through late October (AICC, 2016).
3. Wildfires are part of the ecology cycle making the biosphere sustainable.
In the moist forests of the west coast, wildland fires are relatively infrequent and generally play a minor ecological role.
In boreal forests, the complete opposite is true. Fires are frequent and their ecological influence at all levels—species, stand and landscape—drives boreal forest vegetation dynamics. This in turn affects the movement of wildlife populations, whose need for food and cover means they must relocate as the forest patterns change.
lThe Canadian boreal forest is a mosaic of species and stands. It ranges in composition from pure deciduous and mixed deciduous-coniferous to pure coniferous stands.
The diversity of the forest mosaic is largely the result of many fires occurring on the landscape over a long period of time. These fires have varied in frequency, intensity, severity, size, shape and season of burn.
The fire management balancing act: Fire is a vital ecological component of Canadian forests and will always be present.
Not all wildland fires should (or can) be controlled. Forest agencies work to harness the force of natural fire to take advantage of its ecological benefits while at the same time limiting its potential damage and costs.
Circumpolar tundra fires have primarily occurred in the portions of the Arctic with warmer summer conditions, especially Alaska and northeastern Siberia (Figure 1). Satellite-based estimates (Giglio et al. 2010; Global Fire Emissions Database 2015) show that for the period of 2002–2013, 0.48% of the Alaskan tundra has burned, which is four times the estimate for the Arctic as a whole (0.12%; Figure 1). These estimates encompass tundra ecoregions with a wide range of fire regimes. For instance, within Alaska, the observational record of the past 60 years indicates that only 1.4% of the North Slope ecoregion has burned (Rocha et al. 2012); 68% of the total burned area in this ecoregion was associated with a single event, the 2007 AR Fire.
The Noatak and Seward Peninsula ecoregions are the most flammable of the tundra biome, and both contain areas that have experienced multiple fires within the past 60 years (Rocha et al. 2012). This high level of fire activity suggests that fuel availability has not been a major limiting factor for fire occurrence in some tundra regions, probably because of the rapid post-fire recovery of tundra vegetation (Racine et al. 1987; Bret-Harte et al. 2013) and the abundance of peaty soils.
However, the wide range of tundra-fire regimes in the modern record results from spatial variations in climate and fuel conditions among ecoregions. For example, frequent tundra burning in the Noatak ecoregion reflects relatively warm/dry climate conditions, whereas the extreme rarity of tundra fires in southwestern Alaska reflects a wet regional climate and abundant lakes that act as natural firebreaks.
Fire alters the surface properties, energy balance, and carbon (C) storage of many terrestrial ecosystems. These effects are particularly marked in Arctic tundra (Figure 5), where fires can catalyze biogeochemical and energetic processes that have historically been limited by low temperatures.
In contrast to the long-term impacts of tundra fires on soil processes, post-fire vegetation recovery is unexpectedly rapid. Across all burned areas in the Alaskan tundra, surface greenness recovered within a decade after burning (Figure 6; Rocha et al. 2012). This rapid recovery was fueled by belowground C reserves in roots and rhizomes, increased nutrient availability from ash, and elevated soil temperatures.
At present, the primary objective for wildland fire management in tundra ecosystems is to maintain biodiversity through wildland fires while also protecting life, property, and sensitive resources. In Alaska, the majority of Arctic tundra is managed under the “Limited Protection” option, and most natural ignitions are managed for the purpose of preserving fire in its natural role in ecosystems. Under future scenarios of climate and tundra burning, managing tundra fire is likely to become increasingly complex. Land managers and policy makers will need to consider trade-offs between fire’s ecological roles and its socioeconomic impacts.
4. Arctic fire regimes involve numerous interacting factors.
Although our fire-history records provide unique insights into the potential response of modern tundra ecosystems to climate and vegetation change, they are imperfect analogs for future fire regimes. First, ongoing vegetation changes differ from those of the late-glacial period: several shrub taxa (Salix, Alnus, and Betula) are currently expanding into tundra [10], whereas Betula was the primary constituent of the ancient shrub tundra. The lower flammability of Alnus and Salix compared to Betula could make future shrub tundra less flammable than the ancient shrub tundra. Second, mechanisms of past and future climate change also differ. In the late-glacial and early-Holocene periods, Alaskan climate was responding to shrinking continental ice volumes, sea-level changes, and amplified seasonality arising from changes in the seasonal cycle of insolation [13]; in the future, increased concentrations of atmospheric greenhouse gases are projected to cause year-round warming in the Arctic, but with a greater increase in winter months [8]. Finally, we know little about the potential effects of a variety of biological and physical processes on climate-vegetation-fire interactions. For example, permafrost melting as a result of future warming [8] and/or increased burning [24] could further facilitate fires by promoting shrub expansion [10], or inhibit fires by increasing soil moisture [24].
5. The Arctic has adapted to many fire regimes stronger than today’s activity.
Fire history in the Noatak also suggests that subtle changes in vegetation were linked to changes in tundra fire occurrence. Spatial variability across the study region suggests that vegetation responded to local-scale climate, which in turn influenced the flammability of surrounding areas. This work adds to evidence from ‘ancient’ shrub tundra in the southcentral Brooks Range suggesting that vegetation change will likely modify tundra fire regimes, and it further suggests that the direction of this impact will depend upon the specific makeup of future tundra vegetation. Ongoing climate-related vegetation change in arctic tundra such as increasing shrub abundance in response to warming temperatures (e.g., Tape et al. 2006), could both increase (e.g., birch) or decrease (e.g., alder) the probability of future tundra fires.
This study provides estimated fire return intervals (FRIs) for one of the most flammable tundra ecosystems in Alaska. Fire managers require this basic information, and it provides a valuable context for ongoing and future environmental change. At most sites, FRIs varied through time in response to changes in climate and local vegetation. Thus, an individual mean or median FRI does not capture the range of variability in tundra fire occurrence. Long-term mean FRIs in many periods were both shorter than estimates based on the past 60 years and statistically indistinct from mean FRIs found in Alaskan boreal forests (e.g., Higuera et al. 2009) (Figure 2). These results imply that tundra ecosystems have been resilient to relatively frequent burning over the past 6,000 years, which has implications for both managers and scientists concerned about environmental change in tundra ecosystems. For example, increased tundra fire occurrence could negatively impact winter forage for the Western Arctic Caribou Herd (Joly et al. 2009). Although the Noatak is only a portion of this herd’s range, our results indicate that if caribou utilized the study area over the past 6,000 years, then they have successfully co-existed with relatively frequent fire.
Ever since the IPCC report in 2018, there’s been an increasing surge of doomist reporting, to the point that it is no surprise that there are many of our youngsters are naturally depressed and suicidal, thinking there is little point in life, and that they won’t live to be adults. Others are leading the way with politically unrealistic demands that we decarbonize completely within 12 years. These new requirements they are making are not supported at all by science, rather they are a result of emotional rhetoric, journalistic exaggerations, and junk science that they do not know how to evaluate correctly. The situation is indeed urgent. We are already doing much, we need to ramp up quickly, but we do not have only 12 years to do it. Also, the future does not risk collapse of civilization or human extinction on any scenario.
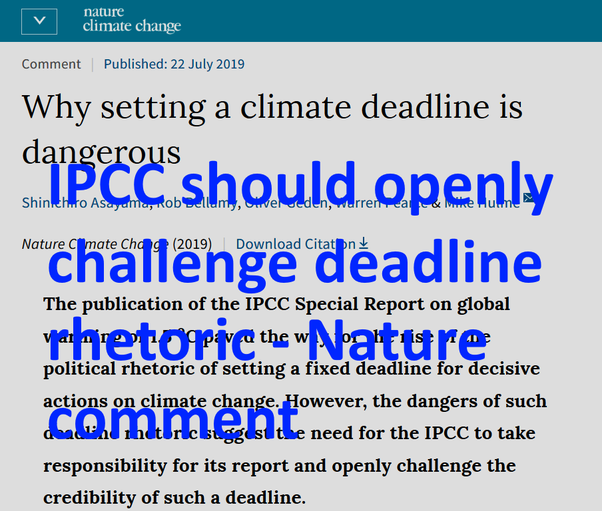
The paper is called Why setting a climate deadline is dangerous and it says in its subtitle / short abstract:
The publication of the IPCC Special Report on global warming of 1.5°C paved the way for the rise of the political rhetoric of setting a fixed deadline for decisive actions on climate change. However, the dangers of such deadline rhetoric suggest the need for the IPCC to take responsibility for its report and openly challenge the credibility of such a deadline.
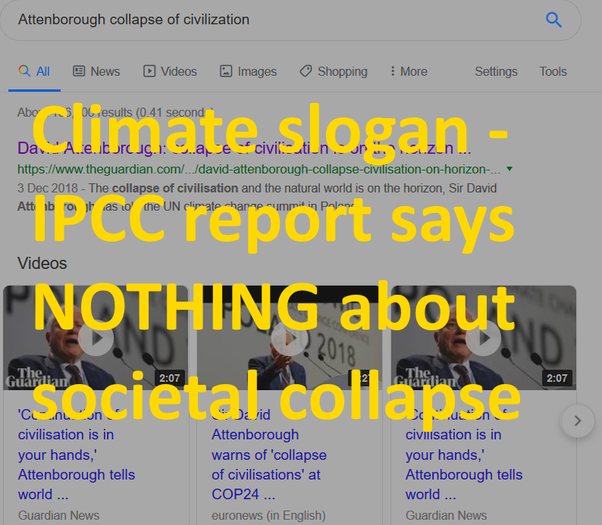
Journalists have been saying that we have twelve years to act to save the planet. Now many are “upping the ante” and saying we have only 18 months, with the implication that if we don’t do very drastic action by 2020, then civilization will collapse and humans likely go extinct. They use very emotive words such as that this action is needed for our very survival. Many of our youngsters, and adults too, take this quite literally, they think that by the time they reach adulthood, in a little over a decade, the world will no longer have any humans in it, that our civilization and species will be gone. This is why I think it is a responsibility for science bloggers like myself and journalists to speak up against this.
But the authors say the situation has got so out of hand that the IPCC should say something to make it clear how badly they have been misrepresented in the media. They argue, basically, that to stay silent in this situation is the more political thing to do. It is to give tacit report to this doomist framing. This also is an important and valid point. I hear that a lot – if the journalists are wrong, scared people ask, why don’t the IPCC say?
If you listen to what the IPCC themselves say, they do not talk about a risk of human extinction or collapse of civilization. There is no mention of such ideas anywhere in the report, or the press conference the journalists attended, their response to questions or the short summaries by the co-chairs. That is all JOURNALISTIC INVENTION, HYPERBOLE, SIMPLIFIED CLIMATE SLOGANS, AND JUNK SCIENCE.
The story of the Modern Warming Spike (AKA the Hockey Stick) and its Rise and Fall is recounted in a previous post, reprinted later on. The news today is about a fresh initiative to reassert the discredited analysis using a new temperature reconstruction combining proxies stored by the PAGES2K network.
In a recent post Marcel Crok described his initiation into the climate wars as a young science journalist and discovering that two Canadians (Ross McKitrick and Steve McIntyre) had proved false Michael Mann’s modern warming spike. As he says correctly:
The arguments of the critics were not difficult to refute and the work of the two Canadians stands firmly to this day. I was intrigued by the quite aggressive and also defensive reaction of the climate scientists. Up to this day the criticism of the Canadians has never been fully addressed by the climate science community or the IPCC. Wasn’t this about the progress of science?
Just in time for the Year without a Summer in North America, we have a coordinated blitz of articles claiming present day warming never happened before. Just a sample from yesterday:
New climate studies bust sceptics’ ‘Little Ice Age’ theory Newshub17:13
Global warming is happening at a speed and scale ‘unprecedented’ in the last 2,000 years Daily Mail17:10
Trees tell us: this heating is different Stuff.co.nz17:04
Global warming dwarfs climate variations of past 2,000 years Thomson Reuters Foundation News16:50
2,000 years of records show it’s getting hotter, faster The Conversation (AU)15:59
Climate is warming faster than it has in 2,000 years USA Today EU15:52
Causes of multidecadal climate changes ScienceDaily15:51
20th-century warming ‘unmatched’ in 2,000 years AFP15:41
Unlike Modern Climate Change, the Biggest Swings in Recorded History Were Just Regional Patterns Discover Magazine15:07
Global extent of climate change is ‘unparalleled’ in past 2,000 years Carbon Brief14:18
Recent warming ‘unmatched in the past 2000 years’ Cosmos14:11
Climate is warming faster than it has in the last 2,000 years ScienceDaily13:50
New global warming study definitively proves climate deniers wrong The Independent13:49
Earth warmed faster in the last few decades than the previous 1,900 years, study says Los Angeles Times13:48
Global warming ‘unparalleled’ in 2,000 years BBC13:33
Recent climate change trends ‘unprecedented’ in the last 2,000 years CNET13:30
Global warming dwarfs climate variations of past 2,000 years – study Reuters13:29
The climate is warming faster than it has in the last 2,000 years BrightSurf.com13:29
Modern Climate Change Is the Only Worldwide Warming Event of the Past 2,000 Years Smithsonian Magazine13:18
“They’ve shown that not only is the warming that we’ve experienced in the last few decades larger in magnitude than the kinds of changes we’ve seen due to natural factors in the past, [but] it’s affecting almost the entire planet in the same way at the same time,” St. George says. “That’s really different than earlier prolonged climate changes due to natural factors which sometimes affected a large part of the planet but nothing close to 100 percent. The current warming that we’re going through is almost everywhere, and that’s what really makes it distinct from earlier climatic events due to natural causes.”
Then the Realism:
Kevin Anchukaitis, a paleoclimatologist at the University of Arizona not involved in the research, says the idea that the Medieval period and Little Ice Age weren’t eras of truly global changehas been discussedin previous studies, and the authors’ recent conclusions support that earlier work. “They were broad warm and cold periods, within which different regions of the globe had their coldest or warmest periods at different times. For the Little Ice Age, we know this is linked to volcanism,” Anchukaitis says.
Despite the fact that more data is available to paleoclimatologists than ever before, Anchukaitis believes that significantly more work needs to be done if scientists are to gather a truly global picture of past climate. “To make progress in understanding the climate of the [past 2,000 years], we should move beyond applying a smorgasbord of different statistical methods,” he says via email. Instead, scientists need a renewed effort to gather paleoclimate records from places and times that are underrepresented in compilations like PAGES 2k.
“The proxy network is largely Northern Hemisphere tree-rings, tropical records (corals) decline rapidly by 1600, and there are relatively few Southern Hemisphere records outside of the Antarctic ice cores,” Anchukaitis says. “So claims about global spatial patterns prior to about 1600, particularly for the tropics and southern hemisphere, must be viewed cautiously.”
My Comment: There is no such thing as a global climate. Climates are regional, local and even micro in their distinctive patterns of temperature and precipitation. Analyses of the Koppen climate zones show that boundaries are shifting very little over the last 100 years, and that warming and cooling remains highly variable over the earth’s surface. [See Data vs. Models #4: Climates Changing]
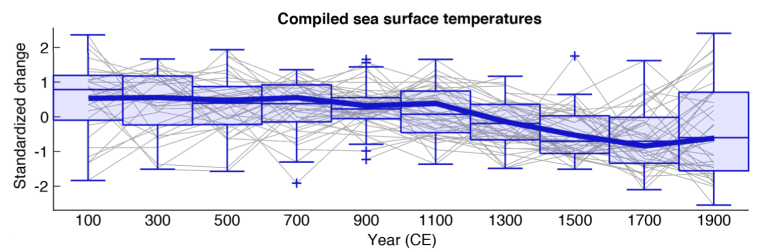
Moreover, the paleoproxies remain problematic and subject to both manipulation and biased interpretation. Steve McIntyre has extensive critques of PAGES at his blog Climate Audit. For example in Sept. 2015 he discussed The Ocean2K “Hockey Stick”, a study with very similar claims:
Today, the Earth is warming about 20 times faster than it cooled during the past 1,800 years,” said Michael Evans, second author of the study and an associate professor in the University of Maryland’s Department of Geology and Earth System Science Interdisciplinary Center (ESSIC). “This study truly highlights the profound effects we are having on our climate today.”
McIntyre observed:
One of the reasons for the strange lack of interest in this newest proxy “Hockey Stick” was that the proxy data didn’t actually show “the climate was warming about 20 times faster than it cooled during the past 1,800 years”. The OCEAN2K reconstruction (see Figure 1 below) had a shape that anyone would be hard-pressed to describe as a “Hockey Stick”. It showed a small decrease over the past two millennia with the most recent value having a tiny uptick from its predecessor, but, whatever image one might choose to describe its shape, “Hockey Stick” is not one of them.
Previous Post: The Rise and Fall of the Modern Warming Spike
The first graph appeared in the IPCC 1990 First Assessment Report (FAR) credited to H.H.Lamb, first director of CRU-UEA. The second graph was featured in 2001 IPCC Third Assessment Report (TAR) the famous hockey stick credited to M. Mann.
A previous post Rise and Fall of CAGW described the process that began with Hansen’s flashy Senate testimony in 1988, later supported by Santer’s flashy paper in 1996. This post traces a second iteration that ensued following Michael Mann’s production of the infamous Climate Hockey Stick graph in 1998. The image at the top comes from the 2001 IPCC TAR (Third Assessment Report) signifying the immediate embrace of this alarmist tool by consensus climatists. The message of the graph was to assert a spike in modern warming unprecedented in the last 1000 years. This claim of a “Modern Warming Spike” required a flat temperature profile throughout the Middle Ages (since 1000 AD).
The background to the process steps (image below) from Ross Pomeroy’s paper is provided followed by text and references for the rise and fall of the theory intended to erase Medieval Warming comparable to the present day. Sources of material are listed at the end and included here with my bolds.
How Theories Advance and Collapse
Seeing how disarray defines psychology, it makes perfect sense that the field’s leading theories are vulnerable to collapse. Having watched this process play out a number of times, a clear pattern has emerged. Let’s call it the “Six Stages of a Failed Psychological or Sociological Theory.”
Stage 1: The Flashy Finding. An intriguing report is published with subject matter that lends itself to water cooler conversation, say, for example, that sticking a pen in your mouth to force a smile makes things seem funnier. Media outlets provide gushing coverage.
Stage 1 Modern Warming Spike Theory
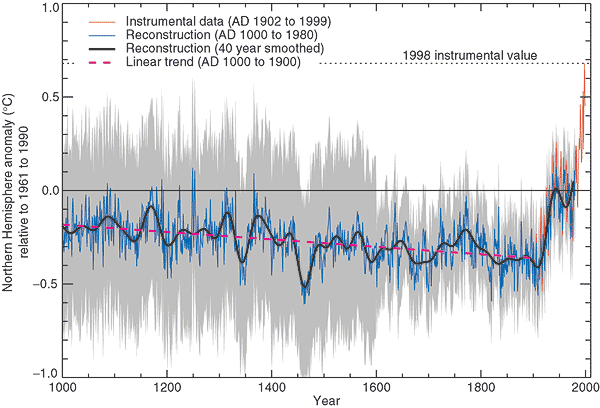
Figure 2.20: Millennial Northern Hemisphere (NH) temperature reconstruction (blue) and instrumental data (red) from AD 1000 to 1999, adapted from Mann et al. (1999). Smoother version of NH series (black), linear trend from AD 1000 to 1850 (purple-dashed) and two standard error limits (grey shaded) are shown. Source: IPCC Third Assessment Report
Since the IPCC believes that the warming from 1975 to 1998 was mainly man-made, but not the warming in earlier centuries, it would like to be able to demonstrate that recent warming is ‘unprecedented’. But it isn’t. Temperatures in many parts of the world appear to be lower than they were in the Medieval Warm Period (MWP, c. 900-1400), and also in the earlier Roman Warm Period (c. 200 BC – 600 AD). During the MWP the Vikings tilled now-frozen farms in Greenland and were buried there in ground that is now permafrost (archaeology.org). Hundreds of peer-reviewed articles show that the MWP was a global phenomenon (Idso & Singer, 2009, 69-94; wattsupwiththat.com; co2science.org), and was not confined to parts of the northern hemisphere, as the IPCC likes to assert.
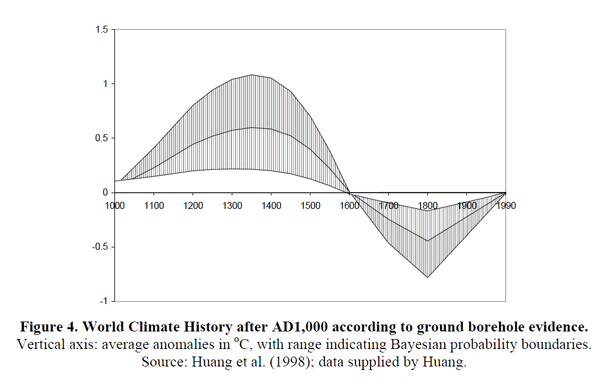
Those wanting to “get rid of” the MWP run into the problem that it shows up strongly in the data. Shortly after Deming’s article appeared, a group led by Shaopeng Huang of the University of Michigan completed a major analysis of over 6,000 borehole records from every continent around the world. Their study went back 20,000 years. The portion covering the last millennium is shown in Figure 4.
The similarity to the IPCC’s 1995 graph is obvious. The world experienced a “warm” interval in the medieval era that dwarfs 20th century changes. The present-day climate appears to be simply a recovery from the cold years of the “Little Ice Age.”
Huang and coauthors published their findings in Geophysical Research Letters 6 in 1997. The next year, Nature published the first Mann hockey stick paper, commonly called “MBH98.”7 Mann et al. followed up in 1999 with a paper in GRL (“MBH99”) extending their results from AD1400 back to AD1000.8 In early 2000 the IPCC released the first draft of the TAR. The hockey stick was the only paleoclimate reconstruction shown in the Summary, and was the only one in the whole report to be singled out for repeated presentation. The borehole data received a brief mention in Chapter 2 but the Huang et al. graph was not shown. A small graph of borehole data taken from another study and based on a smaller sample was shown, but it only showed a post-1500 segment, which, conveniently, trended upwards.
Figure 2.19: Reconstructed global ground temperature estimate from borehole data over the past five centuries, relative to present day. Shaded areas represent ± two standard errors about the mean history (Pollack et al., 1998). Superimposed is a smoothed (five-year running average) of the global surface air temperature instrumental record since 1860 (Jones and Briffa, 1992). Source: IPCC Third Assessment Report WG 1
Stage 2: The Fawning Replications. Other psychologists, usually in the early stages of their careers, leap to replicate the finding. Most of their studies corroborate the effect. Those that don’t are not published, perhaps because the researchers don’t want to step on any toes, or because journal editors would prefer not to publish negative findings.
Stage 2 Modern Warming Spike Theory
As the hockey stick began to appear in the scientific literature, it emerged that 1998 was the warmest year in Phil Jones’s 150-year record of thermometer data. The length of the hockey stick blade just grew. Those in charge of publicizing the work of climate scientists and making the case for man-made climate change were understandably excited. Controversial science swiftly morphed into a propaganda tool.
The World Meteorological Organization put the hockey stick on the cover of its 1999 report on climate change. Then IPCC chiefs decided to give it pride of place in their 2001 IPCC report. Moreover, based on the hockey stick, they stated that “it is likely that the 1990s was the warmest decade and 1998 the warmest year during the past thousand years”. That attracted attention — and trouble. The doubts expressed in that paper title about “uncertainties and limitations” were melting away.
1999 WMO statement on the Climate.
An article in the Guardian (here) describes the struggle leading to victory for the Hockey Stick.
Emails exchanged in September 1999 reveal intense disagreement about whether Mann’s hockey stick should go into the IPCC summary for policymakers – the only bit of the report that usually gets read outside the scientific community – or whether other reconstructions using tree ring data alone should get priority. One of the main tree-ring constructions was by Briffa. The emails also expose major tensions between a desire for scrupulous honesty about uncertainties, and the desire for a simple story to tell the policymakers. The IPCC’s core job is to present a “consensus” on the science, but in this critical case there was no easy consensus.
The tensions were summed up in an email sent on 22 September 1999 by Met Office scientist Chris Folland, in which he alerted key researchers that a diagram of temperature change over the past thousand years “is a clear favourite for the policy makers’ summary”
But there were two competing graphs – Mann’s hockey stick and another, by Jones, Briffa and others. Mann’s graph was clearly the more compelling image of man-made climate change. The other “dilutes the message rather significantly,” said Folland. “We want the truth. Mike [Mann] thinks it lies nearer his result.” Folland noted that “this is probably the most important issue to resolve in chapter 2 at present.”
Mann, Jones and Briffa eventually settled their differences. And the hockey stick was given pride of place in the IPCC report. Folland says: “My recollection is that the final version [of the IPCC summary], which contains the hockey stick, satisfied Keith and everyone else in the end — after the usual vigorous scientific debate.” And after the three came under attack from climate sceptics, all reference to these past spats disappeared from the emails as they faced a common foe.
Stage 3: A Consensus Forms. The finding is now taken for granted, regularly appearing in pop psychology stories and books penned by writers like Malcolm Gladwell or Jonah Lehrer. Millions of people read about it and “armchair” explain it to their friends and family.
Stage 3 Modern Warming Spike Theory
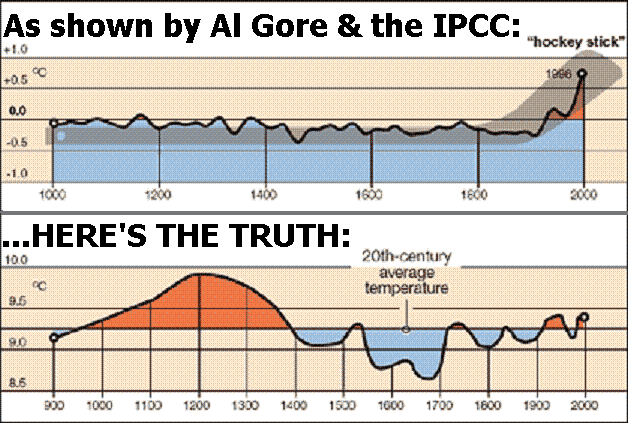
In its 2001 Third Assessment Report, the IPCC used the iconic ‘hockey stick’ graph to try and show that modern warming was indeed ‘unprecedented’. The graph was produced by Michael Mann (now at Penn State University in the US), Ray Bradley and Malcolm Hughes (MBH), and published in Nature and Geophysical Research Letters in 1998 and 1999. At that time, the standard view was that the Medieval Warm Period and subsequent Little Ice Age (c. 1400-1850) were global events. But some climatologists saw the MWP as an embarrassment and spoke of the need to ‘get rid of it’. MBH’s temperature reconstruction did exactly that: it showed 900 years of gradually declining temperatures followed by a dramatic increase in the 20th century. The hockey stick played a central role in mobilizing political and public opinion in favour of drastic action to curb greenhouse gas emissions.
Al Gore with a version of the Hockey Stick graph in the 2006 movie An Inconvenient Truth
“As soon as the IPCC Report came out, the hockey stick version of climate history became canonical. Suddenly it was the “consensus” view, and for the next few years it seemed that anyone publicly questioning the result was in for a ferocious reception.” Ross McKitrick.What is the ‘Hockey Stick’ Debate About?
Stage 4: The Rebuttal. After a few decades, a new generation of researchers look to make a splash by questioning prevailing wisdom. One team produces a more methodologically-sound study that debunks the initial finding. Media outlets blare the “counterintuitive” discovery.
Stage 4 Modern Warming Spike Theory
The hockey stick was based on historical temperature proxies (mainly tree rings), with the 20th-century instrumental temperature record tacked on the end. Incredibly, although the MBH articles were peer reviewed, nobody tried to replicate and verify the work, even though it overturned well-established views on climate history. It was only several years later that Steve McIntyre, a Canadian mathematician and retired mining consultant, began to investigate the matter.Mann did his best to obstruct him; he refused to release his computer code, saying that ‘giving them the algorithm would be giving in to the intimidation tactics that these people are engaged in’.
McIntyre, with the help of economist Ross McKitrick, went on to write several articles in 2003 and 2005, exposing the flaws in the hockey-stick reconstruction. They showed that the shape of the graph was determined mainly by suspect bristlecone/foxtail tree-ring data, and that Mann’s computer algorithm was so biased that it could produce hockey sticks even out of random noise; in short, Mann’s statistical methods ‘mined’ for hockey-stick signals in the proxy data, which were then assigned exaggerated weight in the reconstruction – thereby giving a whole new meaning to the term ‘Man(n)-made warming’!
In 2006 McIntyre & McKitrick’s criticisms were upheld by two expert committees in the US – the National Academy of Sciences (NAS) panel and a congressional panel headed by statistician Edward Wegman. Wegman pointed out that the palaeoclimate field is dominated by ‘a tightly knit group of individuals who passionately believe in their thesis’, and that ‘the work has been sufficiently politicized that they can hardly reassess their own public positions without losing credibility’.
McKitrick wrote in 2005:
Since our work has begun to appear we have enjoyed the satisfaction of knowing we are winning over the expert community, one at a time. Physicist Richard Muller of Berkeley studied our work last year and wrote an article about it:
“[The findings] hit me like a bombshell, and I suspect it is having the same effect on many others. Suddenly the hockey stick, the poster-child of the global warming community, turns out to be an artifact of poor mathematics.”
In an article in the Dutch science magazine Natuurwetenschap & Techniek, Dr. Rob van Dorland of the Dutch National Meteorological Agency commented “It is strange that the climate reconstruction of Mann passed both peer review rounds of the IPCC without anyone ever really having checked it. I think this issue will be on the agenda of the next IPCC meeting in Peking this May.”
In February 2005 the German television channel Das Erste interviewed climatologist Ulrich Cubasch, who revealed that he too had been unable to replicate the hockey stick (emphasis added):
He [Climatologist Ulrich Cubasch] discussed with his coworkers – and many of his professional colleagues – the objections, and sought to work them through… Bit by bit, it became clear also to his colleagues: the two Canadians were right. …Between 1400 and 1600, the temperature shift was considerably higher than, for example, in the previous century. With that, the core conclusion, and that also of the IPCC 2001 Report, was completely undermined.
Recently Steve MacIntyre and I received an email from Dr. Hendrik Tennekes, retired director of the Royal Meteorological Institute of the Netherlands. He wrote to convey comments he wished to be communicated publicly: “The IPCC review process is fatally flawed. The behavior of Michael Mann is a disgrace to the profession.”
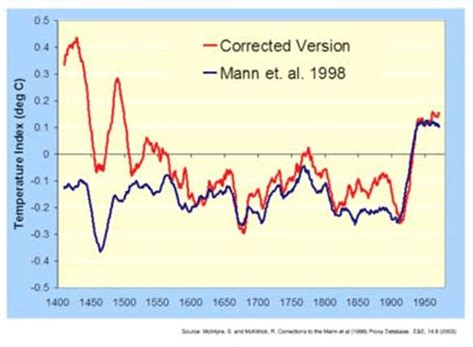
The original MBH graph compared to a corrected version produced by MacIntyre and McKitrick after undoing Mann’s errors.
Stage 5: Proper Replications Pour In. Research groups attempt to replicate the initial research with the skepticism and precise methodology that should’ve been used in the first place. As such, the vast majority fail to find any effect.
Stage 5 Modern Warming Spike Theory
The IPCC dealt with the devastating rebuttal by hiding the hockey stick within a spaghetti graph of various paleo proxies to diffuse the issue, while still claiming unprecedented modern warming.
In the IPCC’s 2007 Fourth Assessment Report, the hockey stick was included in a ‘spaghetti diagram’ alongside six other temperature reconstructions, which showed greater variability in the past but still no pronounced MWP. These ‘independent’ studies are the work of Mann’s colleagues and make use of the same flawed proxies as well as dubious statistical techniques (Montford, 2010, 266-308). The data were carefully cherry-picked to exclude tree-ring series that showed a prominent MWP (climateaudit.files.wordpress.com). Palaeoclimatologist Rosanne D’Arrigo actually told the NAS panel that cherry-picking was necessary if you wanted to make cherry pie (i.e. hockey sticks). And Jan Esper has stated: ‘The ability to pick and choose which samples to use is an advantage unique to dendroclimatology’ – a statement that would make any reputable scientist shudder (Montford, 236, 288-9).
Sixteen of the articles cited in AR4 failed to meet the IPCC’s own publication deadlines for cited references; all of them were written by IPCC contributing authors in support of the AGW cause. The most notable case is a paper by Eugene Wahl and Caspar Ammann. The authors of chapter 6 desperately needed this paper to counter McIntyre & McKitrick’s criticisms of the hockey stick, as the authors claimed to have validated Mann’s results. The leaked emails show that members of the Team pressurized Climatic Change editor Stephen Schneider to ensure that the paper was processed quickly enough to meet IPCC deadlines, though this was not entirely successful. Wahl and Ammann referred to arguments in another unpublished paper they had written, which was not even submitted until well after the first paper had gone forward for IPCC review. Jones advised the authors to be dishonest: ‘try and change the Received date! Don’t give those skeptics something to amuse themselves with’ (1189722851). Both papers finally appeared in September 2007. The authors conceded that the hockey stick failed a key test for statistical significance, but claimed it passed another test and promised to provide details in their Supplementary Information. When this was finally made available a year later, it became clear that torturous statistical manipulations were required to enable the test to be passed (Montford, 2010, 201-19, 338-42, 424-6; bishophill.squarespace.com). The shenanigans involved in the Wahl & Ammann saga are quite breathtaking.
But the credibility of the hockey stick claims was attacked repeatedly:
Stage 6: The Theory Lives On as a Zombie. Despite being debunked, the theory lingers on in published scientific studies, popular books, outdated webpages, and common “wisdom.” Adherents in academia cling on in a state of denial – their egos depend upon it.
Stage 6 Modern Warming Spike Theory
There are still hardcore alarmist blogs that defend the hockey stick graph, but IPCC itself has dropped it without explicitly disowning it.
About 1000 years ago, large parts of the world experienced a prominent warm phase which in many cases reached a similar temperature level as today or even exceeded present-day warmth. While this Medieval Warm Period (MWP) has been documented in numerous case studies from around the globe, climate models still fail to reproduce this historical warm phase. The problem is openly conceded in the most recent IPCC report from 2013 (AR5, Working Group 1) where in chapter 5.3.5. the IPCC scientists admit (pdf here):
“Continental-scale surface temperature reconstructions show, with high confidence, multi-decadal periods during the Medieval Climate Anomaly (950 to 1250) that were in some regions as warm as in the mid-20th century and in others as warm as in the late 20th century.” pg.386
“The timing of warm and cold periods is mostly consistent across reconstructions (in some cases this is because they use similar proxy compilations) but the magnitude of the changes is clearly sensitive to the statistical method and to the target domain (land or land and sea; the full hemisphere or only the extra-tropics; Figure 5.7a). Even accounting for these uncertainties, almost all reconstructions agree that each 30-year (50-year) period from 1200 to 1899 was very likely colder in the NH than the 1983–2012 (1963–2012) instrumental temperature NH reconstructions covering part or all of the first millennium suggest that some earlier 50-year periods might have been as warm as the 1963–2012 mean instrumental temperature, but the higher temperature of the last 30 years appear to be at least likely the warmest 30-year period in all reconstructions (Table 5.4). However, the confidence in this finding is lower prior to 1200, because the evidence is less reliable and there are fewer independent lines of evidence. There are fewer proxy records, thus yielding less independence among the reconstructions while making them more susceptible to errors in individual proxy records. The published uncertainty ranges do not include all sources of error (Section 5.3.5.2), and some proxy records and uncertainty estimates do not fully represent variations on time scales as short as the 30 years considered in Table 5.4. Considering these caveats, there is medium confidence that the last 30 years were likely the warmest 30-year period of the last 1400 years.” Pg.410
Meanwhile a multitude of studies confirm that medieval warming was widespread and not limited to regions in the Northern Hemisphere, as Mann and others have claimed. For example the MWP Mapping Project led by Dr. Sebastian Luening, Prof. Dr. Fritz Vahrenholt (authors of ‘The neglected sun‘).
red: MWP warming
blue: MWP cooling (very rare)
yellow: MWP more arid
green: MWP more humid
grey: no trend or data ambiguous
Most of western North America and Africa were experiencing drought conditions during the MWP (except some areas in Southwest Africa). In contrast, Australia and the Carribean was more humid. Globally, 99% of all paleoclimatic temperature studies compiled in the map so far show a prominent warming during the MWP. This includes Antarctica and the Arctic.
Conclusion:
“Regarding the Hockey Stick of IPCC 2001 evidence now indicates, in my view, that an IPCC Lead Author working with a small cohort of scientists, misrepresented the temperature record of the past 1000 years by (a) promoting his own result as the best estimate, (b) neglecting studies that contradicted his, and (c) amputating another’s result so as to eliminate conflicting data and limit any serious attempt to expose the real uncertainties of these data.” – John Christy, Examining the Process concerning Climate Change Assessments, Testimony 31 March 2011
Todays temperatures are cooler than the Medieval Warming Period, which was preceded by an even warmer Roman Warm Period, which followed an even warmer Minoan Warm Period. We are in an Interglacial age about 11,500 years old, and the overall trend is cooling.
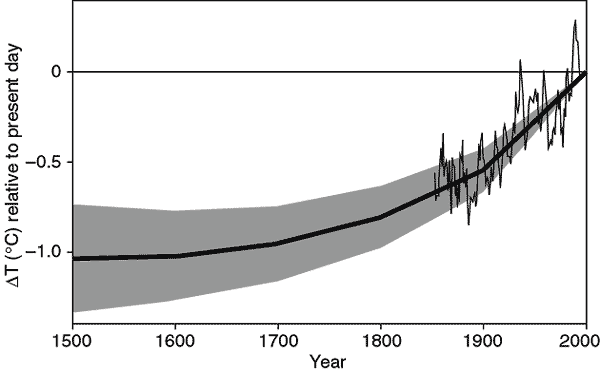
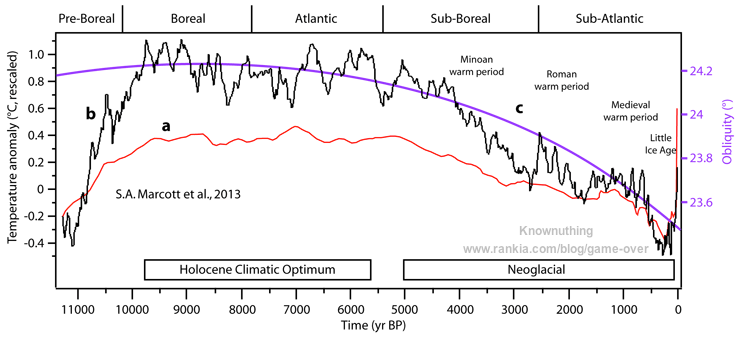
Figure 37. Holocene global temperature change reconstruction. a. Red curve, global average temperature reconstruction from Marcott et al., 2013, figure 1. The averaging method does not correct for proxy drop out which produces an artificially enhanced terminal spike, while the Monte Carlo smoothing eliminates most variability information. b. Black curve, global average temperature reconstruction from Marcott et al., 2013, using proxy published dates, and differencing average. Temperature anomaly was rescaled to match biological, glaciological, and marine sedimentary evidence, indicating the Holocene Climate Optimum was about 1.2°C warmer than LIA. c. Purple curve, Earth’s axis obliquity is shown to display a similar trend to Holocene temperatures. Source: Marcott et al., 2013.
Source:Judith Curry Nature Unbound III: Holocene climate variability (Part A)
Recently I gave my first Tedx talk during Tedx Roermond. Roermond is a city in the south of The Netherlands. The experience was quite interesting. The motto of Ted is “ideas worth spreading”. Apparently not all ideas are worth spreading, because soon after the organisation of Tedx Roermond sent my name and a short description of my ideas to the TED headquarters they received a rather threatening email back that the ultimate consequence could be that they would lose their Tedx license. Kudos to the organisation of Tedx Roermond that they persisted in scheduling my talk and also in uploading it.
The talk is online, however with the following note from TED:
“NOTE FROM TED: We’ve flagged this talk, which was filmed at a TEDx event, because it appears to fall outside TEDx’s curatorial guidelines.The sweeping claims and assertions made in this talk regarding climate change only represent the views of the speaker and are not corroborated by scientific evidence.”
This – “The sweeping claims” – is all rather amusing.
In preparing my talk I wrote down what I wanted to say. That version (not a transcript) differs of course from the final talk I gave in Roermond. The talk is meant to be understandable for a broad audience. Below is the written version of my talk.
Tedx speakers are not allowed to be given a speaking fee, so you have to do all the preparation in your own time. If people appreciate the talk they might consider using the donation button. Thanks!
Marcel Crok, Amsterdam, The Netherlands
I encourage you to go read the whole presentation. Some of his key points are excerpted below.
I am going to talk about two different worlds today, the world of history and the world of the future. In the world of the past we can measure, observe, count, archive etc. The world of the future we can explore by guessing, by extrapolation and by modelling.
I studied chemistry, I then decided to become a science journalist. Late 2004 the editor in chief of the popular science magazine I worked for asked me to look into the famous hockey stick graph.
I did what science journalists do in such a case, I delved into the story. Two Canadians, both ‘outsiders’, had done a lot of audit work on the graph and I decided to contact them. Their story was fascinating and after two years of struggling they found out what was wrong with the graph. They discovered there was a crucial error in the statistics. As a result, even if you used computer generated noise, the hockey stick curve would appear.
They published this in a scientific paper and I had the scoop of their work in the media. We translated the article and published it both in our own magazine Natuurwetenschap & Techniek as in the Canadian newspaper the Financial Post.
It was my first article on climate change ever and right away I was in the middle of not only the Dutch climate debate but even the international debate. The article won an award, but I was also criticized, by KNMI for example, who said publicly my article was “nonsense”. I was also immediately branded as a “climate sceptic”, even by fellow science journalists.
The arguments of the critics were not difficult to refute and the work of the two Canadians stands firmly to this day. I was intrigued by the quite aggressive and also defensive reaction of the climate scientists. Up to this day the criticism of the Canadians has never been fully addressed by the climate science community or the IPCC. Wasn’t this about the progress of science?
I think if climate scientists in The Netherlands and abroad had accepted the criticism of the two Canadians and had corrected their graph, I would have moved on to other topics. But now I became really fascinated and also persistent. If climate change is supposed to be so important, but the science seems to lack self-correction, what about other claims in the climate debate? I decided to quit my job and work fulltime on the climate issue and I have done so ever since.
A broken hockey stick graph doesn’t mean that global warming can’t be a problem. So, let’s look at the evidence.
Now comes the hard part. Correlation doesn’t prove causation. How do we know that the increase in CO2 caused the recent warming? Well, we don’t know. It’s fair to say that the IPCC claims it is most likely that all the warming is caused by greenhouse gases. But there is no way to prove this in a way you prove Newton’s law for example.
The IPCC feels pretty certain – they call it extremely likely – that most of the warming since 1950 is caused by CO2 and other greenhouse gases. The evidence for this claim comes mainly from simulations with climate models. Climate models are huge computer programs that try to simulate the whole climate. It’s quite an accomplishment of the science community, and IPCC nowadays uses the results of around 30 models. These model simulations show that if you don’t use greenhouse gases, the models can’t replicate the warming since the mid seventies till now.
The models, represented by the thick red line, are not able to replicate this early warming that was of about the same magnitude as the warming between 1975 and 2000. So the same models that are used to ‘prove’ that humans caused the recent warming fail to reproduce a warming period earlier in the century. This of course weakens the evidence.
What is going on here? There still is no clear explanation for the early warming period and IPCC reports say very little about it. A logical candidate is what scientists call the Atlantic Multidecadal Oscillation , the AMO.
It’s a quasi-periodic warming and cooling phase of the Atlantic Ocean that influences global temperature. The AMO’s influence is evident in the pattern of global temperature changes. So, it contributes to the warming in both the early and the late warming periods. However, climate models are unable to capture this behaviour. And scientists are still uncertain what causes the AMO.
Now here is what according to me has happened. The climate modellers of course try to replicate historical changes in the Earth’s global temperature because this has become the main indicator for global warming and is a key measure used to judge their models. They manage to simulate both the recent warming and the lack of warming in the middle of last century with a combination of greenhouse gases and aerosols, which are air pollutants. However, both the mid-century flat temperature and the late century warming were partly caused by natural oscillations of the climate system. So, the models more or less replicated the post-1950 global temperature record, but for the wrong reasons.
Over the last few years the evidence for models being oversensitive has been piling up. Only in this decade has the increase in temperature and greenhouse gases since about 1850 become large enough, and the understanding of the influence of aerosols sufficiently good, to estimate with any confidence the sensitivity of the climate based on observations.
Now if we have to summarize the global climate debate in one graph, it could be this one. Mainstream climate scientists don’t like it and try to explain away the differences it shows. Sceptics see it as evidence the models are ‘oversensitive’, that means, overestimating the warming effect of CO2.
The main conclusion from these so-called observational estimates, and I share those, is that observations indicate a much less sensitive climate than the climate models. This is really good news. It means we will get considerably less warming in the future even if CO2 emissions will continue to rise, which is to be expected, since large parts of the world are still developing their economies and cannot do that without fossil fuels.
Extremes Another topic of great societal importance is the occurrence of extremes. That the climate is getting more extreme, is a message we hear almost on a daily basis in the media. But is this so? It might surprise you but for the most consequential extremes in terms of damage and victims, the answer is a clear no. Hurricanes, floods and droughts have not gotten worse because of climate change.
Sea level For us in Holland, sea level has always been a huge topic. We have experienced terrible floods in the past, for example in 1421, when the Saint Elisabeth floods killed an estimated 10,000 people. More recently of course we all remember the floods in Sealand in 1953 which killed almost 2,000 people. The sea level has been rising for the last 150 years or so, both globally and along our coast, but the rise has been remarkably steady throughout this period.
Greening The last thing I want to mention is the greening of the earth. . What are you saying? Yes, the earth is getting greener and indeed, CO2 is causing this. After all, as you all know, CO2 is plant food, so more CO2 in the air means plants are growing faster and better. This also applies to food production. Last week Dutch climate economist Richard Tol said in newspaper De Telegraaf that for this reason climate change so far has probably been beneficial.
Society Now what does this all mean for our personal life? People might be surprised to learn that I live as “green” as one could possibly live. I never had a car, I do everything by bike in Amsterdam. I came here by train. My daughter is the first junior bicycle mayor in the world. But is this because of climate change? No. This is just the lifestyle I like given my circumstances, I live in the centre of Amsterdam.
But there is no need to feel guilty if one owns a car.
Unfortunately, the positive view on the climate issue that I told you today is totally absent in government circles. You could say that climate negotiators live in a parallel universe that is built on the climate models. Perhaps this is the key element for fathoming the discrepancy between the virtual world of unrealistic models and the world you and I live in.
We as human beings should take care of our world in a meaningful way. This is a daily process that we need to figure out here and now, one step at a time. The envisioned grand and utopian future as modelled for us, not with us, spawns a dystopian threat we all know too well from the 20th century.
Politicians often think they can engineer society. Our current political leaders now even believe they can manage the climate. This is a dangerous utopian vision for which the bill is handed over to the citizens.
Thank you Marcel Crok, science writer
Footnote:
Marcel Crok’s story is compelling because he did the work to investigate and apply his critical intelligence. Presumably all TED presenters are expressing their own conclusions supported by the evidence they have found. So why does TED think it necessary to warn people away from his findings, and claim that his supporting evidence is somehow invalid? It can only be that that a narrative of “climate emergency” is favored by that organization, and contrary views are unacceptable. Marcel Crok has bravely followed the evidence and his conscience and must be heard.
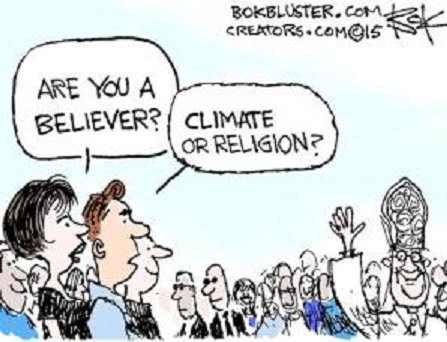

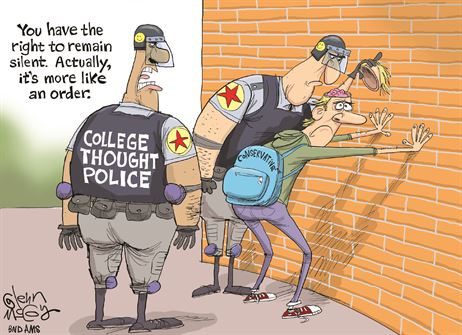
 Climate Discussion Nexus explains: (in italics with my bolds)