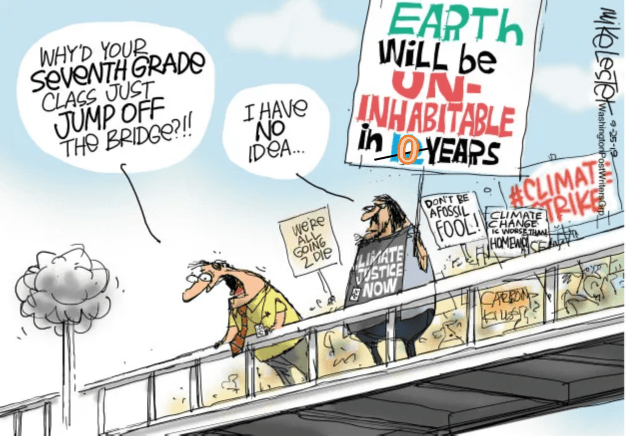
On Climate Grooming the Children

A man who has not been a socialist before 25 has no heart.
If he remains one after 25 he has no head.—King Oscar II of Sweden

One of the observations about the 2022 midterms was how strongly young unmarried women voted for the socialist agenda of today’s Democratic party.  I recall a video clip of two university students saying their vote was all about women’s abortion rights, and thinking these two male nerds’ politics might be biased by their desire to get lucky some night.  But beyond that issue is the campaign of brainwashing children regarding global warming/climate change.

Benjamin Khoshbin shines some light into this climate political grooming in his Real Clear Energy article The Electoral Case for Commonsense Environmentalism  Somewhere Between “No More Meat” and “It’s a Hoax:”  Excerpts in italics with my bolds.

We’ve all heard the adage, that a young person not thinking socialist has no heart, while an older person still a socialist has no head.  It sounds true, but it’s not — young voters are no longer aging into conservatism. While Gen X and Boomers did trend more conservative as they aged, Millennials in the U.S. are becoming more liberal as they age, and are estimated to be the most liberal 35-year-olds in recorded U.S. history.

Based on their behavior in the 2022 midterms, Gen Z is likely to follow suit.

According to the Edison Research National Election Pool exit poll, 63% of Gen Z voted for Democrats in House races, compared to just 35% who voted for Republicans — a whopping 28-point gap. While many salient issues for young voters are likely driving this, one stands out: climate change.

Millennials and Gen Z are more concerned about climate change than any other generation. A Harris Poll survey of American 13–19 year-olds found that more than 8 in 10 teens believed that if climate change isn’t addressed today, it will be too late for future generations as some parts of the planet will become unlivable. Nearly 80% of teens in the survey also believed that protecting the environment should take priority over economic growth.

My deeper look into the 4H/Harris Survey

I have posted before on climate push polls designed to get results supporting a political agenda.  What participants say is shaped by how questions are asked and answered. This survey was conducted online within the United States by The Harris Poll on behalf of 4-H from January 5 to January 18, 2022, among 1,500 respondents ages 13-19.   The age cohort is interesting to show how successfully has been the educating of children regarding environmental concerns, and especially climate change.  The survey content is here Environmental Impact Survey  Exploring the impact of the environment on teens.

Indeed the title of the report refers not to impact upon nature, but rather the impact of environmental messaging upon impressionable teenagers.  The survey itself consisted of stating preferred conclusions and offering agree/disagree options.  Typically strongly and somewhat agree responses are lumped together into agree percentages.  Some Examples:

84% of teens agree, “I am concerned that if we don’t do more to protect the environment, humans and other species, wildlife will suffer and possibly go extinct.”

82% of teens agree, “If we don’t do more to protect the environment today, I expect to have to make future life decisions based on the state of the environment, including where I live, what kinds of jobs will be available, or if I will have children.”

56% of teens agree, “International governments are working towards global initiatives and policies to protect our planet.”

84% of teens agree, “Climate change will impact everyone in my generation through global political instability.”

84% of teens agree, “If we don’t address climate change today, it will be too late for future generations, making some parts of the planet unlivable.”

69% of teens agree, “I am worried that my family and I will be affected by climate change in the near future.”

77% of teens agree, “I feel responsible to protect the future of our planet.”

84% of teens agree, “We need more corporate action from companies today to improve our climate for tomorrow.”

83% of teens agree, “We need more legislative action from government today to improve our climate for tomorrow.”

79% of teens agree, “Protecting the environment should take priority over economic growth.

Khoshbin: These findings should trouble Republicans. Young voters believe that climate change is an existential threat, but they mistakenly think that environmental protection and economic growth are mutually exclusive. In reality, since 2005, 32 countries — both developing and developed — have absolutely decoupled carbon emissions from GDP growth, having successfully grown their economies while simultaneously reducing carbon emissions.

My Comment:

That is not the only mistaken perception among these teens.  Mind you, they were only exposed to the alarmist POV, and followed their hearts and feelings.  Note the repeated 84% agreement percentage suggests a central tendency in responses with little if any consideration of nuances between statements.  Basically this survey confirms that a narrative is embedded in these people.

An interesting contradiction appears here:

• Over 9 in 10 teens grew up engaging in a number of outdoor activities, yet today a majority of teens spend 5 hours or less outside per week – or less than 11 days a year

Another survey source indicates where children get information NEEF Teen Benchmark Survey National Environmental Education Foundation (NEEF): Some relevant findings:

See Also

The Art of Rigging Climate Polls

YouGov Climate Push Poll: Still no Believer Majority


Update on Fight Against Ballot Abuse

Jay Valentine further educates the public on purifying elections in his recent American Thinker article Tracking a Fraudulent Ballot in Real Time.  Excerpts in italics with my bolds.

During our year with Mike Lindell, the Fractal team went from never having seen an election roll to running the largest election database ever created, with over 1.7 billion records — for 12 states alone.

With only 165 million or so voters in the United States, why such a large database?  Data travel, data move, data tell a story as they traverse different databases — over time.

Voter Identity

Let’s take an example.

Phineas Phrogg, our made up character, is on a voter roll. Phineas owns a home, has three credit cards, two cars, does limited social media, is a deacon at his church and active in the Lions Club.

Phineas’s data in any single database yield 1 x 1 = 1 level of insight.  A state voter roll, taken on March 15, is a flat surface with little actionable information.

If we take multiple databases where Phineas appears — his credit file, auto history, auto registration, donation info, and perhaps ten other common places Phineas innocently appears, we get a relief map — not a flat surface.

Artificial intelligence predicts a lot of what Phineas is likely to do and likely to buy.  Here Phineas’s information is 1 (Phineas) x number of data sources = 1,000 or 10,000 data points. The A.I. program knows more about Phineas than he may know himself.

This is not high tech. Every major consumer goods company does this work today
— every reader of this article exists in scores of these databases.

Now for the hard stuff.

Voter Behavior

What if we take a snapshot of every one of Phineas’s databases on different dates? Perhaps every month, or every week?  We see Phineas’s actions over time.

We see Phineas’s likes and dislikes in one database — perhaps the car he chooses — change over the time series. We can probably tie some of those new preferences to changes in another data source — perhaps a contribution database.

Phineas started giving money to animal rescue. This change might ripple through some other preferences as well. Maybe he is moving toward being a vegetarian.

The A.I. systems for the consumer goods company will pick this up, too — three years from now. We identify the behavior change almost instantly.

Finding Dirty Data in the Haystack

That, people, is a game-changer.

That is why, for a single state, like Pennsylvania or Georgia, we collected over 350,000,000 (350 million) records from the voter rolls in less than one year. I just wanted you to see all the zeroes.

When our team built the TSA No-Fly List technology and the auto fraud systems for State Farm, GEICO, USAA, and others, their data teams bemoaned the “dirty data” in those databases. They had clear agità from the misspellings, wrong addresses, different ways to show an address, fraudulent entries.

Our team loved dirty data.  This is not a porno thing. Dirty data — inaccuracies, misspellings, multiple ways of entering a street name — are Hansel’s and Gretel’s little stones leading to insight you cannot find anywhere else.

For eBay, when we built their cyber-fraud prevention system — they had already called the Secret Service, the FBI, every neural net company — they were all stymied by — you guessed it — dirty data!

The data magnification lesson is over. Let’s get to voter rolls.

Uncovering Phantoms in the Voter Rolls

If you do not think the government’s election commissions are in on the massive voter fraud inherent in every state’s voter rolls, you can stop reading here — because they are, and we can prove it in state after state. Read some of our reports on www.Omega4America.com.

Anyone can compare voter rolls with NCOA (the National Change of Address database) and find people who moved. Any high school math kid can run statistics against voter rolls and find anomalies growing on trees. Any tech quant, living in his parents’ basement, can run an obscure algorithm showing vote numbering inconsistent with historical patterns.

Come to think of it, in 2021 and 2022, these guys were everywhere — and they didn’t remove fake voters. Time to move on — they failed, and the Republicans failed with them.

We know phantom voters are the seed bed for fake ballots.

The ballots aren’t fake — they are quite real, but called “fake” because they aren’t voted by the name on their envelope.   We know that fake ballots are mailed, at industrial scale, to legitimate voters, fake voters, dead voters, voters who moved.

The Fractal election system is used by voter integrity teams to show, by cross-searching personal property rolls, for instance, that Phineas Phrogg votes and lives at an address that is an Ace Hardware Store. That should be enough to get Phineas off the voter roll.  What if it isn’t? 

The UnDeliverable Ballot Database is not a “bad address” list.

It is real time — almost, depending on the data — using snapshotting technology developed with the Wisconsin voter integrity team. It picks up changes in multiple data sources — constantly!

Here are examples from 2020 and 2022:

Phineas lives at an apartment building with 125 units. The property roll tells us it is a multi-family unit, but Phineas does not have his unit or apartment number in the election roll — so a ballot is going to Phineas, but he won’t get it.

We know this today — two years before 2024.

We can know this for every apartment building in every state, in every county in America, in 90 days. Maybe right now might be a good time to take action to either get Phineas’s apartment number in the voter roll or get him off it.

But if not, we know with certainty that his ballot cannot legally be voted.

A local integrity team may want to hang out when ballots arrive — with the leftist who will certainly be there — to track what happens with that ballot. No voter intimidation here — just want to make sure the leftist kid there to collect Phineas’s ballot…doesn’t!

Fractal cross-searches every voter against every physical address he claims to inhabit
— and kicks out “anomalies.”

In a Midwestern state this month, canvassers who used the RNC data for electioneering months ago — used the Fractal-cleaned lists — said, “In 22 years canvassing, we have never seen such accurate lists. The RNC lists were garbage.”   Because Fractal told them the square footage of every single-family residence, they could determine which were phantom nests with 15 registered adults in an 800-square-foot home.

The Wisconsin team innovated in 2022 with the “root query.”

The Fractal system found 1,250 people living at a single address — a college dorm. The Wisconsin team found that only 300 people can live there at any one time. Good find.  That was not enough for these guys. They had the Fractal team create the “root search” — thus digging into the address one layer deeper. Guess what! Not only were 1,250 people getting ballots at an address where only 300 can live, but 450 of those ballots went to a single dorm room!

What if that room number changes?  The Fractal system picks it up by snapshotting the voter rolls every month. RNC data — well, tough luck!   Thus, the UnDeliverable Ballot database knows where 900 fake ballots are going to be sent — even when they change the address!

Multiply that by every college dorm in America, every apartment building, homeless shelter, church — you get to election-impacting pretty fast!  Think maybe that might be cool info to know?

We are fortunate that our teams used the RNC lists and the Fractal lists in the same state, months apart, with massively different results. Thus, perhaps a tech solution is at hand.

As we work with voter integrity teams to create the UnDeliverable Ballot Database in other states, we look to ingest literally trillions of records — with tons of dirty data — because we can know with certainty where a 2024 ballot is going. But Phineas isn’t going to get it.


Geologists’ Turn in Anti-Science Barrel

David Lewis Schaefer reports on the attempted political takeover of the profession in his American Mind article A Sad New Epoch.  Excerpts in italics with my bolds and added images.

Even the field of geology is rejecting science in the name of making political statements.

The Anthropocene Working Group of geologists, featured on the front page of the New York Times, is poised to announce the discovery/invention of a new epoch in the Earth’s history, beginning in the middle of the 20th century. Whereas seven previous epochs ranged from 4.6 billion to the most recent one, the “Holocene” (11,700 years since the end of the last ice age), during which homo sapiens evolved, scientists in the working group claim that no broad numbers are needed to date the Anthropocene since developments caused by humans, such as the increased use of nitrogen fertilizers, global warming, “the proliferation of plastics, garbage, and concrete across the planet,” and potential nuclear war, are directly visible to us. The group claims that the effects of the new age “will be discernible in the rocks for millenniums.”

The iconic Metronome clock in New York City was repurposed as an 80-foot-wide climate clock that shows our remaining time to take urgent action on climate change. (photo credit: BEN WOLF)

Certification of the new epoch will require a 60% vote by four committees. If it fails to receive such a vote from any of the committees, the Times warns it “might not have another chance to be ratified for years.”

But of course this isn’t how science develops, properly understood. As Stanley C. Finney, the secretary-general of the International Union of Geological Sciences, has observed, the notion of the Anthropocene has become a way for geologists to make a “political statement.” One advocate of the statement (a historian of science, not a geologist) explains that whereas she had once been taught “that geology ended when people showed up,” the Anthropocene designation signifies that “actually, the human impact is part of geology as a science.” Another expresses the fear that failing to recognize the Anthropocene would have “political reverberations,” as if the “geological community is denying” that human beings “have changed the planet drastically.” As another proponent of what we might term geological mission creep puts it, “I always saw [the designation] not as an internal geological undertaking, but rather one that would be greatly beneficial to the world at large,” as “a call to attention.” In other words, let’s mend our sinful ways!

The term “Anthropocene” is reported to have been coined and popularized by biologist Eugene Stormer and Nobel Prize-winning chemist Paul Crutzen in 2000. It has since been put to wider use by political activists as a way of indicating that humanity’s presence is just one more passing stage.

In fact, some even look forward to the end of that stage so as to restore
Mother Earth to her pristine, pre-human condition.

Instead of simply accepting widespread climate change dogma, shouldn’t geologists be aware of the transition from the sometimes devastating Little Ice Age, variously defined by scientists as running from the 14th or 16th centuries through the mid-19th century, to more moderate worldwide climates, which began long before the invention of the internal combustion engine? (The Little Ice Age, confined largely to areas of northern Europe, followed a preceding Medieval Warming period.) Scientists have attributed those changes to such causes as cyclical lows in solar radiation, heightened volcanic activity, changes in the ocean circulation, and variations in Earth’s orbit and axial tilt.

Have those forecasting devastation from a warming climate considered the significance of millennia-old corpses, like Ötzi, sometimes discovered under many feet of snow in areas like the Alps, suggesting a longer-term cooling trend? And why dismiss the likelihood that scientific research will uncover means of combating detrimental effects from excessive heat: should that occur, would the geologists have to reverse their announcement of the new epoch?

This politicization of science encourages an unjustified suspicion or rejection of real science.

Look no further than Anthony Fauci’s sometimes contradictory, and admittedly sometimes purposely misleading, pronouncements regarding the causes of and appropriate responses to COVID, which have eroded public trust in the institution of public health. Also, as politically appealing “discoveries” win the attention and respect of science educators, they will inevitably be integrated into science curricula, starting at the elementary or middle school level. Students will not only be indoctrinated into the latest, politically correct dogmas, but they will be misled as to the nature of the scientific enterprise.

Given their subject of expertise, geologists are probably less equipped than physicists, chemists, and biologists to conduct controlled experiments in the Baconian sense. That fact does not make their undertaking any less a science but only confirms the observation made by Aristotle that different objects of study require different sorts of scientific approaches. But it does not excuse them from the need to offer rebuttable hypotheses, always subject to revision or even refutation in light of further data or a more comprehensive explanation.

Yet how can they possibly document the prediction reported in the Times that the effects
of the human activities they cite will be discernible for millennia?

Announcing the “discovery” that the world has suddenly reached a new epoch, within living memory, resembles nothing so much as the pronouncements once issued by Christian millenarians that “the end is near.” In fact, one advocate quoted in the Times views the authorization of the new epoch as its “canonization.”

Note the ominous claim that the new era will
“bring the previous chapter of the Earth’s history to a close.”

But how can any human being, lacking divine guidance, be qualified to pronounce such a change? If we have just embarked on the Anthropocene era, what could follow it? If there is a post-Anthropocene epoch, there won’t be any human beings left to record it. Geologists, please curb your eagerness to grab the world’s “attention” or make it comply with your political-theological wishes, and stick to your cores and samples. The world will be the better for it.

Climate Reparations a Lose-Lose-Lose Deal

https://video-api.wsj.com/api-video/player/v3/iframe.html?guid=E6B05E12-0E60-4B80-A8A2-565460ABABF5

At the recently concluded UN climate summit, wealthy nations agreed to pay climate reparations to poor countries. Unfortunately, this could ultimately be a bad deal even for the recipients, if the West expects developing nations to forego fossil fuels that would help them to develop and get more resilient towards natural disasters. Bjorn Lomborg also discussed the topic on The Journal Editorial Report with Wall Street Journal editor Paul Gigot.

The link to the video clip of the interview is in red above, and below a lightly edited transcript of the conversation.  PG refers to Paul Gigot and BL to Bjorn Lomborg.  Transcript is in italics with my bolds and added images.

PG: The COP27 conference in Egypt wrapped up last week with President Biden signing on to a climate reparations plan. Under the agreement wealthy countries would pay into a new fund to compensate poor countries for supposed damage caused by rich country use of fossil fuels. The move represents a major reversal in U.S. policy with the Biden administration’s climate envoy John Kerry dismissing the idea just weeks ago, saying that a compensation fund was “just not happening.”

Let’s bring in Bjorn Lomborg, President of the Copenhagen Consensus Center and a visiting fellow at the Hoover Institution. He’s also author of the book False Alarm: How Climate Change Panic Costs Us Trillions, Hurts the Poor and Fails to Fix the Planet.

Welcome back, Bjorn. So first of all, what do you make of climate reparations fund idea? Is it a good idea, or not?

BL: No it’s mostly a bad idea. Look, there’s a lot of different things you can think about it. But first and foremost, if you step back, we’ve been trying to solve climate, which is a real issue, for what, 30 years now. It’s the 27th Conference. And now we’re basically moving from fixing climate–Which would obviously entail, How do we get technologies out so people actually cut their carbon emissions–to now saying, no, let’s just make it about money.

The second part is, of course, this is payback for the incredible amount of exaggeration that’s been going on for the last 30 years. If you tell everyone that this is terribly dangerous and it’ll endanger basically the survival of the human race. Don’t be surprised when most people are gonna say, “Well then, you know, give me some money, for putting me in this dangerous situation.” That’s not the right way to look at this. The economic estimates show that global warming will be a problem; we’re talking about perhaps 4% of GDP by the end of the century, not a wipe out.

And then the really damaging thing is that much of this money, if it at all materializes, it will be spent on rich countries paying poor countries not to use fossil fuels. Which essentially means not developing. And of course that will leave them undeveloped. That will leave them in poverty. And why is it that these countries like Pakistan are vulnerable to flooding? Remember most of Pakistani floods came from bad governance, lots of bad infrastructure and lots of people. It’s because they’re vulnerable, because they’re poor. So leaving them poor is the worst way to help fix the problem of climate change.

So this will leave the world worse off, and of course leave rich countries with a huge bill.

PG: I find your arguments compelling, Bjorn, but then why did the Europeans decide, in the first instance, to change their minds on this, to go ahead and endorse this reparations fund. And that isolated the U.S., which I gather felt then they couldn’t be isolated and had to go along. Why did the Europeans insist on this?

BL: It’s hard to tell. My gut feeling, and I wasn’t there, my gut feeling is they realized that nothing was coming out of the Sharm El-Sheikh meeting of the COP 27. So we need to have some sort of success. So let’s say yes to this, which the developing world was very strongly pushing. Look if you go to all of these meeting, and virtually nothing comes out of it; if there’s the possibility of getting trillions out of it, I can understand why a lot of leaders would sign up for basically free money.

But the reality is, much of this could end up not happening, because remember the U.S. Congress has to appropriate: That does not seem plausible. The New York Times said, “We now have a fund but there is no money in it. So it seems likely this will not come true. Most countries are not feeling very flush right now. I can’t imagine most countries saying, “ Sure, let ‘s pay another couple of trillion dollars to the developing world.

First and foremost let’s remember that if this actually happened, it would likely prevent poor countries from using fossil fuels, which is one of the key ways to get out of poverty. Remember China dramatically industrialized by using lots and lots of fossil fuels, and almost lifted a billion people out of poverty. That’s an amazing achievement. And most people in the developing world want to do the exact same thing. So in a sense, we are setting all of ourselves up for really bad outcomes in the future.

PG: There’s kind of a guilt tax quality to this, where the West is supposed to pay for the sin of having actually developed first, and for being prosperous in part by using fossil fuels. But China isn’t tapped to pay into this fund at all. And it’s building coal plants at a rapid pace, to the point where its projected new plants are going to dwarf all of the U.S. current coal production by 2025. How can China remain out of all of this?

BL: Well, first of all, because that would be really convenient for China. They are categorized as a developing country in the UNFCCC agreement that encompasses the COP negotiations. And of course, it you’re China, you wanna stay that way. I think it’s also fair to say that China has still only historically emitted only about half of what the U.S. or Europe has done. So there is some justification to this. But we have to very clearly separate the fact that you could make the argument that a little bit of reparations make philosophical sense.

But if you start in letting that genie out of the bottle, you’ll make the whole conversation about that, and forgetting to actually fix climate change.

Which is about making green energy much cheaper in the future through innovation. That’s what we should be focusing on if we actually want to fix this. And secondly, you’ll also have this situation where India, China and almost everyone else is not going to pay into this potentially enormous cost.

Summation

Climate reparations is a move in which rich nations lose, poor nations lose and energy innovation loses,  And as noted previously, the winners will be lawyers and accountants, as well as sovereign hydrocarbon producers.

Climate Loss and Damage, Legal House of Cards


In Honor of Fred Singer

S. Fred Singer (1924 – 2020) passed away on April 6, 2020 at the age of 95.

Dr. Singer is the author, coauthor, and editor of many books, including Climate Change Reconsidered (several volumes), a comprehensive critique of the assessment reports of the United Nations’ Intergovernmental Panel on Climate Change. He was a senior fellow of The Heartland Institute and research fellow with the Independent Institute.

Dr. Singer published more than 200 technical papers in peer-reviewed scientific journals,  His editorial essays and articles have appeared in Cosmos, The Wall Street Journal, New York Times, New Republic, Newsweek, Journal of Commerce, Washington Times, Washington Post, and many other publications. His accomplishments have been featured in front-cover stories appearing in Time, Life, and U.S. News & World Report

Dr. Singer was an elected Fellow of the American Association for the Advancement of Science (AAAS), American Geophysical Union, American Physical Society, and American Institute for Aeronautics and Astronautics.  Dr. Singer gave hundreds of lectures and seminars on global warming, including to the science faculties at leading universities around the world.

This post commemorates his steadfast labors to expose the truth of climate change as a natural variability and to neutralize the poison of claiming humans are causing a climate crisis or emergency.  To this end below is a synopsis of his analysis originally published Sept. 10, 2001 in the Wall Street Journal.  The source is Water Vapor Rules the Greenhouse System at ClimateCite.

Just how much of the “Greenhouse Effect” is caused by human activity?

It is about 0.28%, if water vapor is taken into account– about 5.53%, if not.

This point is so crucial to the debate over global warming that how water vapor is or isn’t factored into an analysis of Earth’s greenhouse gases makes the difference between describing a significant human contribution to the greenhouse effect, or a negligible one.

Water vapor constitutes Earth’s most significant greenhouse gas, accounting for about 95% of Earth’s greenhouse effect (4). Interestingly, many “facts and figures’ regarding global warming completely ignore the powerful effects of water vapor in the greenhouse system, carelessly (perhaps, deliberately) overstating human impacts as much as 20-fold.

Water vapor is 99.999% of natural origin. Other atmospheric greenhouse gases, carbon dioxide (CO2), methane (CH4), nitrous oxide (N2O), and miscellaneous other gases (CFC’s, etc.), are also mostly of natural origin (except for the latter, which is mostly anthropogenic).

For those interested in more details a series of data sets and charts have been assembled below in a 5-step statistical synopsis.

Note that the first two steps ignore water vapor.

♦ 1. Greenhouse gas concentrations

♦ 2. Converting concentrations to contribution

♦ 3. Factoring in water vapor

♦ 4. Distinguishing natural vs man-made greenhouse gases

5. Putting it all together

Note: Calculations are expressed to 3 significant digits to reduce rounding errors, not necessarily to indicate statistical precision of the data. All charts were plotted using Lotus 1-2-3.

Caveat: This analysis is intended to provide a simplified comparison of the various man-made and natural greenhouse gases on an equal basis with each other. It does not take into account all of the complicated interactions between atmosphere, ocean, and terrestrial systems, a feat which can only be accomplished by better computer models than are currently in use.

1. The following table was constructed from data published by the U.S. Department of Energy (1) and other sources, summarizing concentrations of the various atmospheric greenhouse gases. Because some of the concentrations are very small the numbers are stated in parts per billionDOE chose to NOT show water vapor as a greenhouse gas!

TABLE 1.The Important Greenhouse Gases (except water vapor)
U.S. Department of Energy, (October, 2000) (1)

Table 1 is not a very meaningful view because 1) the data has not been corrected for the actual Global Warming Potential (GWP) of each gas, and 2) water vapor is ignored.  But these are the numbers one would use if the goal is to exaggerate human greenhouse contributions:

The various greenhouse gases are not equal in their heat-retention properties though, so to remain statistically relevant % concentrations must be changed to % contribution relative to CO2. This is done in Table 2, below, through the use of GWP multipliers for each gas, derived by various researchers.

2. Using appropriate corrections for the Global Warming Potential of the respective gases provides the following more meaningful comparison of greenhouse gases, based on the conversion:

concentration ) X ( the appropriate GWP multiplier (2) (3) of each gas relative to CO2 ) = greenhouse >contribution.:

TABLE 2.Atmospheric Greenhouse Gases (except water vapor)
adjusted for heat retention characteristics, relative to CO2

NOTE: GWP (Global Warming Potential) is used to contrast different greenhouse gases relative to CO2.

Compared to the concentration statistics in Table 1, the GWP comparison in Table 2 illustrates, among other things:

♦  Total carbon dioxide (CO2) contributions are reduced to 72.37% of all greenhouse gases (368,400 / 509,056)– (ignoring water vapor).

Also, from Table 2 (but not shown on graph):

♦  Anthropogenic (man-made) CO2 contributions drop to (11,880 / 509,056) or 2.33% of total of all greenhouse gases, (ignoring water vapor).

♦  Total combined anthropogenic greenhouse gases becomes (28,162 / 509,056) or 5.53% of all greenhouse gas contributions, (ignoring water vapor).

To properly represent the total relative impacts of Earth’s greenhouse gases Table 3 (below) factors in the effect of water vapor on the system.

3. Table 3, shows what happens when the effect of water vapor is factored in, and together with all other greenhouse gases expressed as a relative % of the total greenhouse effect.

TABLE 3.Role of Atmospheric Greenhouse Gases
(man-made and natural) as a % of Relative
Contribution to the “Greenhouse Effect”

Total atmospheric carbon dioxide (CO2) — both man-made and natural– is only about 3.62% of the overall greenhouse effect— a big difference from the 72.37% figure in Table 2, which ignored water!

Water vapor, the most significant greenhouse gas, comes from natural sources and is responsible for roughly 95% of the greenhouse effect (4). Among climatologists this is common knowledge but among special interests, certain governmental groups, and news reporters this fact is under-emphasized or just ignored altogether.

Conceding that it might be “a little misleading” to leave water vapor out, they nonetheless defend the practice by stating that it is “customary” to do so!

4. Of course, even among the remaining 5% of non-water vapor greenhouse gases, humans contribute only a very small part (and human contributions to water vapor are negligible).

Constructed from data in Table 1, the charts (below) illustrate graphically how much of each greenhouse gas is natural vs how much is man-made. These allocations are used for the next and final step in this analysis– total man-made contributions to the greenhouse effect. Units are expressed to 3 significant digits in order to reduce rounding errors for those who wish to walk through the calculations, not to imply numerical precision as there is some variation among various researchers.

5. To finish with the math, by calculating the product of the adjusted CO2 contribution to greenhouse gases (3.618%) and % of CO2 concentration from anthropogenic (man-made) sources (3.225%), we see that only (0.03618 X 0.03225) or 0.117% of the greenhouse effect is due to atmospheric CO2 from human activity. The other greenhouse gases are similarly calculated and are summarized below.

TABLE 4a.Anthropogenic (man-made) Contribution to the “Greenhouse
Effect,” expressed as % of Total (water vapor INCLUDED)This is the statistically correct way to represent relative human contributions to the greenhouse effect.

From Table 4a, both natural and man-made greenhouse contributions are illustrated in this chart, in gray and green, respectively. For clarity only the man-made (anthropogenic) contributions are labeled on the chart.

♦  Water vapor, responsible for 95% of Earth’s greenhouse effect, is 99.999% natural (some argue, 100%). Even if we wanted to we can do nothing to change this.

♦  Anthropogenic (man-made) CO2 contributions cause only about 0.117% of Earth’s greenhouse effect, (factoring in water vapor). This is insignificant!

♦  Adding up all anthropogenic greenhouse sources, the total human contribution to the greenhouse effect is around 0.28% (factoring in water vapor).

The Kyoto Protocol calls for mandatory carbon dioxide reductions of 30% from developed countries like the U.S. Reducing man-made CO2 emissions this much would have an undetectable effect on climate while having a devastating effect on the U.S. economy. Can you drive your car 30% less, reduce your winter heating 30%? Pay 20-50% more for everything from automobiles to zippers? And that is just a down payment, with more sacrifices to come later.

Such drastic measures, even if imposed equally on all countries around the world, would reduce total human greenhouse contributions from CO2 by about 0.035%.

My Comment

Readers may have wondered, as I have, how the typical Earth Energy Balance diagrams can show surface solar radiation amounting to ~161 W/m2 and downwelling IR atmospheric radiation ~333 W/m2, more than twice as much.  This despite the fact that shorter wavelengths are more energetic and longer wavelengths have less energy.

Part of the problem lies in calculating the conversion from radiation amounts to energy.  The formula is Energy level E = pV, where p is the Planck constant and V is the frequency.  Too often the shortcut is to assume the average frequency of visible light as the conversion factor.  That is a reasonable assumption for sunlight, but greatly exaggerates the energy of LWIR, which is 10 to 20 times longer than sunlight wavelengths.

In the tables above Dr. Singer did all the calculations considering each GHG’s volume and adjusted it by its ability to absorb IR radiation and the energy carried by each IR frequency.

Footnote

A comment below dismisses Fred Singer’s expertise, likely based on a popular climate paradigm that is logical, simple and wrong.  To understand the flaws in thinking about earth’s climate, see this post:

2021 Update: Climate Reductionism

For a better understanding of the role of H2O, see William Gray’s paper, synopsis here:

Bill Gray: H20 is Climate Control Knob, not CO2

World of CO2 Infographics Update

Update January 25, 2023

Raymond notified me that this new repository is live and standalone with some improvements.  The previous location links are gone and the infographics are available as described below.

The World of CO₂” charts are officially hosted here only!

http://www.the-world-of-co2.org

https://www.the-world-of-co2.org/co2

https://www.the-world-of-co2.org/the-world-of-climate-change

https://www.the-world-of-co2.org/the-world-of-energy

https://www.the-world-of-co2.org/the-world-of-ice-ages

Previous Post

This post is to announce that Raymond Inauen of RIC-Communications has a website up for the public to access a series of infographics regarding CO2 and climate science.  As seen above, the website is  here:

The World of CO2


Readers will be aware of previous posts on the four themes to be discovered.  Raymond introduces this resource in this way:

WELCO₂ME

Would you like to learn more about CO₂ so you can have informed conversations about climate policy and future energy investments? Or would you rather pass judgment on CO₂ after learning about the basics? Then this is the website for you.

There are 29 infographic images that can be downloaded in four PDF files.  Thanks again, Raymond for your interest and efforts to make essential scientific information available to one and all.

Energy Transition and Impossible Dreams

Daniel Yergin writes at Project Syndicate The Energy Transition Confronts Reality.  Excerpts in italics with my bolds and added images.

Given the scale and complexity of the transition away from hydrocarbons, some worry that economic analysis has been given short shrift in the policy planning process. A clear-eyed assessment of the transition’s prospects requires a deeper understanding of at least four major challenges.

Overview

The “energy transition” from hydrocarbons to renewables and electrification is at the forefront of policy debates nowadays. But the last 18 months have shown this undertaking to be more challenging and complex than one would think just from studying the graphs that appear in many scenarios. Even in the United States and Europe, which have adopted massive initiatives (such as the Inflation Reduction Act and RePowerEU) to move things along, the development, deployment, and scaling up of the new technologies on which the transition ultimately depends will be determined only over time.

Progress of civilization through changing mixes of energy sources.

Beware:  The Imagined Transition is to be Sudden and not Additive.

The term “energy transition” suggests that we are simply taking one more step in the journey that began centuries ago with the Industrial Revolution. But in examining previous energy transitions for my book The New Map, I was struck by how different this one is. Whereas technology and economic advantage drove earlier transitions, public policy is now the most important factor.

Moreover, previous energy transitions unfolded over the course of a century or more, and they did not wholly displace the incumbent technologies. Oil overtook coal as the world’s top energy source in the 1960s, yet we now use three times more coal than we did back then, with global consumption hitting a record high in 2022.

By contrast, today’s transition is intended to unfold in little more
than a quarter-century and not be additive.

Given the scale of what is envisioned, some worry that macroeconomic analysis has been given insufficient attention in the policy-planning process. In a 2021 paper for the Peterson Institute for International Economics, the French economist Jean Pisani-Ferry notes that moving too rapidly to net-zero emissions could precipitate “an adverse supply shock – very much like the shocks of the 1970s.” He warns that a precipitous transition “is unlikely to be benign and policymakers should get ready for tough choices.”

Hard Reality #1  Energy Security is Top Priority

Developments since energy markets began to tighten in the late summer of 2021 point to four big challenges to watch out for. First, owing largely to the disruptions caused by Russia’s war in Ukraine, energy security has become a top priority again. For the most part, keeping the lights on and factories operating still requires hydrocarbons, so energy security means ensuring adequate and reasonably priced supplies and insulation from geopolitical risk and economic hardship.

Even with climate change remaining a central focus, US President Joe Biden administration’s has urged domestic companies to increase their oil production and released supplies from the Strategic Petroleum Reserve at a far greater scale than any previous administration. In Germany, the Greens in the governing coalition have spearheaded the development of the country’s capacity to import liquefied natural gas, with the first deliveries of LNG from the US arriving this month through infrastructure built in less than 200 days. Energy security is not something that is going to be assumed away in the years ahead.

Hard Reality #2  The Scale Reaches Beyond Our Means

The second challenge concerns scale. Today’s $100 trillion world economy depends on hydrocarbons for over 80% of its energy, and nothing as massive and complex as the global energy system can be transformed easily. In an important new book, How The World Really Works, noted energy scholar Vaclav Smil argues that the four essential “pillars of modern civilization” are cement, steel, plastics, and ammonia (for fertilizer), each of which is heavily dependent on the existing energy system.

Given these starting conditions, will solutions like veganism help? Smil points out that five tablespoons of petroleum are embodied in the system that gets a single tomato from cultivation in Spain (including the required fertilizer) to a dinner table in London. Yes, energy efficiency could be improved. But the main effects will show up in developed countries, rather than in the developing world, where 80% of all people live, and where rising incomes will drive up energy demand.

Land required for wind farms to power London UK.

Hard Reality #3 North and South Interests Conflict

That points to the third challenge: the new North-South divide. In the Global North – primarily Western Europe and North America – climate change is at the top of the policy agenda. But in the Global South, that priority coexists with other critical priorities, such as boosting economic growth, reducing poverty, and improving health by targeting indoor air pollution from burning wood and waste.

Hence, for many in the developing world, “energy transition” means
moving from wood and waste to liquefied petroleum gas.

This divide was vividly illustrated last year when the European Parliament passed a resolution denouncing a proposed oil pipeline running from Uganda through Tanzania to the Indian Ocean. MEPs objected that the project would adversely affect the climate, the environment, and “human rights.” Yet they cast their votes from a body located in France and Belgium, where per capita income (in current dollars) is, respectively, 50 times and 60 times greater than in Uganda, where the pipeline is seen as a foundation for economic development. The resolution provoked a furious reaction. The deputy speaker of Uganda’s parliament denounced the Europeans for exhibiting “the highest level of neocolonialism and imperialism against the sovereignty of Uganda and Tanzania.”

Hard Reality #4 Materials Demands Blow Away Supplies

The fourth challenge concerns the material requirements of the energy transition. I see this as the shift from “Big Oil” to “Big Shovels” – that is, from drilling for oil and gas to mining the minerals for which demand will increase enormously in a world that becomes more electrified.

In a new S&P study, The Future of Copper, we calculate that the supply of “the metal of electrification” will have to double to support the world’s 2050 climate objectives. Recently, a host of authorities – including the US and Japanese governments, the European Union, the World Bank, the International Monetary Fund, and the International Energy Agency – have all published alarming reports about the expected exponential growth in demand for minerals such as lithium and cobalt.

But alarm itself will not open major new mines, a process estimated to take 16-25 years and which faces ever-more complex permitting requirements around the world. In some key resource countries, governments are openly hostile to mining.

So, while the direction of the energy transition is clear, policymakers and the public must recognize the challenges that it entails. A deeper and more realistic understanding of the complex issues that need to be addressed is essential as the effort to achieve the transition’s goals proceeds.

My Comment

The direction of the called for energy transition is clear alright, but is it necessary?  Recently, no less than John Kerry. told the World Economic Forum the world will eventually move to a low-carbon economy, but it may be too late to avoid the worst effects of climate change.  Meanwhile, there are a number of serious scientists who expect global cooling in coming decades.

The unmentioned Hard Reality #5:  Smart People will Adapt to Climate and Weather, as they always have. That is, if they haven’t already trashed their energy system and planetary resources chasing an impossible dream.

Zero Carbon Lemmings in a Rush.


Fatal Flaw in Earth Energy Balance Diagrams

Prof. Warren Stannard of Western Australia University provides the math analysis to correct the above mistaken energy balance cartoon published in 1997.  His paper in Natural Science (2018) is The Greenhouse Effect: An Evaluation of Arrhenius’ Thesis and a New Energy Equilibrium Model.  Excerpts in italics with my bolds and exhibits.

Abstract

In 1896, Svante Arrhenius proposed a model predicting that increased concentration of carbon dioxide and water vapour in the atmosphere would result in a warming of the planet. In his model, the warming effects of atmospheric carbon dioxide and water vapour in preventing heat flow from the Earth’ s surface (now known as the “Greenhouse Effect”) are counteracted by a cooling effect where the same gasses are responsible for the radiation of heat to space from the atmosphere. His analysis found that there was a net warming effect and his model has remained the foundation of the Enhanced Greenhouse Effect—Global Warming hypothesis.

This paper attempts to quantify the parameters in his equations but on evaluation his model cannot produce thermodynamic equilibrium. A modified model is proposed which reveals that increased atmospheric emissivity enhances the ability of the atmosphere to radiate heat to space overcoming the cooling effect resulting in a net cooling of the planet. In consideration of this result, there is a need for greenhouse effect—global warming models to be revised.

1. Introduction

In 1896 Arrhenius proposed that changes in the levels of “carbonic acid” (carbon dioxide) in the atmosphere could substantially alter the surface temperature of the Earth. This has come to be known as the greenhouse effect. Arrhenius’ paper, “On the Influence of Carbonic Acid in the Air upon the Temperature of the Ground”, was published in Philosophical Magazine.  Arrhenius concludes:

“If the quantity of carbonic acid in the air should sink to one-half its present percentage, the temperature would fall by about 4˚; a diminution to one-quarter would reduce the temperature by 8˚. On the other hand, any doubling of the percentage of carbon dioxide in the air would raise the temperature of the earth’s surface by 4˚; and if the carbon dioxide were increased fourfold, the temperature would rise by 8˚ ” [ 2 ].

It is interesting to note that Arrhenius considered this greenhouse effect a positive thing if we were to avoid the ice ages of the past. Nevertheless, Arrhenius’ theory has become the foundation of the enhanced greenhouse effect―global warming hypothesis in the 21st century. His model remains the basis for most modern energy equilibrium models.

2. Arrhenius’ Energy Equilibrium Model

Arrhenius’ proposed a two-part energy equilibrium model in which the atmosphere radiates the same amount of heat to space as it receives and, likewise, the ground transfers the same amount of heat to the atmosphere and to space as it receives. The model contains the following assumptions:

Heat conducted from the center of the Earth is neglected.

Heat flow by convection between the surface and the atmosphere and throughout the atmosphere remains constant.

Cloud cover remains constant. This is questionable but allows the model to be quantified.

Part 1: Equilibrium of the Air

The balance of heat flow to and from the air (or atmosphere) has four components as shown in Figure 1. The arrow labelled S1 indicates the solar energy absorbed by the atmosphere. R indicates the infra-red radiation from the surface of the Earth to the atmosphere, M is the quantity of heat “conveyed” to the atmosphere by convection and Q1 represents heat loss from the atmosphere to space by radiation. All quantities are measured in terms of energy per unit area per unit time (W/m2).

Figure 1. Model of the energy balance of the atmosphere. The heat received by the atmosphere ( R+M+S1 ) equals the heat lost to space (Q1). In this single layer atmospheric model, the absorbing and emitting layers are one and the same.


Part 2: Thermal Equilibrium of the Ground

In the second part of his model, Arrhenius describes the heat flow equilibrium at the “ground” or surface of the Earth. There are four contributions to the surface heat flow as shown in Figure 2. S2 is the solar energy absorbed by the surface, R is the infra-red radiation emitted from the surface and transferred to the atmosphere, N is the heat conveyed to the atmosphere by convection and Q2 is the heat radiated to space from the surface. Note: Here Arrhenius uses the term N for the convective heat flow. It is equivalent to the term M used in the air equilibrium model.

Figure 2. The energy balance at the surface of the Earth. The energy received by the ground is equal to the energy lost.

3. Finding the Temperature of the Earth

Arrhenius combined these equations and, by eliminating the temperature of the atmosphere which according to Arrhenius “has no considerable interest”, he arrived at the following relationship:

ΔTg  is the expected change in the temperature of the Earth for a change in atmospheric emissivity from ε1 to ε2. Arrhenius determined that the current transparency of the atmosphere was 0.31 and, therefore the emissivity/absorptivity ε1 = 0.69. The current mean temperature for the surface of the Earth can be assumed to be To = 288 K.

Figure 3. Arrhenius’ model is used to determine the mean surface temperature of the Earth as a function of atmospheric emissivity ε. For initial conditions, ε = 0.69 and the surface temperature is 288 K. An increase in atmospheric emissivity produces an increase in the surface temperature of the Earth.

Arrhenius estimated that a doubling of carbon dioxide concentration in the atmosphere would produce a change in emissivity from 0.69 to 0.78 raising the temperature of the surface by approximately 6 K. This value would be considered high by modern climate researchers; however, Arrhenius’ model has become the foundation of the greenhouse-global warming theory today. Arrhenius made no attempt to quantify the specific heat flow values in his model. At the time of his paper there was little quantitative data available relating to heat flow for the Earth.

4. Evaluation of Arrhenius’ Model under Present Conditions

More recently, Kiehl and Trenberth (K & T) [ 3 ] and others have quantified the heat flow values used in Arrhenius’ model. K & T’s data are summarised in Figure 4.

The reflected solar radiation, which plays no part in the energy balance described in this model, is ignored. R is the net radiative transfer from the ground to the atmosphere derived from K & T’s diagram. The majority of the heat radiated to space originates from the atmosphere (Q1 > Q2). And the majority of the heat lost from the ground is by means of convection to the atmosphere (M > R + Q2).

Figure 4. Model of the mean energy budget of the earth as determined by Kiehl and Trenberth.

Q2=(1−ε)σνT4e(5)

Substituting ε = 0.567, ν = 1.0 and Tg = 288 K we get:  Q2=149.2 W/m2

Using Arrhenius value of 0.69 for the atmospheric emissivity Q2 = 120.9 W/m2.

Both values are significantly more than the 40 W/m2 determined by K & T.
The equation will not balance, something is clearly wrong.

Figure 5 illustrates the problem.

Equation (5) is based on the Stefan-Boltzmann law which is an empirical relationship which describes the amount of radiation from a hot surface passing through a vacuum to a region of space at a temperature of absolute zero. This is clearly not the case for radiation passing through the Earth’s atmosphere and as a result the amount of heat lost by radiation has been grossly overestimated.

No amount of adjusting parameters will allow this relationship to produce
sensible quantities and the required net heat flow of 40 W/m2.

This error affects the equilibrium heat flow values in Arrhenius’ model and the model is not able to produce a reasonable approximation of present day conditions as shown in Table 1. In particular, the convective heat flow takes on very different values from the two parts of the model. The values M and N in the table should be equivalent.

5. A New Energy Equilibrium Model

A modified model is proposed which will determine the change in surface temperature of the Earth caused by a change in the emissivity of the atmosphere (as would occur when greenhouse gas concentrations change). The model incorporates the following ideas:

1) The total heat radiated from the Earth ( Q1+Q2Q1+Q2 ) will remain constant and equal to the total solar radiation absorbed by the Earth ( S1+S2S1+S2 ).

2) Convective heat flow M remains constant. Convective heat flow between two regions is dependent on their temperature difference, as expressed by Newton’s Law of cooling1. The temperature difference between the atmosphere and the ground is maintained at 8.9 K (see Equation 7(a)). M = 102 W/m2 (K & T).

3) A surface temperature of 288 K and an atmospheric emissivity of 0.567 (Equation (7b)) is assumed for initial or present conditions.

Equation (9) represents the new model relating the emissivity of the atmosphere ε to the surface temperature Tg. Results from this model are shown in Table 2. The table shows the individual heat flow quantities and the temperature of the surface of the Earth that is required to maintain equilibrium:

The table shows that as the value of the atmospheric emissivity ε is increased less heat flows from the Earth’s surface to space, Q2 decreases. This is what would be expected. As well, more heat is radiated to space from the atmosphere; Q1 increases. This is also expected. The total energy radiated to space Q1+Q2=235 W/m2 . A plot of the resultant surface temperature Tg versus the atmospheric emissivity ε is shown below Figure 6.

Figure 6. Plot of the Earth’s mean surface temperature as a function of the atmospheric emissivity. This model predicts that the temperature of the Earth will decrease as the emissivity of the atmosphere increases.

6. Conclusion

Arrhenius identified the fact that the emissivity/absorptivity of the atmosphere increased with increasing greenhouse gas concentrations and this would affect the temperature of the Earth. He understood that infra-red active gases in the atmosphere contribute both to the absorption of radiation from the Earth’s surface and to the emission of radiation to space from the atmosphere. These were competing processes; one trapped heat, warming the Earth; the other released heat, cooling the Earth. He derived a relationship between the surface temperature and the emissivity of the atmosphere and deduced that an increase in emissivity led to an increase in the surface temperature of the Earth.

However, his model is unable to produce sensible results for the heat flow quantities as determined by K & T and others. In particular, his model and all similar recent models, grossly exaggerate the quantity of radiative heat flow from the Earth’s surface to space. A new energy equilibrium model has been proposed which is consistent with the measured heat flow quantities and maintains thermal equilibrium. This model predicts the changes in the heat flow quantities in response to changes in atmospheric emissivity and reveals that Arrhenius’ prediction is reversed. Increasing atmospheric emissivity due to increased greenhouse gas concentrations will have a net cooling effect.

It is therefore proposed by the author that any attempt to curtail emissions of CO2
will have no effect in curbing global warming.

Climate Truth Science Soundbites

The climate realists at Creative Society have put together a short video with pithy statements skewering the CO2 theory of climate change.  Above is the video and below a transcript with exhibits and the speakers’ identities.

Dr. Harold Burnett
Over time the atmospheric levels of carbon dioxide have radically fluctuated throughout the earth’s geologic history. They have been in the past as much as 5000 parts per million. Currently they are about 420 parts per million. So over long periods of time they have fluctuated, but in general they have fallen.

Gregory Wrightstone
There doesn’t seem to be any correlation whatsoever with increasing CO2 and temperature. And in fact one of the things we’re being asked to believe is that our modern temperatures are unusual and unprecedented, as thought we’ve never seen temperatures like this in thousands of years. That’s just not the case.

Prof. Ole Ellestad
We have a map showing temperature changes over the last 11,000 years. These are Greenland ice cores and we can see a thousand years ago, about 2000 years ago and about 3000 years ago we had warm periods. And everything indicates that these were periods of global warming.

Hans Borge
It was long before man-made CO2 emissions had any considerable volume. Therefore we know that the natural variability can be large.

Jan-Eric Solheim
In this graph we also show what the IPCC does. It prolongs more or less this curve going to infinite.  So it becomes warmer and warmer because of the CO2 release or climate. And that’s what we think is wrong. Our prediction is that it will soon start Cooling and we have to be prepared for that.

Gregory Wrightstone
The warming trend we’re in right now though started more than 300 years ago. But again 250 years of warming took place before we started adding CO2. But we’re asked to believe that those natural forces that have been driving temperatures since the dawn of time suddenly ceased in the 20th century.

Hans Borge
CO2 is a gas that has very little effect on the climate. The IPCC models assume that the higher the CO2 level, the higher the water vapor level, and water vapor is a gas with the greatest impact on the climate. But the assumption that the more CO2, the more water vapor, has never been proved.

Jan-Eric Solheim
With some colleagues I have done experiments to see if CO2 can heat or carry heat. So we have built small greenhouses and tried to heat it by the sun outside or inside with artificial heating. We were able to show that carbon dioxide stops radiation, but we were not able to show any heating. So it’s a mystery how CO2 cannot heat, but what can heat is the water.

Gregory Wrightstone
The water vapor temperature changes first and then CO2 levels follow that. It’s not the other way around. If man increasing CO2 is going to drive temperature, CO2 should change first and then temperature should change.

Jan-Eric Solheim
The blue curve is the temperature of the sea that is the ocean surface temperatures. The red is the land temperature which we get in this case from HadCRUT, which is an official temperature series. First comes the change in the sea temperature, a little bit later the land temperature (red) and then about one year, 10 or 11 months the carbon dioxide changes. And when temperature at the sea surface goes down, the carbon dioxide goes down 10 or 11 months later.

Hans Borge
Well let me show you another table that might tell you a little bit about the CO2 content. Take a look:  there are 3 000 billion tons of CO2 in the atmosphere and the total man-made emissions per year are 20 to 30 billion tons. But if you look at the ocean, it has far more CO2. So the exchange of CO2 between the ocean and the atmosphere totally overshadows human activity.

Jan-Eric Solheim
So a more detailed analysis telling that this red part here is apparently what anthropogenic yes or mankind produced carbon dioxide, which is about three percent of the increase from 1960. But nature produces the rest, this variable curve here. So 97 percent of the increase comes from nature, according to these scientists.

Prof. Ole Ellestad
The IPCC also claims that the sun has no effect on us. It’s a great paradox; not clear how they arrive at that. Moreover today we see that the warming is happening not only on our planet but also on other planets and on the moon too, where there’s a completely different atmosphere that has nothing to do with CO2. So clearly there is a sun factor which is missing in their model.

Gregory Wrightstone
Well, the iIPCC if you look back on their charter it was formed to present the data that supports warming. They weren’t tasked to provide all the data. They started with an assumption and went from there. So if that’s their task, they’re doing a darn good job at it. You better have some good science behind you, and it’s just not there.

Dr. Harold Burnett
The world’s governments through the UN formed the UN Framework Convention on Climate Change. Now you would think that would be studying climate change, but they specified that you study the human causes of climate change. So they ruled out all natural factors. They said no no: we’re not going to study whether the sun plays a role; we’re not going to study whether volcanoes play a role; we’re not going to study whether ocean current shifts play a role. And we really don’t understand clouds, so we’re not going to count them much. What we’re going to study is human CO2 emissions because that’s what we can get a handle on.

That’s not the way science is supposed to work. If you make faulty or incomplete assumptions, your models are going to be weak, because they’re only as good as the accuracy of the stuff that’s put in them. Now climate models have failed to accurately reflect past temperatures; they fail to accurately represent present temperatures; but we’re told we can trust their projections of future temperatures.  That doesn’t seem reasonable to me.

Gregory Wrightstone
If on the other hand, you like the scientific process, we’re not getting much data out there. Dr Will Happer is our chairman here at the CO2 coalition and he’s got a paper that he and Dr. Van Wijngaarden have done on climate sensitivities. They’re not able to get it in any prestigious journals, yet it’s a landmark study. They need to shut people like me down: I was just banned on linkedin, which should be a professional network, a social media network. I don’t talk those things that are controversial; I post scientific facts, and they were being removed. And they came back and said: No, you’re done. We don’t allow that kind of information on linkedin.

Prof. Ole Ellestad
This debate is so violent that if you go to the media you can express your opinion, but you will be strongly criticized, and then you won’t really have an opportunity to defend yourself. But most importantly, you won’t get into the media with your first articles.

Hans Borge
This is what we see now in the academic world, for example at universities. Academic freedom is so endangered. I have to say that many people who joined the ranks of climate realists do so when they retire; because until retirement they just don’t dare. Researchers who claim something different don’t get grants; they don’t have their say in either published media or in edited journals.

Dr. Harold Burnett
First off you’re having a difficult time getting published because journals won’t hear it. Well, that affects your tenure track position and your colleagues are frowning at you. And you’re not getting government grants because government doesn’t give grants to study natural factors for climate change or to study things that prove humans aren’t causing climate change. Because government has a motive: expanding its its reach. I know researchers who’ve left the field because they feel like they can’t give their honest assessment and get it either published or get tenure.

Prof. Ole Ellestad
Climate and environment are often lumped together. But being against climate doesn’t mean being against the environment. That is, we are not against climate, but we are skeptical of CO2, which is not the same as being skeptical of the environment. So important environmental issues should be discussed and resolved.

Dr. Harold Burnett
That subsurface volcanic activity in Antarctica and even in parts of Greenland and Iceland are contributing to the melting of the glaciers there. That is not controlled by CO2. We don’t control the ocean currents; we don’t control the magnetism of the earth’s magnetic poles and how it shifts or can shift over time. We don’t control our orbit.

We don’t control those things and they’re really what’s driving things. That’s why we should study them, because they’re really what’s driving climate change. And if we think it’s bad, we should know that too.

I want an adaptable society. An adaptable society is one that does not lock us into solving the wrong problem.


Just Transition Really Means Great Disruption

Disney’s portrayal of the Sorcerer’s Apprentice in over his head.

After breaking basic public services, woke elites now aim to collapse economies, calling it the “Just Transition” to net zero energy.  Like the ignorant novice in the fable, these fools are following a magical recipe with no understanding of the uncontrollable consequences.  This post discusses the emerging movement of naïve leaders threatening the livelihoods of their citizens whose trust has been betrayed.

Firstly, Rex Murphy writes at National Post The Trudeau Liberals are coming for your jobs.  Excerpts in italics with my bolds and added images.

From the Instapundit site I find this ever so telling comment. Will anyone deny the obvious truth it contains?

“All the people who want to ‘regulate the planetary climate’ and demand the power and unlimited resources to do so are people who have proven themselves incapable of competently managing and running recently built, closed, man-made systems. They cannot competently run power grids, or municipal water systems or trash pickup; they cannot competently maintain, let alone repair, the ‘roads and bridges’ they are always pratting about; they cannot competently run or maintain the public housing they increasingly want people to live in, or the public transportation systems that they want people to rely on …”

To which we really must add that they (or one particular government I have in mind) cannot manage international airports, passport issuance, legitimate protests, civil service payroll systems, support for their veterans, maintain a sufficient military, a national health-care system (which used to be the pride of the country) inter-provincial relations, and conflict of interest legislation.

To be fair, they are good at handing out contracts to their friends and running up consultancy bills.

And most pertinent to the present moment, this particular government — which the keenest of you will have guessed is the present one in Ottawa — also wants to impose a great restructuring — i.e. the total cancellation — of the country’s No. 1 and vital industry, which only has the third highest reserves in the entire world — energy.

And replace that great and successful resource with what amounts to
a million helicopter blades on very high metal sticks.
In Liberalese this is called the “just transition.”

On a related matter, one might ask from where could such a crazy idea emerge? Why from the great Alpine closet of Davos and its hive of globalist billionaires, celebrities and unmoored politicians, the great World Economic Forum — Davos the Swiss Bethlehem of the Great Reset.  [Note: Many of the Davos crowd inherited or married into wealth (John Kerry, for example), so lack worldly knowledge of building an actual enterprise trusted to provide quality goods or services to paying customers.]

Slacker that I am, I was unaware till very recently that our very own No. 1 Trudeau cabinet star, Chrystia Freeland occupies a key seat on the board of the world’s most presumptuous, paternalistic and cosmically pretentious institution. No less a reporter than the doughty Rupa Subramanya, who graces these very pages, two years ago gave a full report on Freeland’s pupation from reporter on the Davos crowd to one of its highest eminences.

It is a delicious account. Rupa quotes Freeland: “After my book, Plutocrats, was published in 2012, I was even — and I know this will shock you — disinvited to a Davos dinner party!” And continues: “Indeed, the one-time critic has enjoyed an apotheosis of sorts and since 2019 has sat on the board of trustees of the WEF itself. Other members include Canada’s own Mark Carney, former governor of the Bank of Canada.”

Now, I have no idea of the answer to this question, but should the finance minister of a country also be a top board member of a billionaire-stuffed cabal — even given that it offers the thrill of rubbing shoulders with Al Gore once a year? Or, we could ask, is it fair to Klaus Schwab (insert James Bond villain theme here) and the WEF that Ms. Freeland has to spend so much time on Canadian stuff, that she cannot possibly give her full attention to the Great Reset and WEF’s priority policy of “decarbonization?”

Or, we could ask, when there is a clash between the Canadian agenda
and the WEF agenda, which wins?

On that last one — looking at the maniacal idea of “just transition” as it’s playing out in Canada, I’d say the WEF is getting good value. But I’m a neutralist on these questions? What does Justin Trudeau think? Is this a case of upper-class moonlighting?

Finally, I wish to cite Toronto Sun editor emeritus, Lorrie Goldstein, the North Star of global warming reportage. He has what I think is called a “twitter thread” (in future, I will consult my nephew on the strange nomenclature of this internet) on the “just transition” aka, the “great disruption.” Space allow only one quote, but the rest I’m told is easily found:

“The value of the controversy over Trudeau’s ‘Just Transition Plan’ broken by Blacklock’s is that it ends the myth only oil, gas & coal workers will be impacted by his green energy plan: In fact, 7 major sectors of the economy could face ‘significant’ disruptions in employment.”

My Comment

New Zealand Leads in the Suffering

Could this be why PM Ardern has “emptied her tank” and resigning?  :  Jacinda Ardern was the international poster girl for ‘kindly’ authoritarianism. 

Among our supposedly liberal elites it has become common sense
that populations must be controlled for their own good

“This global chorus of praise is a fitting send-off. Ardern is in many ways an archetypal leader of our age, in which politicians draw just as much legitimacy, if not more, from the warm feeling they give international elites than what it is they actually do and achieve for their domestic population. Indeed, her cheerleaders don’t even bother to look into those things. If they did, they’d see why Ardern is beating a hasty retreat. She leaves office amid a painful cost-of-living crisis and spiralling crime rates.”

Scotland Raises the Bar for Absurdity

From the Daily Sceptic The Dangerous Fantasy of Scotland’s Net Zero Energy Transition

Suppose that Scotland’s CO2 emissions fell tomorrow to zero, i.e., that, at midnight, the country ceased to exist. Then according to the “Model for the Assessment of Greenhouse Gas Induced Climate Change” (MAGICC), based on the latest IPCC climate models, the reduction in the Earth’s temperature in 2100 would be…undetectable.

Motivated by the moral necessity and urgency of this goal, the Scottish Government is proposing a novel energy policy – its “Energy Strategy and Just Transition Plan”.

This article reviews its major themes and their implications, and considers briefly the probability of success of the Scottish Government implementing it.

Irreversible impairment of either our energy or financial systems would have a catastrophic impact on the welfare of Scotland’s citizens. Yet few have expressed any desire, much less informed consent, for risk on the scale proposed for such little benefit.

Yet the project, representing a scope of unprecedented scale, cost, pace and technical uncertainty, will be overseen by a Government that is currently struggling to procure two relatively modest ferries for less than the cost that other governments can procure 34 ferries – again, ironically due in large part to cost overruns associated with the attempt to employ novel technologies to reduce CO2 emissions. As evidence of the extent to which the Scottish Government and its advisers have become unmoored from physical reality by the climate catastrophe hypothesis, it’s a document that is fascinating to read, and alarming to contemplate.”