
S. Fred Singer (1924 – 2020) passed away on April 6, 2020 at the age of 95.
Dr. Singer is the author, coauthor, and editor of many books, including Climate Change Reconsidered (several volumes), a comprehensive critique of the assessment reports of the United Nations’ Intergovernmental Panel on Climate Change. He was a senior fellow of The Heartland Institute and research fellow with the Independent Institute.
Dr. Singer published more than 200 technical papers in peer-reviewed scientific journals, His editorial essays and articles have appeared in Cosmos, The Wall Street Journal, New York Times, New Republic, Newsweek, Journal of Commerce, Washington Times, Washington Post, and many other publications. His accomplishments have been featured in front-cover stories appearing in Time, Life, and U.S. News & World Report
Dr. Singer was an elected Fellow of the American Association for the Advancement of Science (AAAS), American Geophysical Union, American Physical Society, and American Institute for Aeronautics and Astronautics. Dr. Singer gave hundreds of lectures and seminars on global warming, including to the science faculties at leading universities around the world.
This post commemorates his steadfast labors to expose the truth of climate change as a natural variability and to neutralize the poison of claiming humans are causing a climate crisis or emergency. To this end below is a synopsis of his analysis originally published Sept. 10, 2001 in the Wall Street Journal. The source is Water Vapor Rules the Greenhouse System at ClimateCite.
Just how much of the “Greenhouse Effect” is caused by human activity?
It is about 0.28%, if water vapor is taken into account– about 5.53%, if not.
This point is so crucial to the debate over global warming that how water vapor is or isn’t factored into an analysis of Earth’s greenhouse gases makes the difference between describing a significant human contribution to the greenhouse effect, or a negligible one.
Water vapor constitutes Earth’s most significant greenhouse gas, accounting for about 95% of Earth’s greenhouse effect (4). Interestingly, many “facts and figures’ regarding global warming completely ignore the powerful effects of water vapor in the greenhouse system, carelessly (perhaps, deliberately) overstating human impacts as much as 20-fold.
Water vapor is 99.999% of natural origin. Other atmospheric greenhouse gases, carbon dioxide (CO2), methane (CH4), nitrous oxide (N2O), and miscellaneous other gases (CFC’s, etc.), are also mostly of natural origin (except for the latter, which is mostly anthropogenic).
For those interested in more details a series of data sets and charts have been assembled below in a 5-step statistical synopsis.
Note that the first two steps ignore water vapor.
♦ 1. Greenhouse gas concentrations
♦ 2. Converting concentrations to contribution
♦ 3. Factoring in water vapor
♦ 4. Distinguishing natural vs man-made greenhouse gases
♦ 5. Putting it all together
Note: Calculations are expressed to 3 significant digits to reduce rounding errors, not necessarily to indicate statistical precision of the data. All charts were plotted using Lotus 1-2-3.
Caveat: This analysis is intended to provide a simplified comparison of the various man-made and natural greenhouse gases on an equal basis with each other. It does not take into account all of the complicated interactions between atmosphere, ocean, and terrestrial systems, a feat which can only be accomplished by better computer models than are currently in use.
1. The following table was constructed from data published by the U.S. Department of Energy (1) and other sources, summarizing concentrations of the various atmospheric greenhouse gases. Because some of the concentrations are very small the numbers are stated in parts per billion. DOE chose to NOT show water vapor as a greenhouse gas!
TABLE 1.The Important Greenhouse Gases (except water vapor)
U.S. Department of Energy, (October, 2000) (1)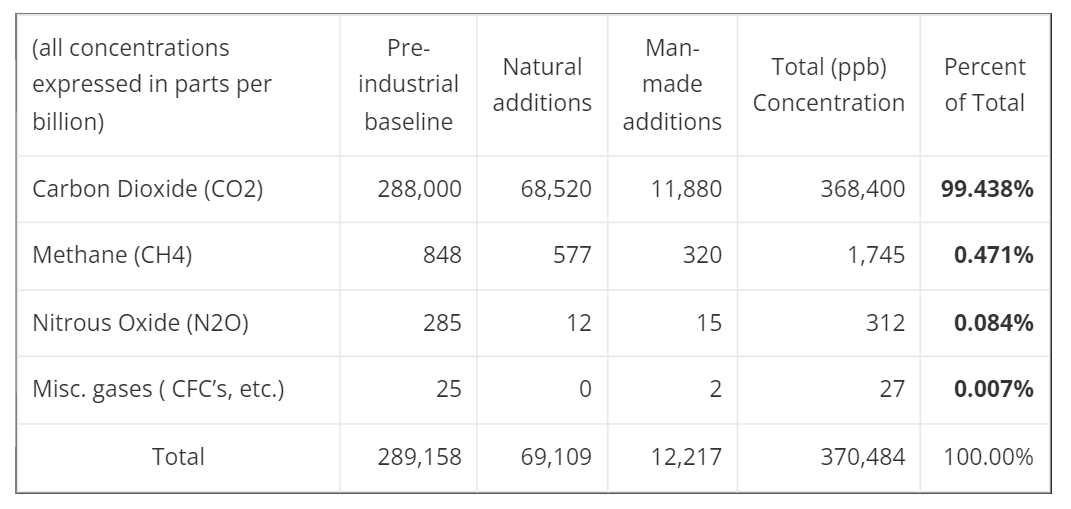
Table 1 is not a very meaningful view because 1) the data has not been corrected for the actual Global Warming Potential (GWP) of each gas, and 2) water vapor is ignored. But these are the numbers one would use if the goal is to exaggerate human greenhouse contributions:
The various greenhouse gases are not equal in their heat-retention properties though, so to remain statistically relevant % concentrations must be changed to % contribution relative to CO2. This is done in Table 2, below, through the use of GWP multipliers for each gas, derived by various researchers.
2. Using appropriate corrections for the Global Warming Potential of the respective gases provides the following more meaningful comparison of greenhouse gases, based on the conversion:
( concentration ) X ( the appropriate GWP multiplier (2) (3) of each gas relative to CO2 ) = greenhouse >contribution.:
TABLE 2.Atmospheric Greenhouse Gases (except water vapor)
adjusted for heat retention characteristics, relative to CO2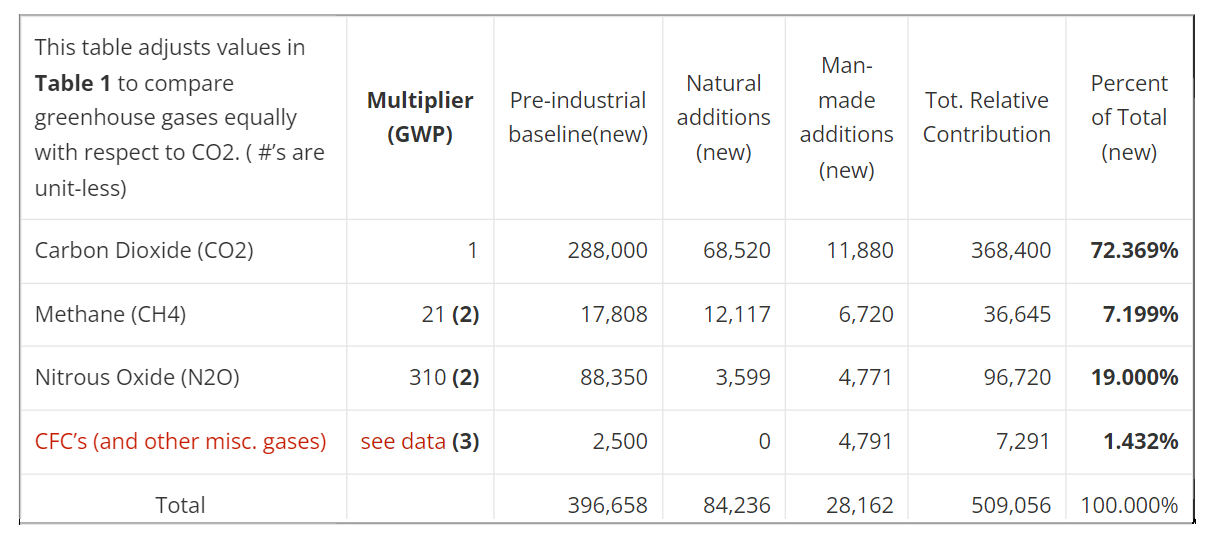
NOTE: GWP (Global Warming Potential) is used to contrast different greenhouse gases relative to CO2.
Compared to the concentration statistics in Table 1, the GWP comparison in Table 2 illustrates, among other things:
♦ Total carbon dioxide (CO2) contributions are reduced to 72.37% of all greenhouse gases (368,400 / 509,056)– (ignoring water vapor).
Also, from Table 2 (but not shown on graph):
♦ Anthropogenic (man-made) CO2 contributions drop to (11,880 / 509,056) or 2.33% of total of all greenhouse gases, (ignoring water vapor).
♦ Total combined anthropogenic greenhouse gases becomes (28,162 / 509,056) or 5.53% of all greenhouse gas contributions, (ignoring water vapor).
To properly represent the total relative impacts of Earth’s greenhouse gases Table 3 (below) factors in the effect of water vapor on the system.
3. Table 3, shows what happens when the effect of water vapor is factored in, and together with all other greenhouse gases expressed as a relative % of the total greenhouse effect.
TABLE 3.Role of Atmospheric Greenhouse Gases
(man-made and natural) as a % of Relative
Contribution to the “Greenhouse Effect”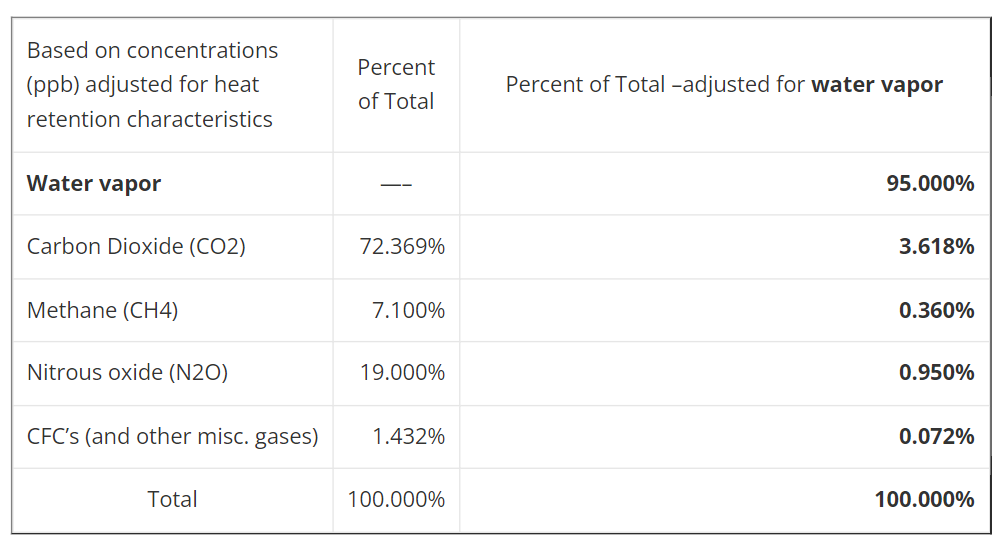
Total atmospheric carbon dioxide (CO2) — both man-made and natural– is only about 3.62% of the overall greenhouse effect— a big difference from the 72.37% figure in Table 2, which ignored water!
Water vapor, the most significant greenhouse gas, comes from natural sources and is responsible for roughly 95% of the greenhouse effect (4). Among climatologists this is common knowledge but among special interests, certain governmental groups, and news reporters this fact is under-emphasized or just ignored altogether.
Conceding that it might be “a little misleading” to leave water vapor out, they nonetheless defend the practice by stating that it is “customary” to do so!
4. Of course, even among the remaining 5% of non-water vapor greenhouse gases, humans contribute only a very small part (and human contributions to water vapor are negligible).
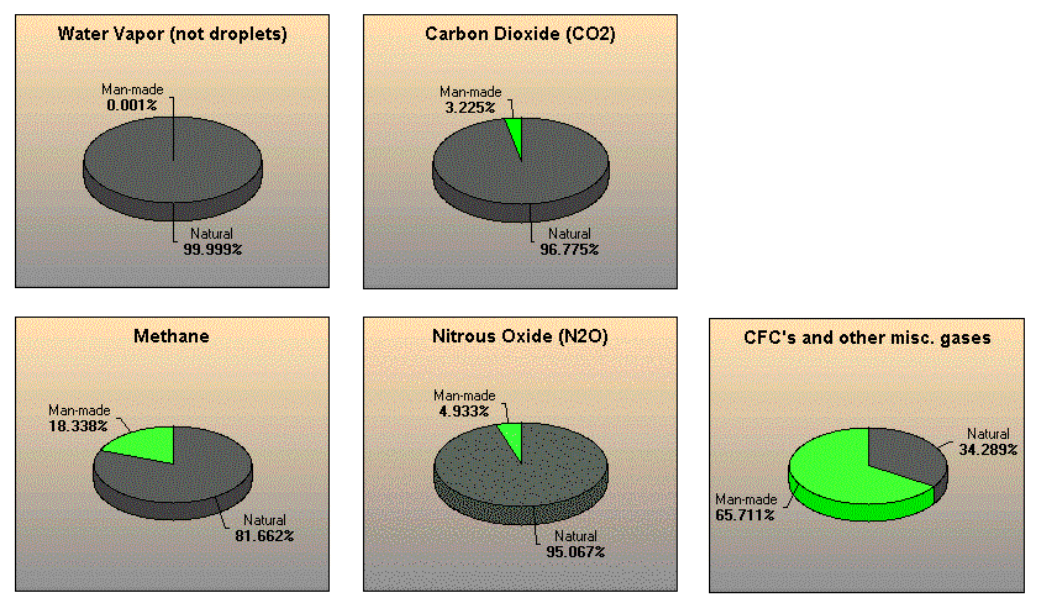
Constructed from data in Table 1, the charts (below) illustrate graphically how much of each greenhouse gas is natural vs how much is man-made. These allocations are used for the next and final step in this analysis– total man-made contributions to the greenhouse effect. Units are expressed to 3 significant digits in order to reduce rounding errors for those who wish to walk through the calculations, not to imply numerical precision as there is some variation among various researchers.
5. To finish with the math, by calculating the product of the adjusted CO2 contribution to greenhouse gases (3.618%) and % of CO2 concentration from anthropogenic (man-made) sources (3.225%), we see that only (0.03618 X 0.03225) or 0.117% of the greenhouse effect is due to atmospheric CO2 from human activity. The other greenhouse gases are similarly calculated and are summarized below.
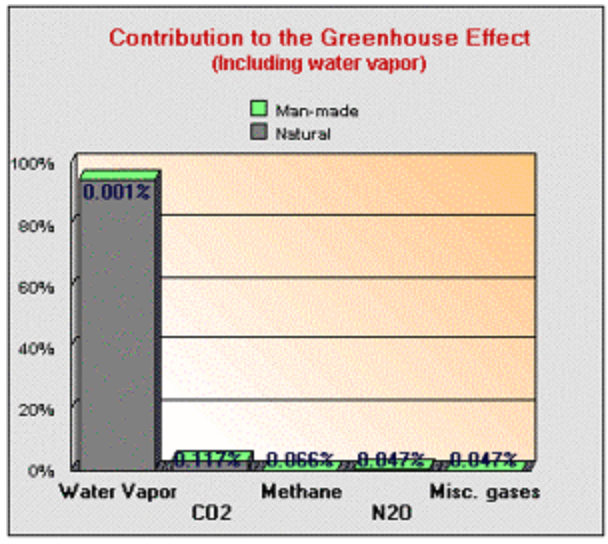
TABLE 4a.Anthropogenic (man-made) Contribution to the “Greenhouse
Effect,” expressed as % of Total (water vapor INCLUDED)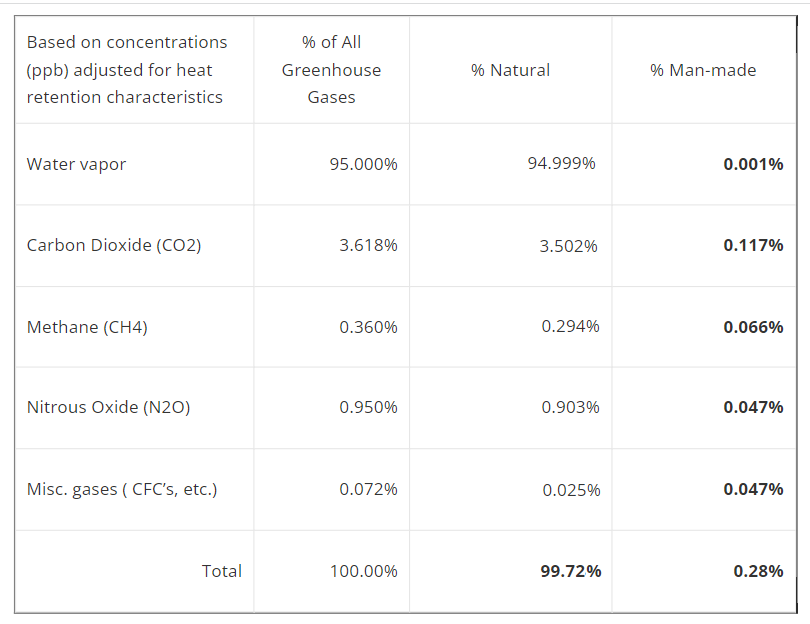 This is the statistically correct way to represent relative human contributions to the greenhouse effect.
From Table 4a, both natural and man-made greenhouse contributions are illustrated in this chart, in gray and green, respectively. For clarity only the man-made (anthropogenic) contributions are labeled on the chart.
♦ Water vapor, responsible for 95% of Earth’s greenhouse effect, is 99.999% natural (some argue, 100%). Even if we wanted to we can do nothing to change this.
♦ Anthropogenic (man-made) CO2 contributions cause only about 0.117% of Earth’s greenhouse effect, (factoring in water vapor). This is insignificant!
♦ Adding up all anthropogenic greenhouse sources, the total human contribution to the greenhouse effect is around 0.28% (factoring in water vapor).
The Kyoto Protocol calls for mandatory carbon dioxide reductions of 30% from developed countries like the U.S. Reducing man-made CO2 emissions this much would have an undetectable effect on climate while having a devastating effect on the U.S. economy. Can you drive your car 30% less, reduce your winter heating 30%? Pay 20-50% more for everything from automobiles to zippers? And that is just a down payment, with more sacrifices to come later.
Such drastic measures, even if imposed equally on all countries around the world, would reduce total human greenhouse contributions from CO2 by about 0.035%.
My Comment
Readers may have wondered, as I have, how the typical Earth Energy Balance diagrams can show surface solar radiation amounting to ~161 W/m2 and downwelling IR atmospheric radiation ~333 W/m2, more than twice as much. This despite the fact that shorter wavelengths are more energetic and longer wavelengths have less energy.
Part of the problem lies in calculating the conversion from radiation amounts to energy. The formula is Energy level E = pV, where p is the Planck constant and V is the frequency. Too often the shortcut is to assume the average frequency of visible light as the conversion factor. That is a reasonable assumption for sunlight, but greatly exaggerates the energy of LWIR, which is 10 to 20 times longer than sunlight wavelengths.
In the tables above Dr. Singer did all the calculations considering each GHG’s volume and adjusted it by its ability to absorb IR radiation and the energy carried by each IR frequency.
Footnote
A comment below dismisses Fred Singer’s expertise, likely based on a popular climate paradigm that is logical, simple and wrong. To understand the flaws in thinking about earth’s climate, see this post:

For a better understanding of the role of H2O, see William Gray’s paper, synopsis here:

Reblogged this on Climate Collections.
LikeLike
Water vapor is a not a climate change cause — it is a feedback to any cause of climate change that changes the average temperature of the troposphere.
All additions to greenhouse gases since 1850 were manmade, plus the water vapor positive feedback. That would be about 1/3 of the 420 ppm CO2 level today. Oceans, land and planst wre net CO2 absorbers in that time period, therefore all CO2 increases were manmade.
The article consistently conflates the entire greenhouse effect with changes in the greenhouse effect caused by emissions of manmade greenhouse gases and the resulting water vapor positive feedback. For example: “Adding up all anthropogenic greenhouse sources, the total human contribution to the greenhouse effect is around 0.28% (factoring in water vapor).”
0.28% is not even close to reality.
Radiative modeling analyses by G. A. Schmidt and colleagues showed that of the total 33°C (60°F) greenhouse effect, about 50% is contributed by water vapor, 25% by clouds, 20% by carbon dioxide, and the remaining 5% is due to methane, nitrous oxide, ozone, and the chlorofluorocarbon gases.
If 20% of the greenhouse effect is from CO2, and manmade CO2 emissions are responsible for one third of the total CO2 level, then 1.3 of 20%, or 6.6% of the greenhouse effect is caused by manmade CO2 emissions. 0.28% is claptrap.
If this article fairly summarizes Mr. Singer’s beliefs, it is strange that anyone would have taken him seriously. This article is mainly climate science denying, not climate science reality.
LikeLike
Your suppositions are mistaken. H2O dominates IR activity in the atmosphere. It has never been shown to be a feedback to CO2. Moreover, changes in CO2 follow changes in temperature on all time scales. Outgassing of CO2 did not stop when humans began burning hydrocarbon. Gavin Schmidt’s climate model fails to replicate the past or the present, so his radiative work can’t be trusted. His GISS temperature dataset keeps changing the past and can’t be right. Sorry to say, Singer was right and you are wrong.
LikeLike