Zharkova on Solar Forcing and Global Cooling

The Grand Solar Minimum is Coming.

Interview of Prof. V. Zharkova  by Franco Battaglia  for the Italian newspaper La Verita Excerpts in italics with my bolds and added images.

The following interview will show – if there were still the need to show it – that the climate system is quite far to be well understood, thereby it is quite far from the truth any claim according to which on the matter “science is settled”, as Al Gore and the IPCC have been claiming for 20 years. Valentina Zharkova is an outstanding Ukrainian scientist: she graduated from the University of Kiev in Applied mathematics, first, and then completed her PhD studies in Astrophysics from the Main Astronomical Observatory in Kiev. For the past 30 years she worked in the UK Universities of Glasgow, Bradford and Northumbria, since 2005 as a Professor of Applied Mathematics. At the present she is Professor Emeritus at Northumbria University (Newcastle, UK) and Director of ZVS Research Enterprise Ltd. (London UK).

Q. Prof. Zharkova, people say that the Earth is warming since the beginning of the Industrial revolution and that this is due to human activities. Do you have any comment on that?

A. Actually the Earth is warming since 1690, the minimum of the Little Ice Age. In 1976, Prof. John Eddy established that the terrestrial temperature follows solar radiation deposition during solar activity cycles, increasing during the solar cycle maxima and decreasing during solar minima. Then, in 1995, prof. Judith Lean and collaborators discovered and later in 2016 Prof. Don Easterbrook confirmed that the input of solar radiation to Earth was decreased during the Maunder minimum in 1645-1710 by about 3 W/m2 leading to a decrease of terrestrial temperature during what is now called the Little Ice Age. Since 1700 and the recovery of the Maunder minimum the solar radiation deposition to Earth restored to previous level and terrestrial temperature followed solar activity cycles.

Q. Has then the solar activity been increasing during the last few decades?

A. No. Actually the solar activity has been decreasing since the 80’s of the last century.

Q. This is why IPCC has concluded that the present warming is due to humans?

A. Exactly, the warming is present but it is not due to humans. They make a mistake: they assume that solar radiation is essentially constant, thereby attributing the warming to CO2’s enhanced concentration in the terrestrial atmosphere.

Q. Could you clarify?

A. Within solar activity there are two important cycles: one – the small solar cycle – with a 11-year period and the other – the grand solar cycle – with a 350-year period. The grand solar cycles are separated by grand solar minima (GSMs), the most recent of them occurred during Maunder minimum (1645-1710). The GSM acts on the terrestrial environment via the cold air jets coming from Arctic and Antarctica because of the reduction of solar UV radiation and ozone abundances in the terrestrial atmosphere.  Now there is a current solar cycle (cycle number 25) is showing to have the largest numbers of spotless days than any other cycles of the last 280 years of observations. During the modern GSM, similar to Maunder minimum, the solar radiation is expected to decrease by about 3 W/m2. The terrestrial temperature is then expected to decrease in the next three decades by about 1C. This was recorded during the Maunder Minimum and the same is expected in the modern GSM (2020-2050).

But the further change of solar irradiance deposited to the Earth can be caused by other effects.

Q. Namely?


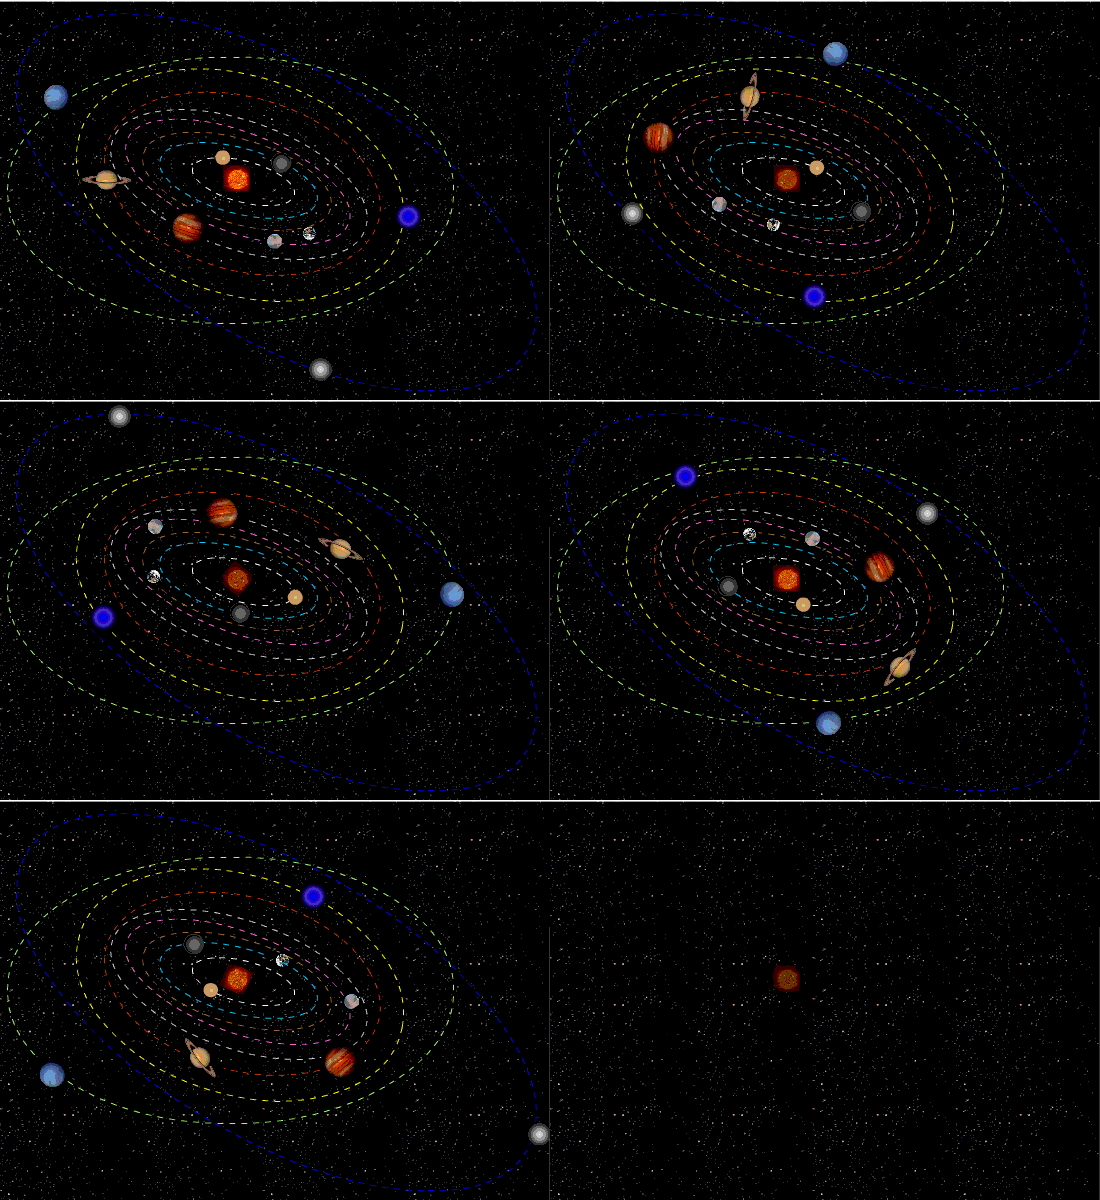
A. By orbital effects. There are well known Milankovitch cycles caused by various variation of the earth orbit eccentricity, inclination of its axis to the ecliptics, aberrations. These periods vary from 15K to 100K years and well protocolled in the terrestrial biomass. There is a shorter period of solar radiation changes with a period of about two millennia: Hallstatt’s cycle. It reflects medium-scale variations of the solar radiation level whose origin comes not from the dynamo activity inside the Sun but from the Sun’s position with respect to the orbit focus, or barycentre, where it supposed to reside according to Kepler motion, or so called, solar inertial motion (SIM). This means that the Sun is shifted, or wobbling from its focus/barycentre position on two millennial scale, so that Sun-Earth distance has to change on the two millennial period.

Basically, this happens because of the gravitation from Jupiter, Saturn, Neptune and Uranus, the Sun does not sit in the focus of the ellipse of the Earth orbit, but performs the motion called SIM (wobbling on smaller orbits) about this focus. This principle of wobbling stars is used to search for exoplanets because wobbling star proves that it has a planetary system attached. In fact, the official ephemeris of the Sun-Earth distance taken from Paris-Meudon observatory and NASA JPL sites show that in the millennium 1600-2600 the Sun in February-June of every year is closer to the Earth orbit when the Sun is closer to the point of the spring equinox of the Northern hemisphere, leaving the Earth to be further from the Sun in August-December than in the usual elliptical orbit when the Sun is in its focus.

This SIM leads to an increase of the solar radiation deposited to the Earth every year during the first half of a year and, thus, to the increase of the terrestrial temperature in March-July of every year by approximately 10-12 W/m2 for each hemisphere. With the exchange of solar heating via the ocean the terrestrial atmosphere is heated to higher temperatures owing this SIM, and this extra heating occurs since the Maunder Minimum to last until 2600. The SIM provides the extra-solar heating of terrestrial atmosphere, which is not considered in the IPCC models.

Hence, the solar irradiance is not a constant, but changes on a scale
of 11 and 350 years, as induced by the solar dynamo action,
and on a two-millennial scale as induced by the solar inertial motion.

Q. In other words, you are saying that IPCC found in the CO2 the wrong source of increasing terrestrial temperature?

A. Yes. In fact the increase of CO2 abundances is a consequence of the temperature increase but not its reason as Patrick Moore of Canada has shown in his book. The main part of solar radiation energy is stored in the Ultraviolet (UV) region, much less in the visible spectrum and even less in the infra-red spectrum where molecules of CO2 emit. CO2 molecules only re-scatter the UV solar emission in much weaker infrared part of solar spectrum. CO2 does not have the emission energy to heat anything because its radiation is the in low energy infra-red range! The abundances of CO2 molecules increases every year, this is correct, but because the Sun deposits more radiation to Earth and other planets owing to SIM.

The IPCC models calculate the emission from the layer containing increased number of CO2 molecules by simply adding all the emission by each extra CO2 molecules appeared in the past 200 years. This is not correct! Because the emission from a thick layer of CO2 is locked inside this layer by radiative transfer effects, so that the emission emitted outside this layer has a saturation effect independent on the abundance of CO2 inside the layer!

Instead, I have shown that owing to SIM, the increase of solar radiation in this millennium will be about about 10-12 W/m2 per hemisphere and per year, until around 2600.  This means that the temperature increase will continue by further 2.5-3.0C until 2600 independently of any actions on the Earth and other planets. If this extra-solar heating is included then the whole temperature increase since Maunder Minimum is provided by the solar radiation because of SIM as it should because it is the only heating we have in the solar system.

In conclusion, the real reason of the current heating of terrestrial atmosphere since
the Maunder minimum is this extra-solar heating caused by the orbital motion of the Sun.
And currently the Sun is already visibly closer to the Earth (and other planet orbits)
during the springs and summers.

Q. Is there a way to test your theory?

A. Sure, it is. In the next 30 years it will be shown what is heating the Earth atmosphere: the Sun or human activity. Currently, the Sun is approaching the grand solar minimum (GSM) predicted by us in 2015, when the Sun itself is going into hibernation as all the observations of sunspots show, producing less and less active regions, flares, sunspots and coronal mass ejections. This should cause a steaming decrease of the terrestrial temperature by up to 1C in cycle 26 (2031-2042). This decrease should happen in spite the Sun already closer to Earth and increased by 2020 its temperature by 1.2C since the Maunder minimum.

If AGW were in action, then we would not observe any decrease
of the terrestrial temperature, only its increase.

However, this year and a few previous years show clearly that the Earth is on the course to a decrease of terrestrial temperature. We will see the terrestrial temperature to decrease and rather dramatically decrease in the next decade or two because of the reduced activity, or GSM, of the Sun.

Q. I imagine that the whole issue, including your finding, is still quite controversial. Would you then agree that it is safe to say that the matter is quite far from being settled?

A. Definitely!

Well, in the medieval age the settled model of the solar system was Ptolemy’s model where the Sun and planets revolve about the Earth. They invented two circles for each planet to explain their strange jumps on the sky. The church considered the science settled then.

So settled that when Copernicus proposed in 1532 the heliocentric system, where the Sun is the main central star and all planets revolve about it, they considered it as heresy. We know what happened to Giordano Bruno and led to Galileo to deny Copernicus model to survive.

Until nearly a century later, in 1610-1620 Kepler formulated three laws of the planets revolving about the central star. But only in 1665 or 1666 Isaak Newton discovered the gravity, which was only roughly (via central star-planets) included into Kepler’s laws.

And only in 1965 Jose calculated the gravity effects not only of the central star on its planets but also of the planets on the central star, thus discovering the star’s motion, naming it SIM.

Maybe it is the time to progress correctly with the orbital effects
of solar and planetary motion!
 

2021 Evidence Confirming Cosmoclimatology theory

David Whitehouse writes at NetZeroWatch New study confirms Sun/Cosmic-Ray climate connection. Excerpts in italics with my bolds.

A new study published in Nature Scientific Reports by researchers at the Danish National Space Institute at the Technical University of Denmark (DTU) and The Hebrew University of Jerusalem suggests that the Sun’s activity in screening cosmic rays affects clouds and, ultimately, the Earth’s energy budget with concomitant climatic effects.

Eruptions on the Sun screen the Earth from galactic cosmic rays – energetic particles raining down on our planet from exploded stars. “The Sun carries out fantastic natural experiments that allow us to test our ideas about cosmic ray effects on the atmosphere,” professor Henrik Svensmark, lead author of the study told the GWPF.

Solar explosions produce magnetised gas that sweeps past the Earth reducing the cosmic ray flux reaching us. These events are called Forbush decreases taking their name from the American physicist Scott E. Forbush, who first noticed them more than 80 years ago. They lead to a temporarily lower production of small aerosols – molecular clusters in the air – that normally grow to seed the water droplets of low-level clouds. This, in turn, reduces the cloud cover which is known to affect climate.

CC Theory1

The recent breakthrough is that the effect on the Earth’s energy budget has been quantified using satellite observations from the CERES instrument on NASA’s Terra and Aqua satellites.

The observational data indicate that the Earth absorbs almost 2 Watts per square metre additional energy within 4 to 6 days of the cosmic-ray minimum. Such a large effect is a major surprise since the general consensus of the climate community, recently expressed in the 2021 released IPCC report AR6 (chapter 7.3.4.5), is that, “… the GCR [galactic cosmic rays] effect on CCN [cloud condensation nuclei] is too weak to have any detectable effect on climate and no robust association was found between GCR and cloudiness. … There is high confidence that GCRs contribute a negligible ERF [effective radiative forcing] over the period 1750 to 2019.”

These new results show the IPCC’s conclusion will need to be reassessed. Two Watts per square metre can be compared with the IPCC report’s estimate of solar effective radiative forcing over the period 1750 to 2019 of only 0.01 Watts per square metre (obtained by only considering solar irradiance changes).

“We now have simultaneous observations of decreases cosmic rays, aerosols, clouds, and the energy budget” says professor Nir Shaviv.

Background from previous post The Cosmoclimatology theory 

An article at GWPF provides a concise description linking solar activity to earth’s climate. It pulls together several strands of observations and thought presented in recent posts, which are referenced at the end.

The GWPF article (here) is from Deepak Lal and focuses on why India should follow the US out of the Paris accord, but I am more interested in the scientific rationale. The author nicely summarizes an alternative explanation for climate fluctuations to that of IPCC “consensus” scientists. Excerpts below with my bolds.

Propounded by Danish physicist Henrik Svensmark and his associates, the cosmoclimatology theory states that climate is controlled by low cloud cover, which when widespread has a cooling effect by reflecting solar energy back into space and vice versa. These low clouds, in turn, are formed when sub-atomic particles called cosmic rays, emitted by exploding stars, combine with water vapour rising from the oceans.

The constant bombardment of the planet by cosmic rays is modulated by the solar wind, which when it is blowing prevents cosmic rays from reaching the earth and creating low clouds. The solar wind in turn is caused by the varying sunspot activity of the sun.

When, as recently, sunspot activity decreases we get the global ‘cooling’ observed during the recent ‘pause’ in global warming. Furthermore, as noted by the Princeton physicist William Happer (see my column “Clouds of Climate Change”, September 2011), the millennial ‘ice core’ records of the correlation between CO2 and temperature show “that changes in temperature preceded changes in CO2 levels, so that CO2 levels were an effect of temperature changes.

Much of this was probably due to outgassing of CO2 from the warming oceans or the reverse in cooling” (“The truth about greenhouse gasses”). For the oceans are the primary sinks as well as emitters of CO2. Given their vastness relative to the earth’s surface, it takes a long time for the ocean to warm from rises in terrestrial temperatures (and vice versa), hence the lag between temperature and CO2 levels.

cern-cloud

The CLOUD experiment is studying whether cosmic rays play a role in cloud formation. Maximilien Brice / CERN

The missing piece in the cosmoclimatology theory was the physical link between cosmic rays and cloud formation. The first confirmation of the basic hypothesis that “ions [cosmic rays] are fundamental for the nucleation of aerosols [tiny liquid or solid particles that provide a nucleus around which droplets can form from water vapour in the air]” was confirmed by the CLOUD experiment at CERN — the particle physics laboratory in 2011. (See Kirby et al, Nature, (2011), 476, 429-433: Cloud formation may be linked to cosmic rays  Experiment probes connection between climate change and radiation bombarding the atmosphere.

But there was still a problem with the hypothesis. It was that, even if as the CLOUD experiment showed ions helped aerosols to form and become stable against evaporation — a process called nucleation — these small aerosols “need to grow nearly a million times in mass in order to have an effect on cloud formation.”

The latest research by Svensmark and his associates (reported in H Svensmark et al. “Increased ionisation supports growth of aerosols into cloud condensation nuclei” Nature Communications 2017;8(1) shows“ both theoretically and empirically and experimentally, how interactions between ions and aerosols can accelerate the growth by adding material to the small aerosols and thereby help them survive to become cloud condensation nuclei” (David Whitehouse: “Cosmic Rays Climate Link Found”). This implies, Prof Svensmark argues, that the effect of the sun on climate could be “5-7 times stronger than that estimated due to changes in the radiant output of the sun alone.”

It also explains why over geological time, there have been much larger variations in climate correlated with changes in cosmic rays. He adds that “it also negates the idea that carbon dioxide has been controlling the climate on the se timescales. ”Thus, the Medieval Warm period around 1000 AD and the subsequent Little Ice Age between 1300AD and 1900AD fit with changes in solar activity.

It also explains climate change observed over the 20th century. Similarly, coolings and warmings around 2 degrees Celsius have occurred repeatedly over the last 10,000 years with variations in the Sun’s activity and cosmic ray influx. While over longer time periods there are much larger variations of up to 10 degrees Celsius as “the Sun and Earth travel through the Galaxy visiting regions with varying numbers of exploding stars”. Svensmark concludes that ‘finally we have the last piece of the puzzle explaining how particles from space affect climate on Earth. It gives an understanding of how changes caused by solar activity or by supernova activity can change climate”.

Surely with this confirmation of the cosmo-climatology theory a Nobel Prize in physics for Svensmark and his associates cannot be far off, and with that the end of the hubristic theory of anthropogenic CO2 generated climate change.

CC Theory1

Last word to Svensmark from his December 2017 publication

The missing link between exploding stars, clouds, and climate on Earth  Breakthrough in understanding of how cosmic rays from supernovae can influence Earth’s cloud cover and thereby climate

Summary: The study reveals how atmospheric ions, produced by the energetic cosmic rays raining down through the atmosphere, helps the growth and formation of cloud condensation nuclei — the seeds necessary for forming clouds in the atmosphere.

screenshot-2017-12-19-09.20.33

Cosmic rays interacting with the Earth’s atmosphere producing ions that helps turn small aerosols into cloud condensation nuclei — seeds on which liquid water droplets form to make clouds. A proton with energy of 100 GeV interact at the top of the atmosphere and produces a cascade of secondary particles who ionize molecules when traveling through the air. One 100 GeV proton hits every m2 at the top of the atmosphere every second.

The hypothesis in a nutshell

  • Cosmic rays, high-energy particles raining down from exploded stars, knock electrons out of air molecules. This produces ions, that is, positive and negative molecules in the atmosphere.
  • The ions help aerosols — clusters of mainly sulphuric acid and water molecules — to form and become stable against evaporation. This process is called nucleation. The small aerosols need to grow nearly a million times in mass in order to have an effect on clouds.
  • The second role of ions is that they accelerate the growth of the small aerosols into cloud condensation nuclei — seeds on which liquid water droplets form to make clouds. The more ions the more aerosols become cloud condensation nuclei. It is this second property of ions which is the new result published in Nature Communications.
  • Low clouds made with liquid water droplets cool the Earth’s surface.
  • Variations in the Sun’s magnetic activity alter the influx of cosmic rays to the Earth.
  • When the Sun is lazy, magnetically speaking, there are more cosmic rays and more low clouds, and the world is cooler.
  • When the Sun is active fewer cosmic rays reach the Earth and, with fewer low clouds, the world warms up.

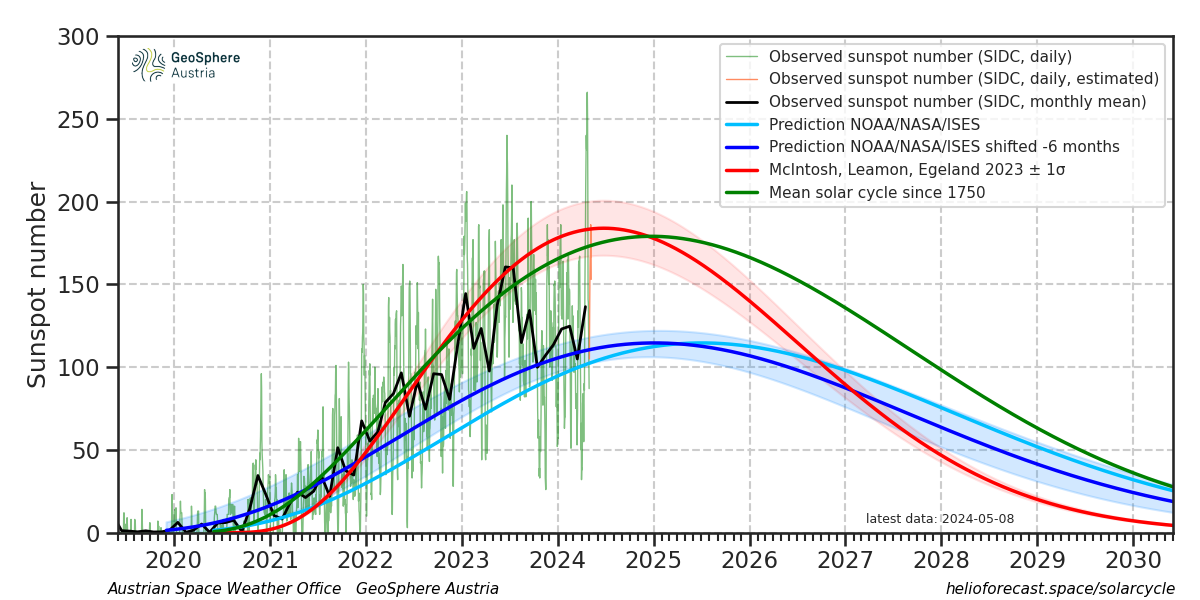
Figure 2 It is crucial to look at the baseline closely that in 2009 actually touched zero for months on end. This is not normal for the low point of the cycle. Figure 3 shows how cycle 24 was feeble compared with recent cycles. And it looks like it will have a duration of ~10 years (2009-2019) which as the low end of the normal range which is 9 to 14 years with mean of 11 years. Chart adapted from SIDC is dated 1 January 2018.

Update October 2021

Additional Resources:

Nature’s Sunscreen

Magnetic Pole Swapping and Cooling

Autumnal Climate Change

Worst Threat: Greenhouse Gas or Quiet Sun?

At the American Thinker, Anony mee writes The Coming Modern Grand Solar Minimum.  Excerpts in italics with my bolds.

solar_cycle_25_nasa_full

I wrote last week about the coming Grand Solar Minimum, something that will have much more impact on the environment than anything we puny humans can do. It generated a lot of interest from all sides, so it’s time to delve deeper into what we can expect.

Starting with the hype: During the last grand solar minimum (GSM), the Maunder Minimum of 1645 to 1715, glaciers advanced, rivers froze, sea ice expanded — in short, the Little Ice Age. Is another one is almost upon us?

Probably not. Maunder occurred at the tail end of a bi-millennial cycle. These cycles range between 2,000 and 2,600 years in length and see the Earth first warm, then cool. Gradual cooling had been going on for hundreds of years. Maunder just capped it off. Today we are a few hundred years into the warming phase of the subsequent bi-millennial cycle. Different starting conditions yield different paths.

The progressives say that we’re so deep into anthropogenically accelerated climate change (AACC) that there’s almost no time left to turn things around. If we don’t act now, it will be too late.

Nope, sorry squad members. What we can predict, instead, is an overall temperature reduction of 1 degree Centigrade by the end of the GSM. Afterward, natural warming at the rate of around 0.5 C. every hundred years will continue for the next 600 years or so.

That gives us a good 35 to 50 years to hone the science and come up with the best ways to mitigate the impact of unstoppable global warming on humankind; until, that is, it naturally reverses. See suggestions below for better uses of funding currently earmarked to address the “climate crisis.”

Reasonably speaking: We’ve been warming, so the cooling of the GSM will just even us out for a while. Therefore, nothing to worry about, right?

Well, not quite. There are a few worries. Plants grow in response to warmth, moisture, nutrients, and most importantly sunlight. Even if the temperature does not plunge to glacial depths, some cooling will take place and clouds are expected to grow denser and cover much of the earth’s surface as this GSM bottoms out. If normally-correlating volcanism takes place, the additional material in the atmosphere will further darken the globe and provide even more opportunity for condensation and cloud formation.

Last year, Dr. Valentina Zharkova wrote “This global cooling during the upcoming grand solar minimum…would require inter-government efforts to tackle problems with heat and food supplies for the whole population of the Earth” (not to mention their livestock).

The pessimists ask, what else can go wrong? Well, cooling will increase the demand for heat, darker days will increase the demand for light, and unfavorable outside conditions will increase the demand for power for enclosed food production. With more power needed, the amount we currently rely on from solar installations will decrease as cloud cover limits their efficacy.

A decrease in solar ultraviolet radiation can be expected to slow the formation of ozone in the atmosphere, a lack of which tends to destabilize the jet stream, causing wilder weather. Wind generators turn off when the wind is excessively strong. As we now know, they are not immune from freezing in place. In the face of a greater demand for power, we will generate less.

Even worse is this: Historically, GSMs have been associated with extreme weather events. Floods, droughts, heavy snowfall, late springs, and early autumns have all resulted in famine. Famine during GSMs has led to starvation and societal upheaval. No one wants the former, and I think we’ve seen enough of the latter this past year or so to do for our lifetimes.

We’re about 16 months into this GSM, with 32 more years to go. Already 2019 and 2020 saw record low numbers of sunspots. We’ve had lower than expected crop harvests due to unseasonable rains both years. The April 2021 USDA World Agricultural Product report has articles detailing Taiwan’s expected 20% decrease in rice production this year over last, Cuba’s rice production 15% below its five-year average, Argentina’s corn, Australia’s cotton, Malaysia’s palm oil — all down, all due primarily to the weather. There are some expected bumper crops, all based on expanded acreage.

We’ve got seven years until we hit the trough. There’s no time to lose. Fortunately, We the People are amazing. We’re strong, courageous, resilient, smart, well-educated, and clever. We are capable of coming together for a common cause and working well together regardless of politics and other differences. We must pull together to make sure we all survive the coming tumult. Here’s what we do.

On the federal level, take the brakes off energy production. No more talk of closing power plants, especially coal-fired ones, or of removing hydroelectric dams. Reinstate the Keystone XL pipeline; we’re going to need that fuel available to us when the predictable contraction of the global fuel market occurs. Extend the tax credits for those who install solar power. Production may not be optimal during the GSM, but as much as can occur will take a load off commercial energy.

At the United Nations, Ambassador Thomas-Greenfield should prioritize preparations for the coming dark, cold years. It is in the world’s best interest that all nations cease aggressions, even if just for a decade or so, so that we all may turn our resources to securing the lives of our peoples.

The USDA should not just take the brakes off agricultural production; it should encourage all producers to ramp it up. We need to have enough on hand to address the expected shortfall between production and requirement for at least five years. All loans to all farmers should be forgiven if they will agree to get on board with maximizing production. Garden seed producers, along with all other producers and processors, should be given significant tax credits for ramping up their production too.

Commerce should support vastly expanded food processing for long-term storage. Congress should fund the acquisition and storage of surplus staples and other food commodities so that sufficient amounts are on hand to keep our markets, feeding programs, and food banks operating when crop after crop begins to fail. Stockpiling for our future should take precedence over exports.

The NSC should demand a reconstitution of our strategic grain reserve, and that we prepare not just for ourselves, but to be able to share with needy neighbors and allies to keep America secure.

State, local, and tribal governments should clear away barriers to gardening and small animal production, including not limiting water catchment for gardening. Everything folks can do for themselves will take pressure off public services and limited markets. Local Emergency Services operations should also look at acquiring stocks of staples to help support their residents, as was done in many places last year.

Individuals, as well as schools and other institutions, should begin to garden, even if it’s just pots in a window. It’s a skill that takes time to learn and practice. Everyone should begin to preserve food for the hard times coming – freezing, canning, drying, smoking, pickling. As much as we can do for ourselves, we won’t be looking for someone else to have done for us.

This is really most important. We need to act now while food production is still relatively normal. Later on, if there’s nothing to buy, it won’t matter how much money we have on hand, as individuals or as a nation.

228683_5_

Valentina Zharkova presents her analysis and findings in paper Modern Grand Solar Minimum will lead to terrestrial cooling.  Excerpts in italics with my bolds.

In this editorial I will demonstrate with newly discovered solar activity proxy-magnetic field that the Sun has entered into the modern Grand Solar Minimum (2020–2053) that will lead to a significant reduction of solar magnetic field and activity like during Maunder minimum leading to noticeable reduction of terrestrial temperature.

ktmp_a_1796243_f0001_oc

Figure 3 presents the summary curve calculated with the derived mathematical formulae forwards for 1200 years and backwards 800 years. This curve reveals appearance of Grand Solar Cycles of 350–400 years caused by the interference of two magnetic waves. These grand cycles are separated by the grand solar minima, or the periods of very low solar activity.

Currently, the Sun has completed solar cycle 24 – the weakest cycle of the past 100+ years – and in 2020, has started cycle 25. During the periods of low solar activity, such as the modern grand solar minimum, the Sun will often be devoid of sunspots. This is what is observed now at the start of this minimum, because in 2020 the Sun has seen, in total, 115 spotless days (or 78%), meaning 2020 is on track to surpass the space-age record of 281 spotless days (or 77%) observed in 2019. However, the cycle 25 start is still slow in firing active regions and flares, so with every extra day/week/month that passes, the null in solar activity is extended marking a start of grand solar minimum.

Similarly to the Maunder Minimum … the reduction of solar magnetic field will cause a decrease of solar irradiance by about 0.22% for a duration of three solar cycles (25-27).” Zharkova determines that this drop in TSI (in conjunction with the “often overlooked” role solar background magnetic field plays, as well as with cloud nucleating cosmic rays) will lead to “a drop of the terrestrial temperature by up to 1.0°C from the current temperature during the next three cycles (25-27) … to only 0.4°C higher than the temperature measured in 1710,” with the largest temperature drops arriving “during the local minima between cycles 25−26 and cycles 26-27.

The reduction of a terrestrial temperature during the next 30 years can have important implications for different parts of the planet on growing vegetation, agriculture, food supplies, and heating needs in both Northern and Southern hemispheres. This global cooling during the upcoming grand solar minimum (2020-2053) can offset for three decades any signs of global warming and would require inter-government efforts to tackle problems with heat and food supplies for the whole population of the Earth.

More 2019 Evidence of Nature’s Sunscreen

Greenhouse with adjustable sun screens to control warming.

Update July 12, 2019

A paper was just published by an IPCC reviewer No Empirical Evidence for Significant Anthropogenic Climate Change by J. Kauppinen and P. Malmi. Excerpts in italics with my bolds. H/T WUWT

An analysis by Finnish researchers adds to the chain of studies supporting the Cosmoclimatology theory first proposed by Svensmark. Their focus is on the relation between the changes in temperatures and the changes in low cloud cover.  Their findings are consistent with the global brightening and dimming research centered at ETH Zurich, which is elaborated later on.

Figure 2. [2] Global temperature anomaly (red) and the global low cloud cover changes (blue) according to the observations. The anomalies are between summer 1983 and summer 2008. The time resolution of the data is one month, but the seasonal signal is removed. Zero corresponds about 15°C for the temperature and 26 % for the low cloud cover.

It turns out that the changes in the relative humidity and in the low cloud cover depend on each other [4]. So, instead of low cloud cover we can use the changes of the relative humidity in order to derive the natural temperature anomaly. According to the observations 1 % increase of the relative humidity decreases the temperature by 0.15°C, and consequently the last term in the above equation can be approximated by −15°C∆φ, where ∆φ is the change of the relative humidity at the altitude of the low clouds. Figure 4 shows the sum of the temperature changes due to the natural and CO2 contributions compared with the observed temperature anomaly. The natural component has been calculated using the changes of the relative humidity. Now we see that the natural forcing does not explain fully the observed temperature anomaly. So we have to add the contribution of CO2 (green line), because the time interval is now 40 years (1970–2010). The concentration of CO2 has now increased from 326 ppm to 389 ppm. The green line has been calculated using the sensitivity 0.24°C, which seems to be correct. In Fig. 4 we see clearly how well a change in the relative humidity can model the strong temperature minimum around the year 1975. This is impossible to interpret by CO2 concentration.

The IPCC climate sensitivity is about one order of magnitude too high, because a strong negative feedback of the clouds is missing in climate models. If we pay attention to the fact that only a small part of the increased CO2 concentration is anthropogenic, we have to recognize that the anthropogenic climate change does not exist in practice. The major part of the extra CO2 is emitted from oceans [6], according to Henry‘s law. The low clouds practically control the global average temperature. During the last hundred years the temperature is increased about 0.1°C because of CO2. The human contribution was about 0.01°C.

We have proven that the GCM-models used in IPCC report AR5 cannot compute correctly the natural component included in the observed global temperature. The reason is that the models fail to derive the influences of low cloud cover fraction on the global temperature. A too small natural component results in a too large portion for the contribution of the greenhouse gases like carbon dioxide. That is why IPCC represents the climate sensitivity more than one order of magnitude larger than our sensitivity 0.24°C. Because the anthropogenic portion in the increased CO2 is less than 10 %, we have practically no anthropogenic climate change. The low clouds control mainly the global temperature.

Previous Update  Hard Evidence of Solar Impact upon Earth Cloudiness

Later on is a reprinted discussion of global dimming and brightness resulting from fluctuating cloud cover.  This is topical because of new empirical research findings coming out of Asia.  H/T GWPF.  A study published by Kobe University research center is Revealing the impact of cosmic rays on the Earth’s climate.  Excerpts in italics with my bolds.

New evidence suggests that high-energy particles from space known as galactic cosmic rays affect the Earth’s climate by increasing cloud cover, causing an “umbrella effect”.

When galactic cosmic rays increased during the Earth’s last geomagnetic reversal transition 780,000 years ago, the umbrella effect of low-cloud cover led to high atmospheric pressure in Siberia, causing the East Asian winter monsoon to become stronger. This is evidence that galactic cosmic rays influence changes in the Earth’s climate. The findings were made by a research team led by Professor Masayuki Hyodo (Research Center for Inland Seas, Kobe University) and published on June 28 in the online edition of Scientific Reports.

The Svensmark Effect is a hypothesis that galactic cosmic rays induce low cloud formation and influence the Earth’s climate. Tests based on recent meteorological observation data only show minute changes in the amounts of galactic cosmic rays and cloud cover, making it hard to prove this theory. However, during the last geomagnetic reversal transition, when the amount of galactic cosmic rays increased dramatically, there was also a large increase in cloud cover, so it should be possible to detect the impact of cosmic rays on climate at a higher sensitivity.

(The Svensmark Effect is explained in essay The cosmoclimatology theory)

How Nature’s Sunscreen Works (from Previous Post)

A recent post Planetary Warming: Back to Basics discussed a recent paper by Nikolov and Zeller on the atmospheric thermal effect measured on various planets in our solar system. They mentioned that an important source of temperature variation around the earth’s energy balance state can be traced to global brightening and dimming.

This post explores the fact of fluctuations in the amount of solar energy reflected rather than absorbed by the atmosphere and surface. Brightening refers to more incoming solar energy from clear and clean skies. Dimming refers to less solar energy due to more sunlight reflected in the atmosphere by the presence of clouds and aerosols (air-born particles like dust and smoke).

The energy budget above from ERBE shows how important is this issue. On average, half of sunlight is either absorbed in the atmosphere or reflected before it can be absorbed by the surface land and ocean. Any shift in the reflectivity (albedo) impacts greatly on the solar energy warming the planet.

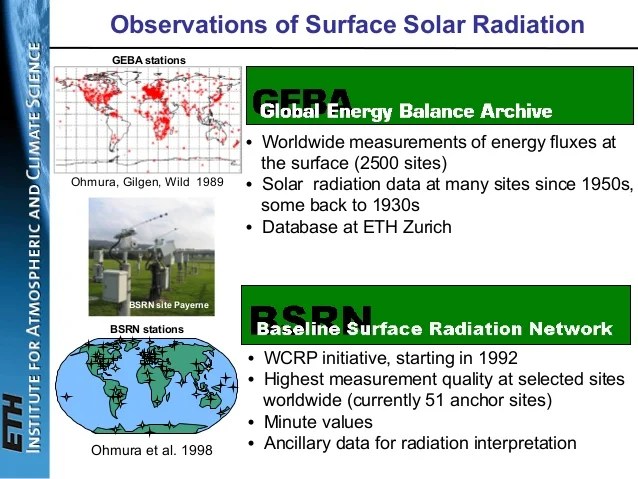
The leading research on global brightening/dimming is done at the Institute for Atmospheric and Climate Science of ETH Zurich, led by Martin Wild, senior scientist specializing in the subject.

Special instruments have been recording the solar radiation that reaches the Earth’s surface since 1923. However, it wasn’t until the International Geophysical Year in 1957/58 that a global measurement network began to take shape. The data thus obtained reveal that the energy provided by the sun at the Earth’s surface has undergone considerable variations over the past decades, with associated impacts on climate.

The initial studies were published in the late 1980s and early 1990s for specific regions of the Earth. In 1998 the first global study was conducted for larger areas, like the continents Africa, Asia, North America and Europe for instance.

Now ETH has announced The Global Energy Balance Archive (GEBA) version 2017: A database for worldwide measured surface energy fluxes. The title is a link to that paper published in May 2017 explaining the facility and some principal findings. The Archive itself is at  http://www.geba.ethz.ch.

For example, Figure 2 below provides the longest continuous record available in GEBA: surface downward shortwave radiation measured in Stockholm since 1922. Five year moving average in blue, 4th order regression model in red. Units Wm-2. Substantial multidecadal variations become evident, with an increase up to the 1950s (“early brightening”), an overall decline from the 1950s to the 1980s (“dimming”), and a recovery thereafter (“brightening”).
Figure 5. Composite of 56 European GEBA time series of annual surface downward shortwave radiation (thin line) from 1939 to 2013, plotted together with a 21 year Gaussian low-pass filter ((thick line). The series are expressed as anomalies (in Wm-2) from the 1971–2000 mean. Dashed lines are used prior to 1961 due to the lower number of records for this initial period. Updated from Sanchez-Lorenzo et al. (2015) including data until December 2013.
Martin Wild explains in a 2016 article Decadal changes in radiative fluxes at land and ocean surfaces and their relevance for global warming. From the Conclusion (SSR refers to solar radiation incident upon the surface)

However, observations indicate not only changes in the downward thermal fluxes, but even more so in their solar counterparts, whose records have a much wider spatial and temporal coverage. These records suggest multidecadal variations in SSR at widespread land-based observation sites. Specifically, declining tendencies in SSR between the 1950s and 1980s have been found at most of the measurement sites (‘dimming’), with a partial recovery at many of the sites thereafter (‘brightening’).

With the additional information from more widely measured meteorological quantities which can serve as proxies for SSR (primarily sunshine duration and DTR), more evidence for a widespread extent of these variations has been provided, as well as additional indications for an overall increasing tendency in SSR in the first part of the 20th century (‘early brightening’).

It is well established that these SSR variations are not caused by variations in the output of the sun itself, but rather by variations in the transparency of the atmosphere for solar radiation. It is still debated, however, to what extent the two major modulators of the atmospheric transparency, i.e., aerosol and clouds, contribute to the SSR variations.

The balance of evidence suggests that on longer (multidecadal) timescales aerosol changes dominate, whereas on shorter (decadal to subdecadal) timescales cloud effects dominate. More evidence is further provided for an increasing influence of aerosols during the course of the 20th century. However, aerosol and clouds may also interact, and these interactions were hypothesized to have the potential to amplify and dampen SSR trends in pristine and polluted areas, respectively.

No direct observational records are available over ocean surfaces. Nevertheless, based on the presented conceptual ideas of SSR trends amplified by aerosol–cloud interactions over the pristine oceans, modeling approaches as well as the available satellite-derived records it appears plausible that also over oceans significant decadal changes in SSR occur.

The coinciding multidecadal variations in SSTs and global aerosol emissions may be seen as a smoking gun, yet it is currently an open debate to what extent these SST variations are forced by aerosol-induced changes in SSR, effectively amplified by aerosol– cloud interactions, or are merely a result of unforced natural variations in the coupled ocean atmosphere system. Resolving this question could state a major step toward a better understanding of multidecadal climate change.

Another paper co-authored by Wild discusses the effects of aerosols and clouds The solar dimming/brightening effect over the Mediterranean Basin in the period 1979 − 2012. (NSWR is Net Short Wave Radiation, that is equal to surface solar radiation less reflected)

The analysis reveals an overall increasing trend in NSWR (all skies) corresponding to a slight solar brightening over the region (+0.36 Wm−2per decade), which is not statistically significant at 95% confidence level (C.L.). An increasing trend(+0.52 Wm−2per decade) is also shown for NSWR under clean skies (without aerosols), which is statistically significant (P=0.04).

This indicates that NSWR increases at a higher rate over the Mediterranean due to cloud variations only, because of a declining trend in COD (Cloud Optical Depth). The peaks in NSWR (all skies) in certain years (e.g., 2000) are attributed to a significant decrease in COD (see Figs. 9 and 10), whilethe two data series (NSWRall and NSWRclean) are highly correlated(r=0.95).

This indicates that cloud variation is the major regulatory factor for the amount and multi-decadal trends in NSWR over the Mediterranean Basin. (Note: Lower cloud optical depth is caused by less opaque clouds and/or decrease in overall cloudiness)

On the other hand, the results do not reveal a reversal from dimming to brightening during 1980s, as shown in several studies over Europe (Norris and Wild, 2007;Sanchez-Lorenzoet al., 2015), but a rather steady slight increasing trend in solar radiation, which, however, seems to be stabilized during the last years of the data series, in agreement with Sanchez-Lorenzo et al. (2015). Similarly, Wild (2012) reported that the solar brightening was less distinct at European sites after 2000 compared to the 1990s.

In contrast, the NSWR under clear (cloudless) skies shows a slight but statistically significant decreasing trend (−0.17 Wm−2per decade,P=0.002), indicating an overall decrease in NSWR over the Mediterranean due to water-vapor variability suggesting a transition to more humid environment under a warming climate.

Other researchers find cloudiness more dominant than aerosols. For example, The cause of solar dimming and brightening at the Earth’s surface during the last half century: Evidence from measurements of sunshine duration by Gerald Stanhill et al.

Analysis of the Angstrom-Prescott relationship between normalized values of global radiation and sunshine duration measured during the last 50 years made at five sites with a wide range of climate and aerosol emissions showed few significant differences in atmospheric transmissivity under clear or cloud-covered skies between years when global dimming occurred and years when global brightening was measured, nor in most cases were there any significant changes in the parameters or in their relationships to annual rates of fossil fuel combustion in the surrounding 1° cells. It is concluded that at the sites studied changes in cloud cover rather than anthropogenic aerosols emissions played the major role in determining solar dimming and brightening during the last half century and that there are reasons to suppose that these findings may have wider relevance.

Summary

The final words go to Martin Wild from Enlightening Global Dimming and Brightening.

Observed Tendencies in surface solar radiation
Figure 2.  Changes in surface solar radiation observed in regions with good station coverage during three periods.(left column) The 1950s–1980s show predominant declines (“dimming”), (middle column) the 1980s–2000 indicate partial recoveries (“brightening”) at many locations, except India, and (right column) recent developments after 2000 show mixed tendencies. Numbers denote typical literature estimates for the specified region and period in W m–2 per decade.  Based on various sources as referenced in Wild (2009).

The latest updates on solar radiation changes observed since the new millennium show no globally coherent trends anymore (see above and Fig. 2). While brightening persists to some extent in Europe and the United States, there are indications for a renewed dimming in China associated with the tremendous emission increases there after 2000, as well as unabated dimming in India (Streets et al. 2009; Wild et al. 2009).

We cannot exclude the possibility that we are currently again in a transition phase and may return to a renewed overall dimming for some years to come.

One can’t help but see the similarity between dimming/brightening and patterns of Global Mean Temperature, such as HadCrut.

Footnote: For more on clouds, precipitation and the ocean, see Here Comes the Rain Again

2019 Evidence of Nature’s Sunscreen

Greenhouse with adjustable sun screens to control warming.

2019 Update  Hard Evidence of Solar Impact upon Earth Cloudiness

Later on is a reprinted discussion of global dimming and brightness resulting from fluctuating cloud cover.  This is topical because of new empirical research findings coming out of Asia.  H/T GWPF.  A study published by Kobe University research center is Revealing the impact of cosmic rays on the Earth’s climate.  Excerpts in italics with my bolds.

New evidence suggests that high-energy particles from space known as galactic cosmic rays affect the Earth’s climate by increasing cloud cover, causing an “umbrella effect”.

When galactic cosmic rays increased during the Earth’s last geomagnetic reversal transition 780,000 years ago, the umbrella effect of low-cloud cover led to high atmospheric pressure in Siberia, causing the East Asian winter monsoon to become stronger. This is evidence that galactic cosmic rays influence changes in the Earth’s climate. The findings were made by a research team led by Professor Masayuki Hyodo (Research Center for Inland Seas, Kobe University) and published on June 28 in the online edition of Scientific Reports.

The Svensmark Effect is a hypothesis that galactic cosmic rays induce low cloud formation and influence the Earth’s climate. Tests based on recent meteorological observation data only show minute changes in the amounts of galactic cosmic rays and cloud cover, making it hard to prove this theory. However, during the last geomagnetic reversal transition, when the amount of galactic cosmic rays increased dramatically, there was also a large increase in cloud cover, so it should be possible to detect the impact of cosmic rays on climate at a higher sensitivity.

(The Svenmark Effect is explained in essay The cosmoclimatology theory)

How Nature’s Sunscreen Works (from Previous Post)

A recent post Planetary Warming: Back to Basics discussed a recent paper by Nikolov and Zeller on the atmospheric thermal effect measured on various planets in our solar system. They mentioned that an important source of temperature variation around the earth’s energy balance state can be traced to global brightening and dimming.

This post explores the fact of fluctuations in the amount of solar energy reflected rather than absorbed by the atmosphere and surface. Brightening refers to more incoming solar energy from clear and clean skies. Dimming refers to less solar energy due to more sunlight reflected in the atmosphere by the presence of clouds and aerosols (air-born particles like dust and smoke).

The energy budget above from ERBE shows how important is this issue. On average, half of sunlight is either absorbed in the atmosphere or reflected before it can be absorbed by the surface land and ocean. Any shift in the reflectivity (albedo) impacts greatly on the solar energy warming the planet.

The leading research on global brightening/dimming is done at the Institute for Atmospheric and Climate Science of ETH Zurich, led by Martin Wild, senior scientist specializing in the subject.

Special instruments have been recording the solar radiation that reaches the Earth’s surface since 1923. However, it wasn’t until the International Geophysical Year in 1957/58 that a global measurement network began to take shape. The data thus obtained reveal that the energy provided by the sun at the Earth’s surface has undergone considerable variations over the past decades, with associated impacts on climate.

The initial studies were published in the late 1980s and early 1990s for specific regions of the Earth. In 1998 the first global study was conducted for larger areas, like the continents Africa, Asia, North America and Europe for instance.

Now ETH has announced The Global Energy Balance Archive (GEBA) version 2017: A database for worldwide measured surface energy fluxes. The title is a link to that paper published in May 2017 explaining the facility and some principal findings. The Archive itself is at  http://www.geba.ethz.ch.

For example, Figure 2 below provides the longest continuous record available in GEBA: surface downward shortwave radiation measured in Stockholm since 1922. Five year moving average in blue, 4th order regression model in red. Units Wm-2. Substantial multidecadal variations become evident, with an increase up to the 1950s (“early brightening”), an overall decline from the 1950s to the 1980s (“dimming”), and a recovery thereafter (“brightening”).
Figure 5. Composite of 56 European GEBA time series of annual surface downward shortwave radiation (thin line) from 1939 to 2013, plotted together with a 21 year Gaussian low-pass filter ((thick line). The series are expressed as anomalies (in Wm-2) from the 1971–2000 mean. Dashed lines are used prior to 1961 due to the lower number of records for this initial period. Updated from Sanchez-Lorenzo et al. (2015) including data until December 2013.
Martin Wild explains in a 2016 article Decadal changes in radiative fluxes at land and ocean surfaces and their relevance for global warming. From the Conclusion (SSR refers to solar radiation incident upon the surface)

However, observations indicate not only changes in the downward thermal fluxes, but even more so in their solar counterparts, whose records have a much wider spatial and temporal coverage. These records suggest multidecadal variations in SSR at widespread land-based observation sites. Specifically, declining tendencies in SSR between the 1950s and 1980s have been found at most of the measurement sites (‘dimming’), with a partial recovery at many of the sites thereafter (‘brightening’).

With the additional information from more widely measured meteorological quantities which can serve as proxies for SSR (primarily sunshine duration and DTR), more evidence for a widespread extent of these variations has been provided, as well as additional indications for an overall increasing tendency in SSR in the first part of the 20th century (‘early brightening’).

It is well established that these SSR variations are not caused by variations in the output of the sun itself, but rather by variations in the transparency of the atmosphere for solar radiation. It is still debated, however, to what extent the two major modulators of the atmospheric transparency, i.e., aerosol and clouds, contribute to the SSR variations.

The balance of evidence suggests that on longer (multidecadal) timescales aerosol changes dominate, whereas on shorter (decadal to subdecadal) timescales cloud effects dominate. More evidence is further provided for an increasing influence of aerosols during the course of the 20th century. However, aerosol and clouds may also interact, and these interactions were hypothesized to have the potential to amplify and dampen SSR trends in pristine and polluted areas, respectively.

No direct observational records are available over ocean surfaces. Nevertheless, based on the presented conceptual ideas of SSR trends amplified by aerosol–cloud interactions over the pristine oceans, modeling approaches as well as the available satellite-derived records it appears plausible that also over oceans significant decadal changes in SSR occur.

The coinciding multidecadal variations in SSTs and global aerosol emissions may be seen as a smoking gun, yet it is currently an open debate to what extent these SST variations are forced by aerosol-induced changes in SSR, effectively amplified by aerosol– cloud interactions, or are merely a result of unforced natural variations in the coupled ocean atmosphere system. Resolving this question could state a major step toward a better understanding of multidecadal climate change.

Another paper co-authored by Wild discusses the effects of aerosols and clouds The solar dimming/brightening effect over the Mediterranean Basin in the period 1979 − 2012. (NSWR is Net Short Wave Radiation, that is equal to surface solar radiation less reflected)

The analysis reveals an overall increasing trend in NSWR (all skies) corresponding to a slight solar brightening over the region (+0.36 Wm−2per decade), which is not statistically significant at 95% confidence level (C.L.). An increasing trend(+0.52 Wm−2per decade) is also shown for NSWR under clean skies (without aerosols), which is statistically significant (P=0.04).

This indicates that NSWR increases at a higher rate over the Mediterranean due to cloud variations only, because of a declining trend in COD (Cloud Optical Depth). The peaks in NSWR (all skies) in certain years (e.g., 2000) are attributed to a significant decrease in COD (see Figs. 9 and 10), whilethe two data series (NSWRall and NSWRclean) are highly correlated(r=0.95).

This indicates that cloud variation is the major regulatory factor for the amount and multi-decadal trends in NSWR over the Mediterranean Basin. (Note: Lower cloud optical depth is caused by less opaque clouds and/or decrease in overall cloudiness)

On the other hand, the results do not reveal a reversal from dimming to brightening during 1980s, as shown in several studies over Europe (Norris and Wild, 2007;Sanchez-Lorenzoet al., 2015), but a rather steady slight increasing trend in solar radiation, which, however, seems to be stabilized during the last years of the data series, in agreement with Sanchez-Lorenzo et al. (2015). Similarly, Wild (2012) reported that the solar brightening was less distinct at European sites after 2000 compared to the 1990s.

In contrast, the NSWR under clear (cloudless) skies shows a slight but statistically significant decreasing trend (−0.17 Wm−2per decade,P=0.002), indicating an overall decrease in NSWR over the Mediterranean due to water-vapor variability suggesting a transition to more humid environment under a warming climate.

Other researchers find cloudiness more dominant than aerosols. For example, The cause of solar dimming and brightening at the Earth’s surface during the last half century: Evidence from measurements of sunshine duration by Gerald Stanhill et al.

Analysis of the Angstrom-Prescott relationship between normalized values of global radiation and sunshine duration measured during the last 50 years made at five sites with a wide range of climate and aerosol emissions showed few significant differences in atmospheric transmissivity under clear or cloud-covered skies between years when global dimming occurred and years when global brightening was measured, nor in most cases were there any significant changes in the parameters or in their relationships to annual rates of fossil fuel combustion in the surrounding 1° cells. It is concluded that at the sites studied changes in cloud cover rather than anthropogenic aerosols emissions played the major role in determining solar dimming and brightening during the last half century and that there are reasons to suppose that these findings may have wider relevance.

Summary

The final words go to Martin Wild from Enlightening Global Dimming and Brightening.

Observed Tendencies in surface solar radiation
Figure 2.  Changes in surface solar radiation observed in regions with good station coverage during three periods.(left column) The 1950s–1980s show predominant declines (“dimming”), (middle column) the 1980s–2000 indicate partial recoveries (“brightening”) at many locations, except India, and (right column) recent developments after 2000 show mixed tendencies. Numbers denote typical literature estimates for the specified region and period in W m–2 per decade.  Based on various sources as referenced in Wild (2009).

The latest updates on solar radiation changes observed since the new millennium show no globally coherent trends anymore (see above and Fig. 2). While brightening persists to some extent in Europe and the United States, there are indications for a renewed dimming in China associated with the tremendous emission increases there after 2000, as well as unabated dimming in India (Streets et al. 2009; Wild et al. 2009).

We cannot exclude the possibility that we are currently again in a transition phase and may return to a renewed overall dimming for some years to come.

One can’t help but see the similarity between dimming/brightening and patterns of Global Mean Temperature, such as HadCrut.

Footnote: For more on clouds, precipitation and the ocean, see Here Comes the Rain Again

2019 Update Scafetta vs. IPCC: Dueling Climate Theories

In one corner, Darth Vader, the Prince of CO2, filling the air with the overwhelming sound of his poison breath. Opposing him, Luke Skywalker, a single skeptic armed only with facts and logic.

OK, that’s over the top, but it’s what came to mind while reading a new paper by Nicola Scafetta in which he goes up against the IPCC empire. And Star Wars came to mind since Scafetta’s theory involves astronomical cycles. The title below links to the text, which is well worth reading.  Some excerpts follow in italics with my bolds. H/T GWPF

CMIP5 General Circulation Models versus a Semi-Empirical Model Based on Natural Oscillations

Updated 2019:  Graph Comparing Scafetta Model with UAHv6

H/T Tallbloke for providing this image:

scafetta and UAH1995to2018

Green area is range of forecasts from CMIP5 models.  Turquoise  area is forecast from Scafetta astronomical climate model.

Scafetta comes out swinging: From the Abstract

Since 1850 the global surface temperature has warmed by about 0.9 oC. The CMIP5 computer climate models adopted by the IPCC have projected that the global surface temperature could rise by 2-5 oC from 2000 to 2100 for anthropogenic reasons. These projections are currently used to justify expensive mitigation policies to reduce the emission of anthropogenic greenhouse gases such as CO2.

However, recent scientific research has pointed out that the IPCC climate models fail to properly reconstruct the natural variability of the climate. Indeed, advanced techniques of analysis have revealed that the natural variability of the climate is made of several oscillations spanning from the decadal to the millennial scales (e.g. with periods of about 9.1, 10.4, 20, 60, 115, 1000 years and others). These oscillations likely have an astronomical origin.

In this short review I briefly summarize some of the main reasons why the AGWT should be questioned. In addition, I show that an alternative interpretation of climate change based on the evidences that a significant part of it is due to specific natural oscillations is possible. A modeling based on such interpretation agrees better with the climatic comprehensive picture deduced from the data.

The Missing Hot-Spot

It has been observed that for the last decades climate models predict a hot-spot, that is, a significant warming of a band of the upper troposphere 10 km over the tropics and the equator. The presence of this hot-spot is quite important because it would indicate that the water-vapor feedback to radiative forcing would be correctly reproduced by the models.

However, this predicted hot-spot has never been found in the tropospheric temperature records [20,21]. This could only be suggesting either that both the temperature records obtained with satellite measures and balloons have been poorly handled or that the models severely fail to properly simulate the water-vapor feedback. In the latter case, the flaw of the models would be fatal because the water-vapor feedback is the most important among the climate feedbacks.

Without a strong feedback response from water vapor the models would only predict a moderate climate sensitivity to radiative forcing of about 1.2 oC for CO2 doubling instead of about 3 oC. Figure 8 compares the observed temperature trend in the troposphere versus the climate model predictions: from Ref. [21]. The difference between the two record sets is evident.

scafettafig8

Figure 8. Comparison between observed temperature trend in the troposphere (green-blue) versus the climate model predictions (red). From Ref. [21].

Observations Favor Scafetta’s Model Over GCM Models

I have proposed that the global surface temperature record could be reconstructed from the decadal to the millennial scale using a minimum of 6 harmonics at 9.1, 10.4, 20, 60, 115 and 983 years plus a anthropogenic and volcano contribution that can be evaluated from the CMIP5 GCM outputs reduced by half because, as discussed above, the real climate sensitivity to radiative forcing appears to be about half of what assumed by the current climate models. The figure highlights the better performance of the solar–astronomical semi-empirical model versus the CMIP5 models. This is particularly evident since 2000, as shown in the inserts.

scafettavscmip

Figure 12 [A] The four CMIP5 ensemble average projections versus the HadCRUT4 GST record (black). [B] The solar– astronomical semi-empirical model. From Ref. [4] Left axis shows temperature anomalies in degrees Celsius.

Forecast Validation

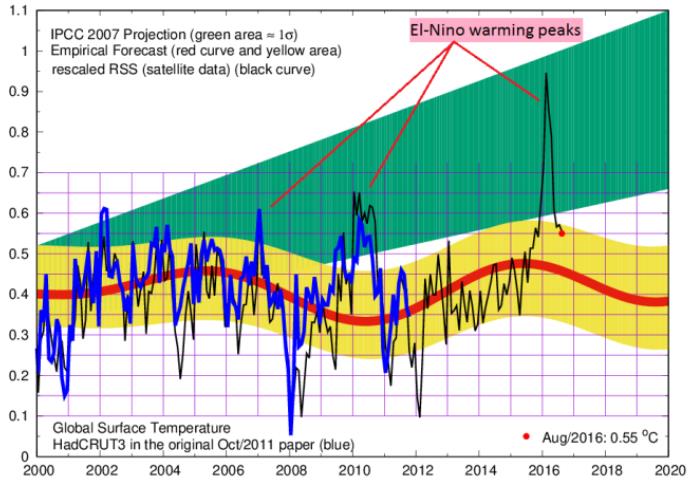
In 2011 I prepared a global surface temperature forecast based on a simplified climate model based on four natural oscillations (9.1, 10.4, 20 and 60 year) plus an estimate of a realistic anthropogenic contribution [25]: for example, see Refs. [33,34,35] referring to the 60-year cycle. Figure 13 compares my 2011 forecast (red curve) against the global surface temperature record I used in 2011 (HadCUT3, blue curve) and a modern global surface temperature record updated at June/2016 (RSS MSU record, black line, http://www.remss.com/measurements/upper-air-temperature).

The RSS MSU record, which is a global surface temperature estimate using satellite measurements, was linearly rescaled to fit the original HadCUT3 global surface temperature record for optimal comparison. Other global temperature reconstructions perform similarly. Note that the HadCUT3 has been dismissed in 2014. Figure 13 also shows in green a schematic representation of the IPCC GCMs prediction since 2000 [25].

scafettaforecast082016

Left axis shows temperature anomalies in degrees Celsius.

Figure 13. Comparison of the forecast (red-yellow curve) made in Scafetta (2011) [25] against (1) the temperature record used in 2011 (HadCRUT3, blue curve), (2) the IPCC climate model projections since 2000 (green area), (3) a recent global temperature record (RSS MSU record, black line, linearly re-scaled to match the HadCRUT3 from 1979 to 2014). The temperature record has followed Scafetta’s forecast better than the IPCC ones. In 2015-2016 there was a strong El-Nino Pacific Ocean natural warming that caused the observed temperature peak.

Summary

The considerations emerging from these findings yield to the conclusion that the IPCC climate models severely overestimate the anthropogenic climatic warming by about two times. I have finally proposed a semi-empirical climate model calibrated to reconstruct the natural climatic variability since Medieval times. I have shown that this model projects a very moderate warming until 2040 and a warming less than 2 oC from 2000 to 2100 using the same anthropogenic emission scenarios used by the CMIP5 models: see Figure 12.

This result suggests that climatic adaptation policies, which are less expensive than the mitigation ones, could be sufficient to address most of the consequences of a climatic change during the 21st century. Similarly, fossil fuels, which have contributed significantly to the development of our societies, can still be used to fulfill our energy necessities until equally efficient alternative energy sources could be determined and developed.

Scafetta Briefly Explains the Harmonic oscillation theory

“The theory is very simple in words. The solar system is characterized by a set of specific gravitational oscillations due to the fact that the planets are moving around the sun. Everything in the solar system tends to synchronize to these frequencies beginning with the sun itself. The oscillating sun then causes equivalent cycles in the climate system. Also the moon acts on the climate system with its own harmonics. In conclusion we have a climate system that is mostly made of a set of complex cycles that mirror astronomical cycles. Consequently it is possible to use these harmonics to both approximately hindcast and forecast the harmonic component of the climate, at least on a global scale. This theory is supported by strong empirical evidences using the available solar and climatic data.”

Update Nov. 20, 2017.  Scafetta graph to June 2017

cooling-vs-warming-forecasts-scafetta-2017

From Natural climate variability, part 2: Interpretation of the post 2000
temperature standstill, Scafetta et al. 2017

Footnote: Scafetta is not alone.  Dr. Norman Page has a new paper going into detail about forecasting climate by means of  solar-astronomical patterns.

The coming cooling: Usefully accurate climate forecasting for policy makers

Tweak the Sun’s Rotation, and We’re Not Here

Watch the Sun rotate for over a month brought to you by SDO. Since the Sun rotates once every 27 days on average, this movie presents more than an entire solar rotation. From March 30 through Apr. 29, 2011, the Sun sported quite a few active regions and magnetic loops. The movie shows the Sun in the 171 Angstrom wavelength of extreme ultraviolet light (capturing ionized iron heated to about 600,000 degrees), color coded to appear gold. The movie is based on a frame taken every 15 minutes being shown at 24 frames per second, with very few data gaps in this almost two-minute movie. Source Solar Dynamics Observatory

Another fresh reminder we owe our existence to the sun along with the climate in which we evolved and adapted. The Forbes article is Early Sun’s ‘Goldilocks’ Rotation Rate May Be Why We’re Here  Excerpts in italics with my bolds.

Our early Sun’s rate of rotation may be one reason we’re here to talk about it, astrobiologists now say. The key likely lies in the fact that between the first hundred million to the first billion years of its life, our G-dwarf star likely had a ‘Goldilocks’ rotation rate; neither too slow nor too fast.

Instead, its hypothetical ‘intermediate’ few days rate of rotation guaranteed our Sun was active enough to rid our newly-formed Earth of its inhospitable, hydrogen-rich primary atmosphere. This would have enabled a more habitable, secondary atmosphere composed of nitrogen, carbon dioxide, hydrogen and oxygen to eventually form.

If it had been a ‘fast’ (less than one day rotator), our Sun might have continually stripped our young planet of its secondary atmosphere as well. However, if it took more than 10 days to rotate, it might not have been active enough to strip Earth of its hypothetical primary atmosphere.

Such ideas were recently bandied about in oral presentations at last month’s the General Assembly of the International Astronomical Union (IAU) in Vienna.

Earth’s very first atmosphere would have been too hot and too thick, more like Venus’ present-day atmosphere, Theresa Luftinger, an astrophysicist at the University of Vienna, told me. No known organisms could have evolved under such an atmosphere.  A secondary atmosphere cannot evolve in the presence of a primordial atmosphere , says Luftinger.

It’s the star’s magnetic dynamo that drives its magnetic fields. And these magnetic fields, in turn, interact with the star itself, creating an interplay of extreme stellar activity.

“So, the quicker the star rotates, the higher the interaction between the magnetic field and the stellar body ,” said Luftinger.

Faster rotation means higher extreme ultra-violet and x-ray activity, Helmut Lammer, an astrophysicist at Austria’s Space Science Institute in Graz, told me. This would lead to atmospheric stripping and water loss on earthlike planets around an active young star, he says. 

Our Sun is now a very slow rotator at 27 days. But that wasn’t always the case. As for why some stars seem to inherently rotate faster than others?

Astrophysicists suspect that initial conditions within star-forming clouds cause newborn stars to have different rotation rates.

Researchers are able to roughly pinpoint the Sun’s early rotation rates by studying the isotopic ratios of neon, argon, potassium, and uranium here in Earth’s crust. That is, elements which have atoms that have the same numbers of protons in their atomic nucleus, but different numbers of neutrons. The researchers also considered such isotopic ratios from decades’-old Venus surface samples taken by Soviet Venus lander missions.


The cosmoclimatology theory


An article at GWPF provides a concise description linking solar activity to earth’s climate. It pulls together several strands of observations and thought presented in recent posts, which are referenced at the end.

The GWPF article (here) is from Deepak Lal and focuses on why India should follow the US out of the Paris accord, but I am more interested in the scientific rationale. The author nicely summarizes an alternative explanation for climate fluctuations to that of IPCC “consensus” scientists. Excerpts below with my bolds.

Propounded by Danish physicist Henrik Svensmark and his associates, the cosmoclimatology theory states that climate is controlled by low cloud cover, which when widespread has a cooling effect by reflecting solar energy back into space and vice versa. These low clouds, in turn, are formed when sub-atomic particles called cosmic rays, emitted by exploding stars, combine with water vapour rising from the oceans.

The constant bombardment of the planet by cosmic rays is modulated by the solar wind, which when it is blowing prevents cosmic rays from reaching the earth and creating low clouds. The solar wind in turn is caused by the varying sunspot activity of the sun.

When, as recently, sunspot activity decreases we get the global ‘cooling’ observed during the recent ‘pause’ in global warming. Furthermore, as noted by the Princeton physicist William Happer (see my column “Clouds of Climate Change”, September 2011), the millennial ‘ice core’ records of the correlation between CO2 and temperature show “that changes in temperature preceded changes in CO2 levels, so that CO2 levels were an effect of temperature changes.

Much of this was probably due to outgassing of CO2 from the warming oceans or the reverse in cooling” (“The truth about greenhouse gasses”). For the oceans are the primary sinks as well as emitters of CO2. Given their vastness relative to the earth’s surface, it takes a long time for the ocean to warm from rises in terrestrial temperatures (and vice versa), hence the lag between temperature and CO2 levels.

cern-cloud

The CLOUD experiment is studying whether cosmic rays play a role in cloud formation. Maximilien Brice / CERN

The missing piece in the cosmoclimatology theory was the physical link between cosmic rays and cloud formation. The first confirmation of the basic hypothesis that “ions [cosmic rays] are fundamental for the nucleation of aerosols [tiny liquid or solid particles that provide a nucleus around which droplets can form from water vapour in the air]” was confirmed by the CLOUD experiment at CERN — the particle physics laboratory in 2011. (See Kirby et al, Nature, (2011), 476, 429-433: Cloud formation may be linked to cosmic rays  Experiment probes connection between climate change and radiation bombarding the atmosphere.

But there was still a problem with the hypothesis. It was that, even if as the CLOUD experiment showed ions helped aerosols to form and become stable against evaporation — a process called nucleation — these small aerosols “need to grow nearly a million times in mass in order to have an effect on cloud formation.”

The latest research by Svensmark and his associates (reported in H Svensmark et al. “Increased ionisation supports growth of aerosols into cloud condensation nuclei” Nature Communications 2017;8(1) shows“ both theoretically and empirically and experimentally, how interactions between ions and aerosols can accelerate the growth by adding material to the small aerosols and thereby help them survive to become cloud condensation nuclei” (David Whitehouse: “Cosmic Rays Climate Link Found”). This implies, Prof Svensmark argues, that the effect of the sun on climate could be “5-7 times stronger than that estimated due to changes in the radiant output of the sun alone.”

It also explains why over geological time, there have been much larger variations in climate correlated with changes in cosmic rays. He adds that “it also negates the idea that carbon dioxide has been controlling the climate on the se timescales. ”Thus, the Medieval Warm period around 1000 AD and the subsequent Little Ice Age between 1300AD and 1900AD fit with changes in solar activity.

It also explains climate change observed over the 20th century. Similarly, coolings and warmings around 2 degrees Celsius have occurred repeatedly over the last 10,000 years with variations in the Sun’s activity and cosmic ray influx. While over longer time periods there are much larger variations of up to 10 degrees Celsius as “the Sun and Earth travel through the Galaxy visiting regions with varying numbers of exploding stars”. Svensmark concludes that ‘finally we have the last piece of the puzzle explaining how particles from space affect climate on Earth. It gives an understanding of how changes caused by solar activity or by supernova activity can change climate”.

Surely with this confirmation of the cosmo-climatology theory a Nobel Prize in physics for Svensmark and his associates cannot be far off, and with that the end of the hubristic theory of anthropogenic CO2 generated climate change.

CC Theory1

Last word to Svensmark from his December 2017 publication

The missing link between exploding stars, clouds, and climate on Earth  Breakthrough in understanding of how cosmic rays from supernovae can influence Earth’s cloud cover and thereby climate

Summary: The study reveals how atmospheric ions, produced by the energetic cosmic rays raining down through the atmosphere, helps the growth and formation of cloud condensation nuclei — the seeds necessary for forming clouds in the atmosphere.

screenshot-2017-12-19-09.20.33

Cosmic rays interacting with the Earth’s atmosphere producing ions that helps turn small aerosols into cloud condensation nuclei — seeds on which liquid water droplets form to make clouds. A proton with energy of 100 GeV interact at the top of the atmosphere and produces a cascade of secondary particles who ionize molecules when traveling through the air. One 100 GeV proton hits every m2 at the top of the atmosphere every second.

The hypothesis in a nutshell

  • Cosmic rays, high-energy particles raining down from exploded stars, knock electrons out of air molecules. This produces ions, that is, positive and negative molecules in the atmosphere.
  • The ions help aerosols — clusters of mainly sulphuric acid and water molecules — to form and become stable against evaporation. This process is called nucleation. The small aerosols need to grow nearly a million times in mass in order to have an effect on clouds.
  • The second role of ions is that they accelerate the growth of the small aerosols into cloud condensation nuclei — seeds on which liquid water droplets form to make clouds. The more ions the more aerosols become cloud condensation nuclei. It is this second property of ions which is the new result published in Nature Communications.
  • Low clouds made with liquid water droplets cool the Earth’s surface.
  • Variations in the Sun’s magnetic activity alter the influx of cosmic rays to the Earth.
  • When the Sun is lazy, magnetically speaking, there are more cosmic rays and more low clouds, and the world is cooler.
  • When the Sun is active fewer cosmic rays reach the Earth and, with fewer low clouds, the world warms up.

Figure 2 It is crucial to look at the baseline closely that in 2009 actually touched zero for months on end. This is not normal for the low point of the cycle. Figure 3 shows how cycle 24 was feeble compared with recent cycles. And it looks like it will have a duration of ~10 years (2009-2019) which as the low end of the normal range which is 9 to 14 years with mean of 11 years. Chart adapted from SIDC is dated 1 January 2018.

Update March 2019

sunspotcycle_strip

Additional Resources:

Nature’s Sunscreen

Magnetic Pole Swapping and Cooling

Autumnal Climate Change

Autumnal Climate Change 2017


geese-in-v-formation

Seeing a lot more of this lately, along with hearing the geese  honking. And in the next month or so, we expect that trees around here will lose their leaves. It definitely is climate change of the seasonal variety.

Interestingly, the science on this is settled: It is all due to reduction of solar energy because of the shorter length of days (LOD). The trees drop their leaves and go dormant because of less sunlight, not because of lower temperatures. The latter is an effect, not the cause.

Of course, the farther north you go, the more remarkable the seasonal climate change. St. Petersburg, Russia has their balmy “White Nights” in June when twilight is as dark as it gets, followed by the cold, dark winter and a chance to see the Northern Lights.

And as we have been monitoring, the Arctic ice has been melting from sunlight in recent months, but will now begin to build again in the darkness to its maximum in March.

We can also expect in January and February for another migration of millions of Canadians (nicknamed “snowbirds”) to fly south in search of a summer-like climate to renew their memories and hopes. As was said to me by one man in Saskatchewan (part of the Canadian wheat breadbasket region): “Around here we have Triple-A farmers: April to August, and then Arizona.” Here’s what he was talking about: Quartzsite Arizona annually hosts 1.5M visitors, mostly between November and March.

Of course, this is just North America. Similar migrations occur in Europe, and in the Southern Hemisphere, the climates are changing in the opposite direction, Springtime currently. Since it is so obviously the sun causing this seasonal change, the question arises: Does the sunlight vary on longer than annual timescales?

The Solar-Climate Debate

And therein lies a great, enduring controversy between those (like the IPCC) who dismiss the sun as a driver of multi-Decadal climate change, and those who see a connection between solar cycles and Earth’s climate history. One side can be accused of ignoring the sun because of a prior commitment to CO2 as the climate “control knob”.

The other side is repeatedly denounced as “cyclomaniacs” in search of curve-fitting patterns to prove one or another thesis. It is also argued that a claim of 60-year cycles can not be validated with only 150 years or so of reliable data. That point has weight, but it is usually made by those on the CO2 bandwagon despite temperature and CO2 trends correlating for only 2 decades during the last century.

One scientist in this field is Nicola Scafetta, who presents the basic concept this way:

“The theory is very simple in words. The solar system is characterized by a set of specific gravitational oscillations due to the fact that the planets are moving around the sun. Everything in the solar system tends to synchronize to these frequencies beginning with the sun itself. The oscillating sun then causes equivalent cycles in the climate system. Also the moon acts on the climate system with its own harmonics. In conclusion we have a climate system that is mostly made of a set of complex cycles that mirror astronomical cycles. Consequently it is possible to use these harmonics to both approximately hindcast and forecast the harmonic component of the climate, at least on a global scale. This theory is supported by strong empirical evidences using the available solar and climatic data.”

He goes on to say:

“The global surface temperature record appears to be made of natural specific oscillations with a likely solar/astronomical origin plus a noncyclical anthropogenic contribution during the last decades. Indeed, because the boundary condition of the climate system is regulated also by astronomical harmonic forcings, the astronomical frequencies need to be part of the climate signal in the same way the tidal oscillations are regulated by soli-lunar harmonics.”

He has concluded that “at least 60% of the warming of the Earth observed since 1970 appears to be induced by natural cycles which are present in the solar system.” For the near future he predicts a stabilization of global temperature and cooling until 2030-2040.


For more see Scafetta vs. IPCC: Dueling Climate Theories

A Deeper, but Accessible Presentation of Solar-Climate Theory

I have found this presentation by Ian Wilson to be persuasive while honestly considering all of the complexities involved.

The author raises the question: What if there is a third factor that not only drives the variations in solar activity that we see on the Sun but also drives the changes that we see in climate here on the Earth?

The linked article is quite readable by a general audience, and comes to a similar conclusion as Scafetta above: There is a connection, but it is not simple cause and effect. And yes, length of day (LOD) is a factor beyond the annual cycle.

Click to access IanwilsonForum2008.pdf

It is fair to say that we are still at the theorizing stage of understanding a solar connection to earth’s climate. And at this stage, investigators look for correlations in the data and propose theories (explanations) for what mechanisms are at work. Interestingly, despite the lack of interest from the IPCC, solar and climate variability is a very active research field these days.

A summary of recent studies is provided at NoTricksZone: Since 2014, 400 Scientific Papers Affirm A Strong Sun-Climate Link

Ian Wilson has much more to say at his blog: http://astroclimateconnection.blogspot.com.au/

Once again, it appears that the world is more complicated than a simple cause and effect model suggests.

Fluctuations in observed global temperatures can be explained by a combination of oceanic and solar cycles.  See engineering analysis from first principles Quantifying Natural Climate Change.

For everything there is a season, a time for every purpose under heaven.

What has been will be again, what has been done will be done again;
there is nothing new under the sun.
(Ecclesiastes 3:1 and 1:9)

Original post in 2015 included this commentary with Dr. Arnd Bernaerts

ArndB comments:

Fine writing, Ron, well done!
No doubt the sun is the by far the most important factor for not living on a globe with temperatures down to minus 200°C. That makes me hesitating to comment on „solar and climate variability” or “the sun drives climate” (currently at NTZ – link above), but today merely requesting humbly that the claimed correlation should be based at least on some evidence showing that the sun has ever caused a significant climatic shift during the last one million years, which was not only a bit air temperature variability due to solar cycles that necessarily occur in correlation with the intake and release of solar-radiation by the oceans and seas.

Interestingly the UK MetOffice just released a report (Sept.2015, pages 21) titled:
“Big Changes Underway in the Climate System?” by attributing the most possible and likely changes to the current status of El Niño, PDO, and AMO, and – of course – carbon dioxide -, and a bit speculation on less sun-energy (see following excerpt at link)

Click to access Changes_In_The_Climate_System.pdf

From p. 13: “It is well established that trace gases such as carbon dioxide warm our planet through the “greenhouse effect”. These gases are relatively transparent to incoming sunlight, but trap some of the longer-wavelength radiation emitted by the Earth. However, other factors, both natural and man-made, can also change global temperatures. For example, a cooling could be caused by a downturn of the amount of energy received from the sun, or an increase in the sunlight reflected back to space by aerosol particles in the atmosphere. Aerosols increase temporarily after volcanic eruptions, but are also generated by pollution such as sulphur dioxide from factories.
These “external” factors are imposed on the climate system and may also affect the ENSO, PDO and AMO variations……

My Reply:

Thanks Arnd for engaging in this topic.

My view is that the ocean makes the climate by means of its huge storage of solar energy, and the fluctuations, oscillations in the processes of distributing that energy globally and to the poles. In addition, the ocean is the most affected by any variation in the incoming solar energy, both by the sun outputting more or less, and also by clouds and aerosols blocking incoming radiation more or less (albedo or brightness variability).  See Nature’s Sunscreen

The oscillations you mention, including the present El Nino (and Blob) phenomenon, show natural oceanic variability over years and decades. Other ocean cycles occur over multi-decadal and centennial scales, and are still being analyzed.

At the other end of the scale, I am persuaded that the earth switches between the “hot house” and the “ice house” mainly due to orbital cycles, which are an astronomical phenomenon. These are strong enough to overwhelm the moderating effect of the ocean thermal flywheel.

The debate centers on the extent to which solar activity has contributed to climate change over the last 3000 years of our current interglacial period, including current solar cycles.


Nature’s Sunscreen

Greenhouse with adjustable sun screens to control warming.

A recent post Planetary Warming: Back to Basics discussed a recent paper by Nikolov and Zeller on the atmospheric thermal effect measured on various planets in our solar system. They mentioned that an important source of temperature variation around the earth’s energy balance state can be traced to global brightening and dimming.

This post explores the fact of fluctuations in the amount of solar energy reflected rather than absorbed by the atmosphere and surface. Brightening refers to more incoming solar energy from clear and clean skies. Dimming refers to less solar energy due to more sunlight reflected in the atmosphere by the presence of clouds and aerosols (air-born particles like dust and smoke).

The energy budget above from ERBE shows how important is this issue. On average, half of sunlight is either absorbed in the atmosphere or reflected before it can be absorbed by the surface land and ocean. Any shift in the reflectivity (albedo) impacts greatly on the solar energy warming the planet.

The leading research on global brightening/dimming is done at the Institute for Atmospheric and Climate Science of ETH Zurich, led by Martin Wild, senior scientist specializing in the subject.

Special instruments have been recording the solar radiation that reaches the Earth’s surface since 1923. However, it wasn’t until the International Geophysical Year in 1957/58 that a global measurement network began to take shape. The data thus obtained reveal that the energy provided by the sun at the Earth’s surface has undergone considerable variations over the past decades, with associated impacts on climate.

The initial studies were published in the late 1980s and early 1990s for specific regions of the Earth. In 1998 the first global study was conducted for larger areas, like the continents Africa, Asia, North America and Europe for instance.

Now ETH has announced The Global Energy Balance Archive (GEBA) version 2017: A database for worldwide measured surface energy fluxes. The title is a link to that paper published in May 2017 explaining the facility and some principal findings. The Archive itself is at  http://www.geba.ethz.ch.

For example, Figure 2 below provides the longest continuous record available in GEBA: surface downward shortwave radiation measured in Stockholm since 1922. Five year moving average in blue, 4th order regression model in red. Units Wm-2. Substantial multidecadal variations become evident, with an increase up to the 1950s (“early brightening”), an overall decline from the 1950s to the 1980s (“dimming”), and a recovery thereafter (“brightening”).
Figure 5. Composite of 56 European GEBA time series of annual surface downward shortwave radiation (thin line) from 1939 to 2013, plotted together with a 21 year Gaussian low-pass filter ((thick line). The series are expressed as anomalies (in Wm-2) from the 1971–2000 mean. Dashed lines are used prior to 1961 due to the lower number of records for this initial period. Updated from Sanchez-Lorenzo et al. (2015) including data until December 2013.
Martin Wild explains in a 2016 article Decadal changes in radiative fluxes at land and ocean surfaces and their relevance for global warming. From the Conclusion (SSR refers to solar radiation incident upon the surface)

However, observations indicate not only changes in the downward thermal fluxes, but even more so in their solar counterparts, whose records have a much wider spatial and temporal coverage. These records suggest multidecadal variations in SSR at widespread land-based observation sites. Specifically, declining tendencies in SSR between the 1950s and 1980s have been found at most of the measurement sites (‘dimming’), with a partial recovery at many of the sites thereafter (‘brightening’).

With the additional information from more widely measured meteorological quantities which can serve as proxies for SSR (primarily sunshine duration and DTR), more evidence for a widespread extent of these variations has been provided, as well as additional indications for an overall increasing tendency in SSR in the first part of the 20th century (‘early brightening’).

It is well established that these SSR variations are not caused by variations in the output of the sun itself, but rather by variations in the transparency of the atmosphere for solar radiation. It is still debated, however, to what extent the two major modulators of the atmospheric transparency, i.e., aerosol and clouds, contribute to the SSR variations.

The balance of evidence suggests that on longer (multidecadal) timescales aerosol changes dominate, whereas on shorter (decadal to subdecadal) timescales cloud effects dominate. More evidence is further provided for an increasing influence of aerosols during the course of the 20th century. However, aerosol and clouds may also interact, and these interactions were hypothesized to have the potential to amplify and dampen SSR trends in pristine and polluted areas, respectively.

No direct observational records are available over ocean surfaces. Nevertheless, based on the presented conceptual ideas of SSR trends amplified by aerosol–cloud interactions over the pristine oceans, modeling approaches as well as the available satellite-derived records it appears plausible that also over oceans significant decadal changes in SSR occur.

The coinciding multidecadal variations in SSTs and global aerosol emissions may be seen as a smoking gun, yet it is currently an open debate to what extent these SST variations are forced by aerosol-induced changes in SSR, effectively amplified by aerosol– cloud interactions, or are merely a result of unforced natural variations in the coupled ocean atmosphere system. Resolving this question could state a major step toward a better understanding of multidecadal climate change.

9959227_orig

Another paper co-authored by Wild discusses the effects of aerosols and clouds The solar dimming/brightening effect over the Mediterranean Basin in the period 1979 − 2012. (NSWR is Net Short Wave Radiation, that is equal to surface solar radiation less reflected)

The analysis reveals an overall increasing trend in NSWR (all skies) corresponding to a slight solar brightening over the region (+0.36 Wm−2per decade), which is not statistically significant at 95% confidence level (C.L.). An increasing trend(+0.52 Wm−2per decade) is also shown for NSWR under clean skies (without aerosols), which is statistically significant (P=0.04).

This indicates that NSWR increases at a higher rate over the Mediterranean due to cloud variations only, because of a declining trend in COD (Cloud Optical Depth). The peaks in NSWR (all skies) in certain years (e.g., 2000) are attributed to a significant decrease in COD (see Figs. 9 and 10), whilethe two data series (NSWRall and NSWRclean) are highly correlated(r=0.95).

This indicates that cloud variation is the major regulatory factor for the amount and multi-decadal trends in NSWR over the Mediterranean Basin. (Note: Lower cloud optical depth is caused by less opaque clouds and/or decrease in overall cloudiness)

On the other hand, the results do not reveal a reversal from dimming to brightening during 1980s, as shown in several studies over Europe (Norris and Wild, 2007;Sanchez-Lorenzoet al., 2015), but a rather steady slight increasing trend in solar radiation, which, however, seems to be stabilized during the last years of the data series, in agreement with Sanchez-Lorenzo et al. (2015). Similarly, Wild (2012) reported that the solar brightening was less distinct at European sites after 2000 compared to the 1990s.

In contrast, the NSWR under clear (cloudless) skies shows a slight but statistically significant decreasing trend (−0.17 Wm−2per decade,P=0.002), indicating an overall decrease in NSWR over the Mediterranean due to water-vapor variability suggesting a transition to more humid environment under a warming climate.

Other researchers find cloudiness more dominant than aerosols. For example, The cause of solar dimming and brightening at the Earth’s surface during the last half century: Evidence from measurements of sunshine duration by Gerald Stanhill et al.

Analysis of the Angstrom-Prescott relationship between normalized values of global radiation and sunshine duration measured during the last 50 years made at five sites with a wide range of climate and aerosol emissions showed few significant differences in atmospheric transmissivity under clear or cloud-covered skies between years when global dimming occurred and years when global brightening was measured, nor in most cases were there any significant changes in the parameters or in their relationships to annual rates of fossil fuel combustion in the surrounding 1° cells. It is concluded that at the sites studied changes in cloud cover rather than anthropogenic aerosols emissions played the major role in determining solar dimming and brightening during the last half century and that there are reasons to suppose that these findings may have wider relevance.

Summary

The final words go to Martin Wild from Enlightening Global Dimming and Brightening.

Observed Tendencies in surface solar radiation
Figure 2.  Changes in surface solar radiation observed in regions with good station coverage during three periods.(left column) The 1950s–1980s show predominant declines (“dimming”), (middle column) the 1980s–2000 indicate partial recoveries (“brightening”) at many locations, except India, and (right column) recent developments after 2000 show mixed tendencies. Numbers denote typical literature estimates for the specified region and period in W m–2 per decade.  Based on various sources as referenced in Wild (2009).

The latest updates on solar radiation changes observed since the new millennium show no globally coherent trends anymore (see above and Fig. 2). While brightening persists to some extent in Europe and the United States, there are indications for a renewed dimming in China associated with the tremendous emission increases there after 2000, as well as unabated dimming in India (Streets et al. 2009; Wild et al. 2009).

We cannot exclude the possibility that we are currently again in a transition phase and may return to a renewed overall dimming for some years to come.

One can’t help but see the similarity between dimming/brightening and patterns of Global Mean Temperature, such as HadCrut.

Footnote: For more on clouds, precipitation and the ocean, see Here Comes the Rain Again