Arctic Ice Moment of Truth 2023

For ice extent in the Arctic, the bar is set at 15M km2. The average peak in the last 17 years occurs on day 62 at 14.986M km2 before descending, though some years the extent can be above 15M much later.  Ten of the last 17 years were higher than 15M, and recently 2020, 2022 and now 2023 ice extents cleared the bar at 15M km2. The actual day of annual peak ice extent varied between day 59 (2016) to day 82 (2012).

All of this means that 2023 peaked while passing the 15M km2 threshold two days later than average.  The graph below shows the situation evolving over the last four weeks anticipating the annual maximum.

The NH ice extent gap on day 77 is at 269k km2, or 1.8%.  After the day 62 peak, 2023 extents declined sharply until day 71 before recovering to reduce the deficit. (Note that ice extent is affected also by winds piling up drift ice, as well as melting from intrusions of warmer air or water.) SII has shown lower extents throughout this period, averaging 250k km2 less than MASIE.

March monthly average extents in recent years have been below average. While average extents will decline furher, we shall see what this year does with only two weeks left to make a difference.

Region 2023077 Day 77 Average 2023-Ave. 2018077 2023-2018
 (0) Northern_Hemisphere 14649553 14918812 -269258 14528206 121348
 (1) Beaufort_Sea 1070966 1070266 700 1070445 521
 (2) Chukchi_Sea 966006 965801 206 966006 0
 (3) East_Siberian_Sea 1087137 1087109 29 1087137 0
 (4) Laptev_Sea 897845 897837 7 897845 0
 (5) Kara_Sea 934539 922767 11771 934807 -268
 (6) Barents_Sea 605659 637818 -32159 689702 -84043
 (7) Greenland_Sea 835991 617943 218048 514678 321313
 (8) Baffin_Bay_Gulf_of_St._Lawrence 1249789 1546282 -296493 1399951 -150162
 (9) Canadian_Archipelago 854843 853118 1724 853109 1734
 (10) Hudson_Bay 1260903 1259573 1330 1257207 3696
 (11) Central_Arctic 3243341 3217827 25514 3131403 111939
 (12) Bering_Sea 739914 760728 -20814 445480 294434
 (13) Baltic_Sea 67881 80745 -12864 127449 -59568
(14) Sea_of_Okhotsk 822356 982054 -159698 1136990 -314633

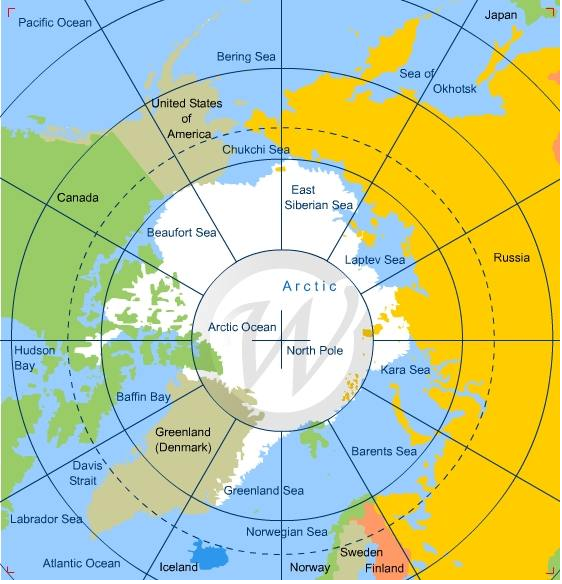
The main deficit to average is in Baffin Bay and Sea of Okhotsk, partly offset by a surplus in Greenland Sea. Smaller pluses and minuses are found in other regions.

Typically, Arctic ice extent loses 67 to 70% of the March maximum by mid September, before recovering the ice in building toward the next March.

What will the ice do this year?  Where will 2023 rank in the annual Arctic maximum competition?

Drift ice in Okhotsk Sea at sunrise.

For more on the Pacific basins see post Meet Bering and Okhotsk Seas

Normal Arctic Ice End of Feb. 2023

With the end of February, nearly all of the Arctic ocean basins are frozen over, so the growth of ice extent slows down, reaching its annual maximum mid-March.  According to MASIE February on average adds 500k km2, and this year the growth was 880k km2, erasing a starting deficit and matching the month end average. The few basins that can grow ice this time of year tend to fluctuate and alternate waxing and waning, which appears as a see saw pattern in these images.  For example, this year the two Pacific basins combined were slightly above average, but Okhotsk is 33% in surplus, while Bering is 26% in deficit to their last March maximums.

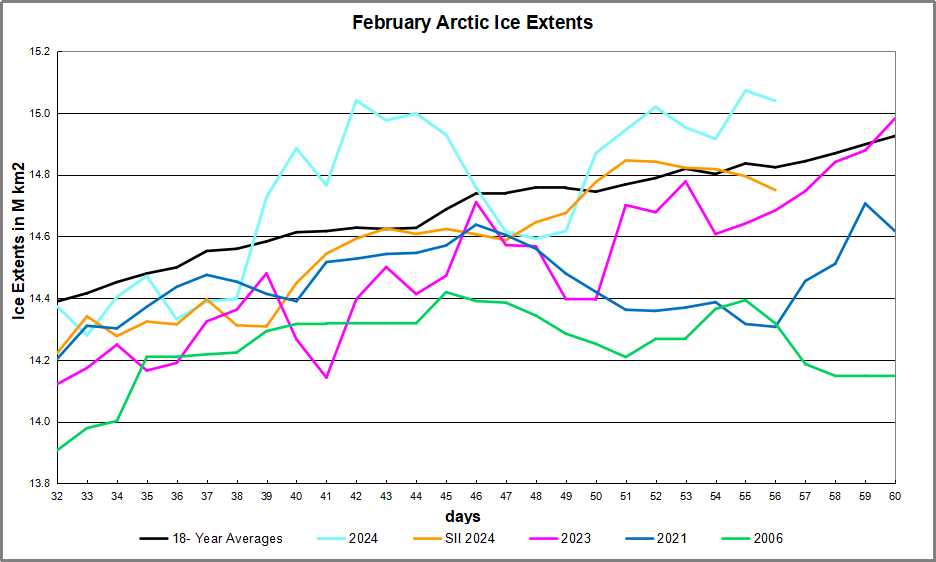
The month of February 2023 was remarkable for a wobbly Polar vortex, which cycles freezing polar air south, replacing it with incursions of warmer air into the Arctic, and then reverses the effect. This results in rising and falling freezing rates.  The graph below shows the ice recovery for February 2023, the 17-year average and some recent years.

The graph (cyan) shows February 2023 starting with a 284k km2 deficit to average, several up and downs in the growth rate, until matching average at month end. 2020 also ended average with a steady refreezing rate.   SII (Sea Ice Index) tracked well below MASIE this month showing 400k km2 lower extent than MASIE yesterday.

February Ice Growth Despite See Saws in Atlantic and Pacific

As noted above, this time of year the Arctic adds ice on the fringes since the central basins are already frozen over.  The animation above shows the Okhotsk (upper left) and Bering (lower left) see saw.  Okhotsk grew steadily to reach 133% of its last maximum, while Bering waffled up and down, ending the month ~100k km2 higher and 74% of its max.

On the right, Atlantic side Barents at the top fluctuated and added little ice ending at 56% of its max.  On the lower right, Baffin Bay, and Greenland Sea (center right) show another see saw.  Greenland Sea waffled adding`80k km2, ending  at 96% of max, while Baffin Bay steadily added 300k km2 to reach 90% of maximum.

The table below presents ice extents in the Arctic regions for day 31 (Jan. 31) compared to the 17 year average and 2018.

Region 2023059 Day 59 Average 2023-Ave. 2018059 2023-2018
 (0) Northern_Hemisphere 14878631 14899627 -20996 14485052 393579
 (1) Beaufort_Sea 1070966 1070314 652 1070445 521
 (2) Chukchi_Sea 966006 965374 632 965971 35
 (3) East_Siberian_Sea 1087137 1087106 32 1087120 18
 (4) Laptev_Sea 897845 897836 9 897845 0
 (5) Kara_Sea 884398 926234 -41836 922905 -38507
 (6) Barents_Sea 442032 631999 -189967 544938 -102906
 (7) Greenland_Sea 745952 611275 134677 473064 272889
 (8) Baffin_Bay_Gulf_of_St._Lawrence 1624859 1519162 105697 1786606 -161747
 (9) Canadian_Archipelago 854843 853331 1511 853109 1734
 (10) Hudson_Bay 1260903 1260417 487 1260838 66
 (11) Central_Arctic 3185508 3213856 -28349 3065181 120326
 (12) Bering_Sea 627138 664021 -36884 336065 291073
 (13) Baltic_Sea 81571 98009 -16437 123280 -41709
(14) Sea_of_Okhotsk 1132332 1058413 73919 1069898 62433

The table shows the only major deficit to average appears in Barents seas, more than offset by surpluses in Greenland Sea and Baffin Bay. These few peripheral basins are the only remaining regions with additional ice extent to add.

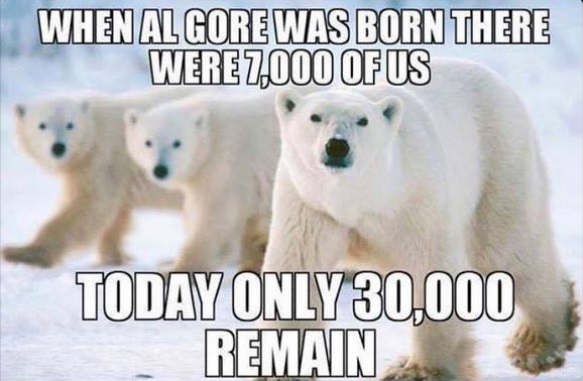
The polar bears have a Valentine Day’s wish for Arctic Ice.

welovearcticicefinal

And Arctic Ice loves them back, returning every year so the bears can roam and hunt for seals.

Footnote:

Seesaw accurately describes Arctic ice in another sense:  The ice we see now is not the same ice we saw previously.  It is better to think of the Arctic as an ice blender than as an ice cap, explained in the post The Great Arctic Ice Exchange.

Feb. 1, 2023 Arctic Ice Lagging in Bering and Barents

In January, most of the Arctic ocean basins are frozen over, and so the growth of ice extent slows down.  According to MASIE January on average adds 1.255M km2, and this year it was 1.205M.  However, February started with a deficit of  246k km2 under the 17 year average.  The few basins that can grow ice this time of year tend to fluctuate and alternate waxing and waning, which appears as a see saw pattern in these images.

The last two weeks of January 2023 Arctic ice extents waffled with little growth, resulting in a deficit to average of 385k km2, or ~3% of total NH ice extent. The graph below shows the ice recovery for January  2023, the 17-year average and several recent years.

The graph (cyan) shows end of January 2023 a 385k km2 deficit to average, with little accumulation since Jan. 18.  2023 is comparable to 2021, and slightly higher than 2018.  SII (Sea Ice Index) dropped well below MASIE this month showing 327k km2 lower extent than MASIE yesterday.

January Ice Growth Despite See Saws in Atlantic and Pacific

As noted above, this time of year the Arctic adds ice on the fringes since the central basins are already frozen over.  The animation above shows the Okhotsk (upper left) and Bering (lower left) see saw.  Okhotsk doubled its extent to reach 95% of its last maximum, while Bering waffled up and down, ending the month ~100k km2 higher and 62% of its max.

On the right, Atlantic side Barents at the top fluctuated and added `150k km2, ending at 49% of its max.  On the lower right, Baffin Bay, and Greenland Sea (center right) show another see saw.  Greenland Sea waffled with little extent added, remaining at 89% of max, while Baffin Bay steadily added 370k km2 to reach 70% of maximum.

The table below presents ice extents in the Arctic regions for day 31 (Jan. 31) compared to the 17 year average and 2018.

Region 2023031 Day 31 Average 2023-Ave. 2018031 2023-2018
 (0) Northern_Hemisphere 13996981 14382814 -385833 13792271 204710
 (1) Beaufort_Sea 1070966 1070313 654 1070445 521
 (2) Chukchi_Sea 966006 965970 36 965971 35
 (3) East_Siberian_Sea 1087137 1087054 83 1087120 18
 (4) Laptev_Sea 897845 897821 23 897845 0
 (5) Kara_Sea 926860 918191 8668 895363 31497
 (6) Barents_Sea 390711 580354 -189643 481947 -91236
 (7) Greenland_Sea 687900 602566 85334 501411 186490
 (8) Baffin_Bay_Gulf_of_St._Lawrence 1267760 1335679 -67919 1406903 -139142
 (9) Canadian_Archipelago 854843 853342 1501 853109 1734
 (10) Hudson_Bay 1260903 1260762 141 1260838 66
 (11) Central_Arctic 3192568 3211378 -18810 3184817 7751
 (12) Bering_Sea 521005 655768 -134763 382207 138798
 (13) Baltic_Sea 33096 64178 -31083 41714 -8618
(14) Sea_of_Okhotsk 806160 819543 -13383 704398 101762

The table shows that most of the deficit to average (2.7%) appears in Bering and Barents seas, with smaller deficits in Baffin Bay and Okhotsk.  These four peripheral regions are the only remaining regions with additional ice extent to add.

The polar bears have a Valentine Day’s wish for Arctic Ice.

welovearcticicefinal

And Arctic Ice loves them back, returning every year so the bears can roam and hunt for seals.

Footnote:

Seesaw accurately describes Arctic ice in another sense:  The ice we see now is not the same ice we saw previously.  It is better to think of the Arctic as an ice blender than as an ice cap, explained in the post The Great Arctic Ice Exchange.

Arctic Ice In Perspective 2022

When Arctic ice is melting in summer until mid-September, warmists stoke fears about ice disappearing in the North. In fact, the pattern of Arctic ice seen in historical perspective is not alarming. People are over-thinking and over-analyzing Arctic Ice extents, and getting wrapped around the axle (or should I say axis).  So let’s keep it simple and we can all readily understand what is happening up North.

I have noticed at some other blogs people complain about my monthly Arctic ice updates focusing on extents starting in 2007. This post will show why that time period is entirely reasonable as a subject for analysis. I will use the ever popular NOAA dataset derived from satellite passive microwave sensors.  It sometimes understates the ice extents, but everyone refers to it and it is complete from 1979 to present.  Here’s what NOAA reports (in M km2):

We are frequently told that only the March maximums and the September minimums matter, since the other months are only transitional between the two.  So the graph above shows the mean ice extent, averaging the two months March and September.

If I were adding this to the Ice House of Mirrors, the name would be The X-Ray Ice Mirror, because it looks into the structure of the time series.   For even more clarity and simplicity, here is the table:

NOAA NH Annual Average Ice Extents (in M km2).  Sea Ice Index v3.0 (here)

Year Average Change Rate of Change
1979 11.697
1996 11.353 -0.344 -0.020 per year
2007 9.405 -1.949 -0.177 per year
2022 9.728  +0.323 +0.022 per year

The satellites involve rocket science, but this does not.  There was a small loss of ice extent over the first 17 years, then a dramatic downturn for 11 years, 9 times the rate as before. That was followed by the current 15-year plateau with a slight gain comparable to the beginning loss.  All the fuss is over that middle period, and we know what caused it.  A lot of multi-year ice was flushed out through the Fram Strait, leaving behind more easily melted younger ice. The effects from that natural occurrence bottomed out in 2007.

Kwok et al say this about the Variability of Fram Strait ice flux:

The average winter area flux over the 18-year record (1978–1996) is 670,000 km2, 7% of the area of the Arctic Ocean. The winter area flux ranges from a minimum of 450,000 km2 in 1984 to a maximum of 906,000 km2 in 1995. . .The average winter volume flux over the winters of October 1990 through May 1995 is 1745 km3 ranging from a low of 1375 km3 in the 1990 flux to a high of 2791 km3 in 1994.

https://www.researchgate.net/publication/261010602/download

Conclusion:

Some complain it is too soon to say Arctic Ice is recovering, or that 2007 is a true change point.  The same people were quick to jump on a declining period after 1996 as evidence of a “Death Spiral.”

Footnote:

No one knows what will happen to Arctic ice.

Except maybe the polar bears.

And they are not talking.

Except, of course, to the admen from Coca-Cola


Fear Not for Arctic Ice New Year 2023

Impressive Arctic ice recovery continued in December as seen in the animation below:

The month of December 2022 shows Hudson Bay (lower right) starting with some western shore ice and ending ice covered, adding in that basin 1.25M km2. Just above Hudson, you can see the Gulf of St. Lawrence icing over, and Baffin Bay adding ice as well, now up to 49% of its annual maximum.

At the extreme left Okhotsk Sea also starts with little shore ice and grows from 53k km2 up to 393k km2, reaching down to Japan.  At the top Kara freezes over and Barents and Greenland Seas add ice to their margins. The graph below shows the December ice recovery.

Note the average year adds 2M km2 and 2022 was matching that until the last week or so.  Not surprising when the polar vortex pushed freezing Arctic air as far south as Texas and Florida, incursion of warm southern air into the Arctic inhibited further ice growth.  SII tracked MASIE with somewhat lower extent toward the end.

The table below shows year-end ice extents in the various Arctic basins compared to the 16-year averages and some recent years.

Region 2022365 Day 365 Average 2022-Ave. 2020365 2022-2020
 (0) Northern_Hemisphere 12864130 13071346  -207216  12765491 98639 
 (1) Beaufort_Sea 1070966 1070354  612  1070689 277 
 (2) Chukchi_Sea 966006 964526  1481  966006
 (3) East_Siberian_Sea 1087137 1087133  1087120 17 
 (4) Laptev_Sea 897845 897840  897827 18 
 (5) Kara_Sea 864832 886899  -22067  879232 -14400 
 (6) Barents_Sea 270677 438702  -168025  371122 -100445 
 (7) Greenland_Sea 674210 582086  92124  592839 81371 
 (8) Baffin_Bay_Gulf_of_St._Lawrence 889961 994988  -105027  867509 22452 
 (9) Canadian_Archipelago 854843 853370  1473  854597 245 
 (10) Hudson_Bay 1254256 1237220  17036  1257919 -3663 
 (11) Central_Arctic 3222361 3204794  17567  3159881 62481 
 (12) Bering_Sea 373249 405344  -32095  249522 123727 
 (13) Baltic_Sea 22409 32724  -10315  7986 14423 
(14) Sea_of_Okhotsk 393473 388636  4837  479972 -86498 

This year’s ice extent is 207k km2 or 1.6% below average.  Only Baffin Bay and Barents Sea have sizeable deficits to average, while Greenland Sea shows a surplus.  Other Arctic basins are already maxed out or are near their average for this date.

Comparing Arctic Ice at End of Years

At  the bottom is a discussion of statistics on year-end Arctic Sea Ice extents.  The values are averages of the last five days of each year.  End of December is a neutral point in the melting-freezing cycle, midway between September minimum and March maximum extents.

Background from Previous Post Updated to Year-End 2022

Some years ago reading a thread on global warming at WUWT, I was struck by one person’s comment: “I’m an actuary with limited knowledge of climate metrics, but it seems to me if you want to understand temperature changes, you should analyze the changes, not the temperatures.” That rang bells for me, and I applied that insight in a series of Temperature Trend Analysis studies of surface station temperature records. Those posts are available under this heading. Climate Compilation Part I Temperatures

This post seeks to understand Arctic Sea Ice fluctuations using a similar approach: Focusing on the rates of extent changes rather than the usual study of the ice extents themselves. Fortunately, Sea Ice Index (SII) from NOAA provides a suitable dataset for this project. As many know, SII relies on satellite passive microwave sensors to produce charts of Arctic Ice extents going back to 1979.  The current Version 3 has become more closely aligned with MASIE, the modern form of Naval ice charting in support of Arctic navigation. The SII User Guide is here.

There are statistical analyses available, and the one of interest (table below) is called Sea Ice Index Rates of Change (here). As indicated by the title, this spreadsheet consists not of monthly extents, but changes of extents from the previous month. Specifically, a monthly value is calculated by subtracting the average of the last five days of the previous month from this month’s average of final five days. So the value presents the amount of ice gained or lost during the present month.

These monthly rates of change have been compiled into a baseline for the period 1980 to 2010, which shows the fluctuations of Arctic ice extents over the course of a calendar year. Below is a graph of those averages of monthly changes up to and including this year. Those familiar with Arctic Ice studies will not be surprised at the sine wave form. December end is a relatively neutral point in the cycle, midway between the September Minimum and March Maximum.

The graph makes evident the six spring/summer months of melting and the six autumn/winter months of freezing.  Note that June-August produce the bulk of losses, while October-December show the bulk of gains. Also the peak and valley months of March and September show very little change in extent from beginning to end.

The table of monthly data reveals the variability of ice extents over the last 4 decades.

The values in January show changes from the end of the previous December, and by summing twelve consecutive months we can calculate an annual rate of change for the years 1979 to 2022.

As many know, there has been a decline of Arctic ice extent over these 40 years, averaging 70k km2 per year. But year over year, the changes shift constantly between gains and losses, ranging up to +/- 500k km2.

Moreover, it seems random as to which months are determinative for a given year. For example, much ado was printed about June and July 2021 melting faster than expected resulting in higher losses of ice extents. But then the final 3 months of 2021 more than made up for those summer losses

As it happens in this dataset, October has the highest rate of adding ice. The table below shows the variety of monthly rates in the record as anomalies from the 1980-2010 baseline. In this exhibit a red cell is a negative anomaly (less than baseline for that month) and blue is positive (higher than baseline).


Note that the  +/ –  rate anomalies are distributed all across the grid, sequences of different months in different years, with gains and losses offsetting one another.  For example in 2022 the outlier months were June and September where unusual amounts of ice were lost.  Despite above average gains Oct.–Dec., the year ended with a large negative anomaly.  June 2021 lost more ice than the baseline, but about the same as 2017, and not as much as 2012. The gains in Oct.-Dec. 2021 were ~1M km2 above baseline, but were exceeded by the same months in 2019 and 2020.  The bottom line presents the average anomalies for each month over the period 1979-2021.  Note the rates of gains and losses mostly offset, and the average of all months in the bottom right cell is virtually zero.

A final observation: The graph below shows the Yearend Arctic Ice Extents for the last 32 years.

Year-end Arctic ice extents (last 5 days of December) show three distinct regimes: 1988-1998, 1998-2010, 2010-2022. The average year-end extent 1989-2010 is 13.4M km2. In the last decade, 2011 was 13.0M km2, and six years later, 2017 was 12.3M km2. 2021 rose back to 13.06  2022 slipped back to 12.6M. So for all the the fluctuations, the net is zero, or a slight gain from 2010. Talk of an Arctic ice death spiral is fanciful.

These data show a noisy, highly variable natural phenomenon. Clearly, unpredictable factors are in play, principally water structure and circulation, atmospheric circulation regimes, and also incursions and storms. And in the longer view, today’s extents are not unusual.


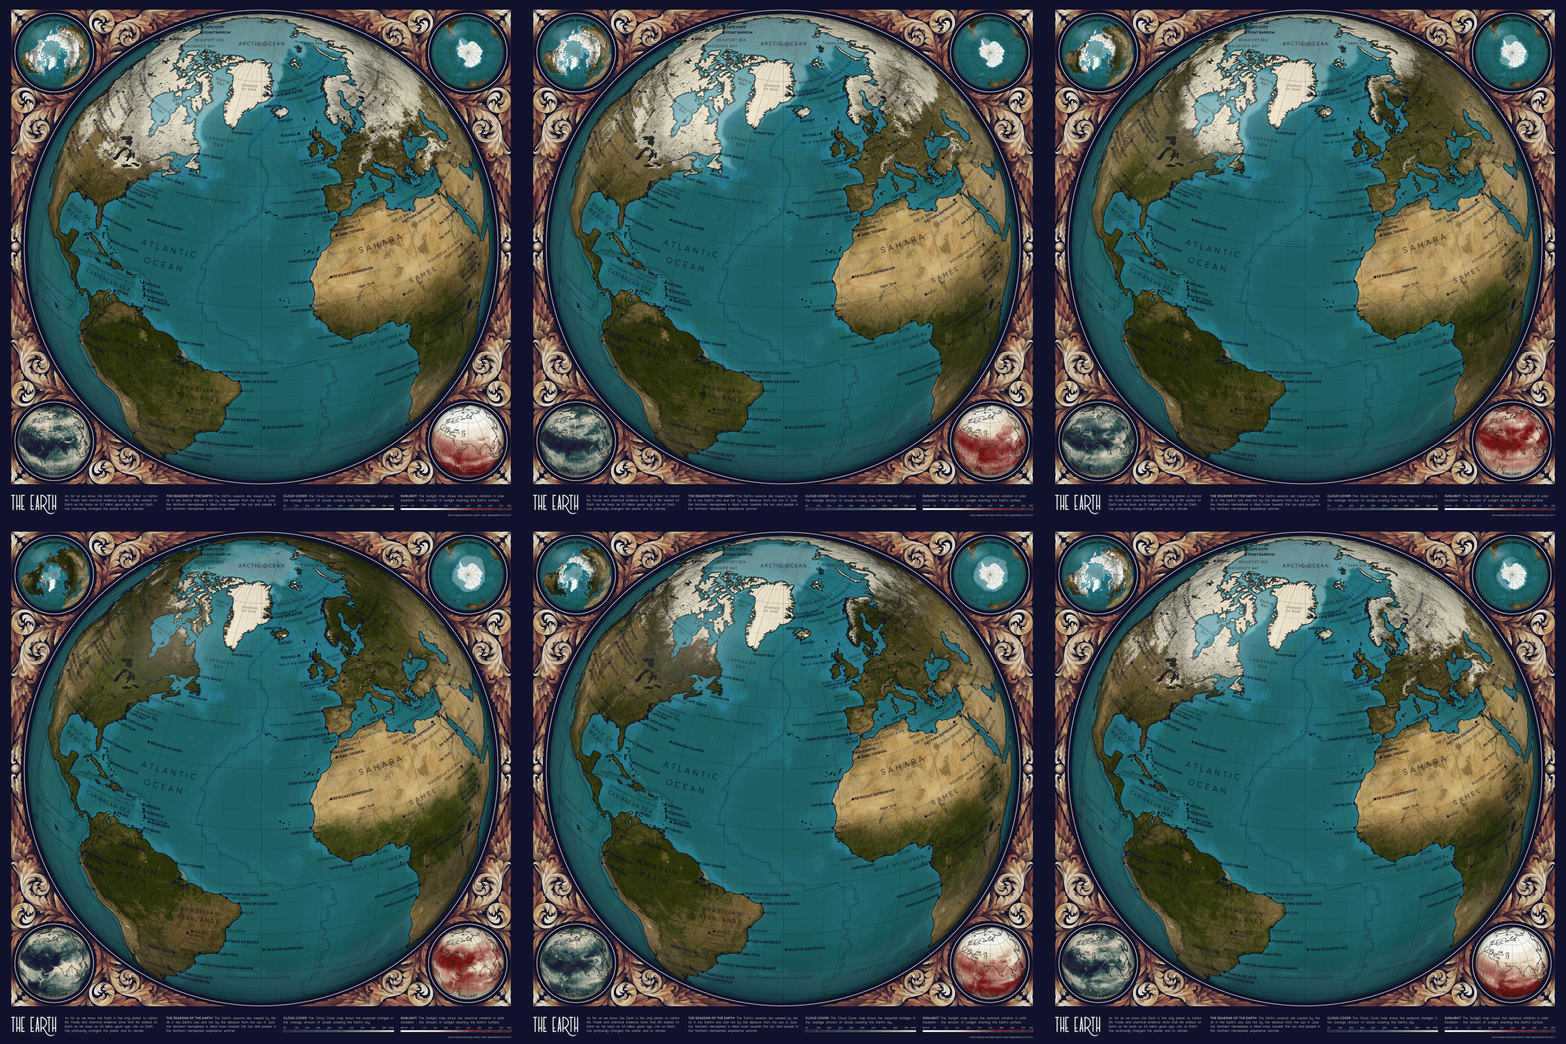
Illustration by Eleanor Lutz shows Earth’s seasonal climate changes. If played in full screen, the four corners present views from top, bottom and sides. It is a visual representation of scientific datasets measuring Arctic ice extents.


Arctic Ice Tops 12 Wadhams mid-December 2022

The animation shows the last two weeks of Arctic ice recovery from November 29 to December 13, 2022. On the lower far right, Hudson Bay starts this period at 550k km2 ice extent and grows to 1.2M km2 (from 44% to 96% of its maximum).  On the far left Sea of Okhotsk starts with 42k km2 and grows to 380k km2 of ice extent, now at 45% of its max last March. In the center Beaufort Sea reaches its max.

The graph below shows Mid December daily ice extents for 2022 compared to 16 year averages, and some years of note. As of yesterday, Arctic ice extent topped 12 Wadhams, or 12M km2.

The black line shows so far during this period  on average Arctic ice extents increased ~1.0M km2, while 2022 (cyan line) started December 200k km2 in deficit, reaching then holding a surplus to average for the last six days.  The Sea Ice Index in orange (SII from NOAA) lagged MASIE this month, but also topped 12M km2 on day 247.  Both 2007 and 2020 had much lower extents early in December, making up most of the deficit later on.  

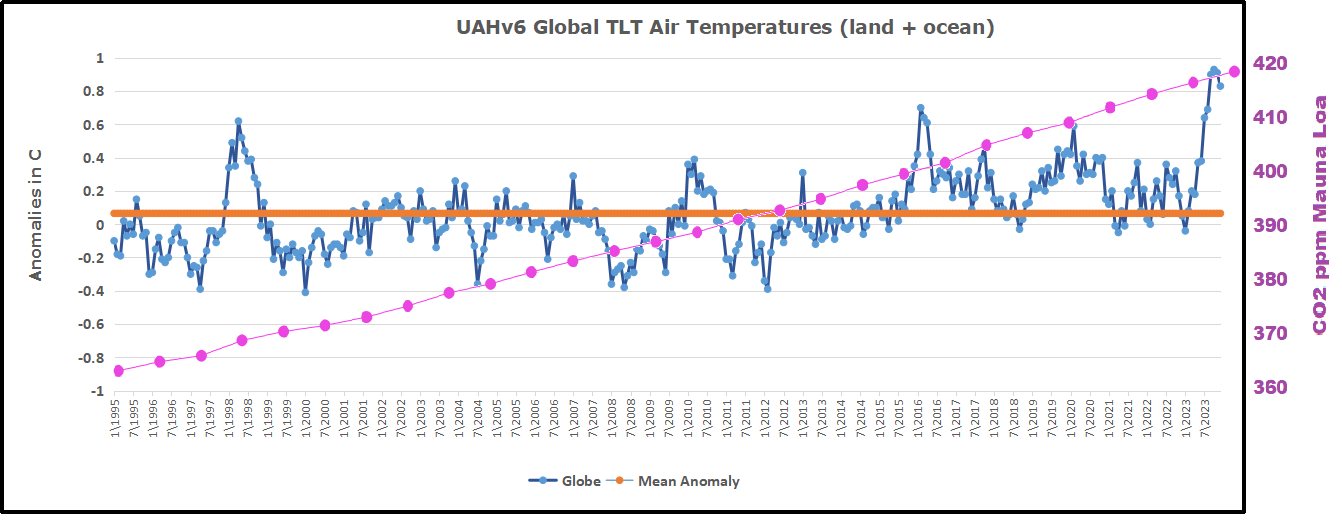
Why is this important?  All the claims of global climate emergency depend on dangerously higher temperatures, lower sea ice, and rising sea levels.  The lack of additional warming is documented in a post Still No Global Warming March 2022

The lack of acceleration in sea levels along coastlines has been discussed also.  See USCS Warnings of Coastal Flooding

Also, a longer term perspective is informative:

post-glacial_sea_levelThe table below shows the distribution of Sea Ice on day 347 across the Arctic Regions, on average, this year and 2007.

Region 2022347 Day 347 Average 2022-Ave. 2007347 2022-2007
 (0) Northern_Hemisphere 12151093 12003311  147782  11428288 722805 
 (1) Beaufort_Sea 1070966 1069874  1092  1062676 8290 
 (2) Chukchi_Sea 895943 906386  -10443  677993 217949 
 (3) East_Siberian_Sea 1087137 1085009  2129  1053584 33553 
 (4) Laptev_Sea 897845 897835  10  897845
 (5) Kara_Sea 801884 845212  -43328  800920 964 
 (6) Barents_Sea 221598 331366  -109768  236964 -15366 
 (7) Greenland_Sea 587354 544864  42489  488595 98758 
 (8) Baffin_Bay_Gulf_of_St._Lawrence 792277 806543  -14266  782889 9388 
 (9) Canadian_Archipelago 854843 853331  1512  852556 2286 
 (10) Hudson_Bay 1203872 1046825  157047  1209339 -5467 
 (11) Central_Arctic 3214028 3204979  9049  3186190 27837 
 (12) Bering_Sea 119070 225887 -106817  54836 64234 
 (13) Baltic_Sea 11482 9900  1582  2898 8584 
 (14) Sea_of_Okhotsk 379132 166880  212251  119667 259464 

The overall surplus to average is 148k km2, (2%).  Main deficits in Bering and Barents seas are more than offset by surpluses elsewhere, especially Okhotsk and Hudson Bay. 2022 ice extent exceeds that of 2007 by 3/4 Wadham, most of the difference being in Chukchi and Okhotsk.

bathymetric_map_arctic_ocean

Illustration by Eleanor Lutz shows Earth’s seasonal climate changes. If played in full screen, the four corners present views from top, bottom and sides. It is a visual representation of scientific datasets measuring Arctic ice extents.

Fear Not! Arctic Ice Tops 10 Wadhams in November 2022

Arctic Ice Roaring Back Following Halloween

The animation shows Arctic ice recovery from October 10 to October 31, 2022. On the lower center right, Canadian Arctic Archipelago (CAA) freezes over entirely more than doubling up to 832k km2, 97% of its maximum.  Center bottom Beaufort Sea closes off the NW passage, reaching 1 Wadham in just that basin, 95% of its max.  On the left, the Russian shelf seas fill with ice, closing off the Northern Sea Route.  Laptev and East Siberian seas reached 100% of their maxes, together adding 2 Wadhams of ice extent.

The graph below shows Mid November daily ice extents for 2022 compared to 16 year averages, and some years of note. As of yesterday, Arctic ice extent tops 10 Wadhams, or 10M km2.

The black line shows during this period on average Arctic ice extents increase ~3.5M km2 from ~6.4M km2 up to ~9.9M km2.  The 2022 cyan MASIE line started the month 90k km2 above average and on day 320 increased its surplus to 200k km2.  The Sea Ice Index in orange (SII from NOAA) tracked MASIE the entire month with slightly lower extents. 2007 started with an 700k km2 deficit, but ended virtually average. 2020 had the lowest extent in the record, starting 1.1M km2 down and ending 600k km2 in deficit.

Why is this important?  All the claims of global climate emergency depend on dangerously higher temperatures, lower sea ice, and rising sea levels.  The lack of additional warming is documented in a post Still No Global Warming March 2022

The lack of acceleration in sea levels along coastlines has been discussed also.  See USCS Warnings of Coastal Flooding

Also, a longer term perspective is informative:

post-glacial_sea_levelThe table below shows the distribution of Sea Ice on day 320 across the Arctic Regions, on average, this year and 2007.

Region 2022320 Day 320 Average 2022-Ave. 2007320 2022-2007
 (0) Northern_Hemisphere 10072814 9872802 200012 9824193 248621
 (1) Beaufort_Sea 1051741 1065159 -13418 1059182 -7441
 (2) Chukchi_Sea 606810 653669 -46859 519486 87324
 (3) East_Siberian_Sea 1087137 1077200 9937 1055581 31557
 (4) Laptev_Sea 897845 897567 278 897845 0
 (5) Kara_Sea 716470 671740 44729 774297 -57827
 (6) Barents_Sea 121787 166029 -44242 149482 -27695
 (7) Greenland_Sea 463580 470580 -7000 533946 -70365
 (8) Baffin_Bay_Gulf_of_St._Lawrence 693335 527100 166236 545899 147437
 (9) Canadian_Archipelago 854843 851090 3753 852539 2304
 (10) Hudson_Bay 315416 250421 64995 244531 70885
 (11) Central_Arctic 3178409 3176760 1649 3163043 15366

The overall surplus to average is 200k km2, (2%).  Small deficits in Chukchi and Barents seas are more than offset by surpluses elsewhere, especially Baffin and Hudson Bays and Kara sea. 2022 ice extent exceeds that of 2007 by 1/4 Wadham, most of the difference being in Chukchi and Baffin Bay.

bathymetric_map_arctic_ocean

Illustration by Eleanor Lutz shows Earth’s seasonal climate changes. If played in full screen, the four corners present views from top, bottom and sides. It is a visual representation of scientific datasets measuring Arctic ice extents.

Arctic Ice Roars Back October 2022

Arctic Halloween Ice Roaring Back


The animation shows the last 3 weeks of Arctic ice recovery, from October 10 to October 31, 2022. On the lower center right, Canadian Arctic Archipelago (CAA) freezes over entirely more than doubling up to 832k km2, 97% of its maximum.  Center bottom Beaufort Sea closes off the NW passage, reaching 1 Wadham in just that basin, 95% of its max.  On the left, the Russian shelf seas fill with ice, closing off the Northern Sea Route.  Laptev and East Siberian seas reached 100% of their maxes, together adding 2 Wadhams of ice extent.

The graph below shows October daily ice extents for 2022 compared to 16 year averages, and some years of note.

The black line shows during October on average Arctic ice extents increase ~3.4M km2 from ~5.0M km2 up to ~8.4M km2.  The 2022 cyan MASIE line started the month 145k km2 above average and on day 304 increased its surplus to 327k km2.  The Sea Ice Index in orange (SII from NOAA) tracked MASIE the entire month with slightly lower extents. 2007 started October with an 800k km2 deficit, but ended just 200k km2 below average. 2020 had the lowest extent in the record, ending October 1.76M km2 in deficit.

Why is this important?  All the claims of global climate emergency depend on dangerously higher temperatures, lower sea ice, and rising sea levels.  The lack of additional warming is documented in a post Still No Global Warming March 2022

The lack of acceleration in sea levels along coastlines has been discussed also.  See USCS Warnings of Coastal Flooding

Also, a longer term perspective is informative:

post-glacial_sea_levelThe table below shows the distribution of Sea Ice on day 304 across the Arctic Regions, on average, this year and 2007.

Region 2022304 Day 304 Average 2022-Ave. 2007304 2022-2007
 (0) Northern_Hemisphere 8707579 8404827 302753 8175072 532507
 (1) Beaufort_Sea 1017033 953449 63585 1038126 -21093
 (2) Chukchi_Sea 460109 454653 5456 242685 217425
 (3) East_Siberian_Sea 1085823 927639 158184 835071 250751
 (4) Laptev_Sea 897737 839256 58481 887789 9947
 (5) Kara_Sea 390948 478957 -88009 311960 78988
 (6) Barents_Sea 38855 86254 -47399 52823 -13968
 (7) Greenland_Sea 430536 411663 18872 443559 -13023
 (8) Baffin_Bay_Gulf_of_St._Lawrence 378895 248578 130317 289374 89522
 (9) Canadian_Archipelago 832064 758077 73987 817220 14844
 (10) Hudson_Bay 21011 72517 -51507 48845 -27835
 (11) Central_Arctic 3130729 3162928 -32199 3206345 -75616

The overall surplus to average is 303k km2, (4%).  Note large surpluses of ice in Beaufort and East Siberian seas,  as well as in Laptev, CAA and Baffin Bay. The main deficits to average are in Kara, Barents and Hudson Bay, more than offset by surpluses elsewhere. Note that 2022 ice extent exceeds that of 2007 by more than half a Wadham, most of the difference being in Chukchi, East Siberian, Kara and Baffin Bay.

bathymetric_map_arctic_ocean

Illustration by Eleanor Lutz shows Earth’s seasonal climate changes. If played in full screen, the four corners present views from top, bottom and sides. It is a visual representation of scientific datasets measuring Arctic ice extents.

16 yr. Plateau September Arctic Ice 2022

September daily extents are now fully reported and the 2022 September monthly results can be compared with those of the previous 15 years.  MASIE showed 2022 at 5.1M km2  and SII was close behind, reaching 4.9M for the month.  Analysis below shows that the 2022 Minimum was ~ 300k km2 higher than the 15 year average, and on day 273, this year was 1.2 Wadhams (1 M km2) more than 2007.  The 16 yr. trendlines are virtually flat and matching the averages for the period.

In June, 4.6M km2 was the median estimate for the September monthly average extent from the SIPN (Sea Ice Prediction Network) who use the reports from SII (Sea Ice Index), the NASA team satellite product from passive microwave sensors. The SII actual ice extent was 300k km2 higher than estimated.

The graph below shows September comparisons through day 273 (Sept. 30).

Note that MASIE was higher than average throughout September, with a brief minimum slightly after day 260, before increasing the surplus in the last half. SII tracked much lower before rising close to MASIE at the end.  The other years, 2007 and 2020 were much lower than average. The animation below shows the ice extents for the last twelve days, depicting the ice recovery since day 261.

Note the ice in Canadian Arctic Archipelago (lower center) increasing rapidly, doubling from 175k km2 to 367k km2.

The table shows ice extents in the regions for 2022, 15 year averages and 2007 for day 273. Averages refer to 2007 through 2020 inclusive.

Region 2022273 Day 273 Average 2022-Ave. 2007273 2022-2007
 (0) Northern_Hemisphere 5259935 4969083 290853 4086883 1173053
 (1) Beaufort_Sea 652439 567821 84618 498743 153696
 (2) Chukchi_Sea 186014 219952 -33938 51 185963
 (3) East_Siberian_Sea 381043 309836 71207 311 380732
 (4) Laptev_Sea 228810 151002 77808 235245 -6434
 (5) Kara_Sea 29831 34778 -4947 15367 14464
 (6) Barents_Sea 217 15648 -15430 4851 -4633
 (7) Greenland_Sea 283444 238081 45364 353210 -69766
 (8) Baffin_Bay_Gulf_of_St._Lawrence 89205 53386 35819 42247 46957
 (9) Canadian_Archipelago 367175 392202 -25028 307135 60040
 (10) Hudson_Bay 0 3627 -3627 1936 -1936
 (11) Central_Arctic 3040615 2981627 58988 2626511 414104

The only deficits are small ones in Chukchi and CAA, more than offset by surpluses in Beaufort, Laptev, East Siberian and Greenland Seas, along with  Baffin and Central Arctic.   Overall, the NH ice extent is surplus by 290k km2 or 6% over 15 year average.

Summary

Earlier observations showed that Arctic ice extents were low in the 1940s, grew thereafter up to a peak in 1977, before declining.  That decline was gentle until 1996 which started a decade of multi-year ice loss through the Fram Strait.  There was also a major earthquake under the north pole in that period.  In any case, the effects and the decline ceased in 2007, 30 years after the previous peak.  Now we have a plateau in ice extents, which could be the precursor of a growing phase of the quasi-60 year Arctic ice oscillation.

Background 

A commenter previously asked, where do they get their data? The answer is primarily from NIC’s Interactive Multisensor Snow and Ice Mapping System (IMS). From the documentation, the multiple sources feeding IMS are:

Platform(s) AQUA, DMSP, DMSP 5D-3/F17, GOES-10, GOES-11, GOES-13, GOES-9, METEOSAT, MSG, MTSAT-1R, MTSAT-2, NOAA-14, NOAA-15, NOAA-16, NOAA-17, NOAA-18, NOAA-N, RADARSAT-2, SUOMI-NPP, TERRA

Sensor(s): AMSU-A, ATMS, AVHRR, GOES I-M IMAGER, MODIS, MTSAT 1R Imager, MTSAT 2 Imager, MVIRI, SAR, SEVIRI, SSM/I, SSMIS, VIIRS

Summary: IMS Daily Northern Hemisphere Snow and Ice Analysis

The National Oceanic and Atmospheric Administration / National Environmental Satellite, Data, and Information Service (NOAA/NESDIS) has an extensive history of monitoring snow and ice coverage.Accurate monitoring of global snow/ice cover is a key component in the study of climate and global change as well as daily weather forecasting.

The Polar and Geostationary Operational Environmental Satellite programs (POES/GOES) operated by NESDIS provide invaluable visible and infrared spectral data in support of these efforts. Clear-sky imagery from both the POES and the GOES sensors show snow/ice boundaries very well; however, the visible and infrared techniques may suffer from persistent cloud cover near the snowline, making observations difficult (Ramsay, 1995). The microwave products (DMSP and AMSR-E) are unobstructed by clouds and thus can be used as another observational platform in most regions. Synthetic Aperture Radar (SAR) imagery also provides all-weather, near daily capacities to discriminate sea and lake ice. With several other derived snow/ice products of varying accuracy, such as those from NCEP and the NWS NOHRSC, it is highly desirable for analysts to be able to interactively compare and contrast the products so that a more accurate composite map can be produced.

The Satellite Analysis Branch (SAB) of NESDIS first began generating Northern Hemisphere Weekly Snow and Ice Cover analysis charts derived from the visible satellite imagery in November, 1966. The spatial and temporal resolutions of the analysis (190 km and 7 days, respectively) remained unchanged for the product’s 33-year lifespan.

As a result of increasing customer needs and expectations, it was decided that an efficient, interactive workstation application should be constructed which would enable SAB to produce snow/ice analyses at a higher resolution and on a daily basis (~25 km / 1024 x 1024 grid and once per day) using a consolidated array of new as well as existing satellite and surface imagery products. The Daily Northern Hemisphere Snow and Ice Cover chart has been produced since February, 1997 by SAB meteorologists on the IMS.

Another large resolution improvement began in early 2004, when improved technology allowed the SAB to begin creation of a daily ~4 km (6144×6144) grid. At this time, both the ~4 km and ~24 km products are available from NSIDC with a slight delay. Near real-time gridded data is available in ASCII format by request.

In March 2008, the product was migrated from SAB to the National Ice Center (NIC) of NESDIS. The production system and methodology was preserved during the migration. Improved access to DMSP, SAR, and modeled data sources is expected as a short-term from the migration, with longer term plans of twice daily production, GRIB2 output format, a Southern Hemisphere analysis, and an expanded suite of integrated snow and ice variable on horizon.

http://www.natice.noaa.gov/ims/ims_1.html

Footnote

Some people unhappy with the higher amounts of ice extent shown by MASIE continue to claim that Sea Ice Index is the only dataset that can be used. This is false in fact and in logic. Why should anyone accept that the highest quality picture of ice day to day has no shelf life, that one year’s charts can not be compared with another year?

MASIE is rigorous, reliable, serves as calibration for satellite products, and continues the long and honorable tradition of naval ice charting using modern technologies. More on this at my post Support MASIE Arctic Ice Dataset


2022 Arctic Ice Abounds at Average Daily Minimum

The annual competition between ice and water in the Arctic ocean has reached the maximum for water, which typically occurs mid September.  After that, diminishing energy from the slowly setting sun allows oceanic cooling causing ice to regenerate. Those interested in the dynamics of Arctic sea ice can read numerous posts here.  This post provides a look at mid September from 2007 to yesterday as a context for understanding this year’s annual minimum.

The image above shows Arctic ice extents on day 260 (lowest annual daily extent on average) from 2007 to 2022 yesterday.  Obviously, the regions vary as locations for ice, discussed in more detail later on. The animation shows the ice deficits in years 2007, 2012, 2016 and 2020, as well as surplus years like 2010, 2014 and the last two years, 2021-2022.

Note that for climate purposes the annual minimum is measured by the September monthly average ice extent, since the daily extents vary and will go briefly lowest on or about day 260. In a typical year the overall ice extent will end September slightly higher than at the beginning. Remarkably 2022 September ice extent averaged 5.1M over the first 17 days, and is likely to end the month with at least that amount for the entire month. For comparison, the 15 year average for Sept. 1-17 is 4.7M.

The melting season mid August to mid September shows 2022 melted slower than average and ended the period above the average.

Firstly note that on average this period shows ice declining 1.24 M km2 down to 4.52M km2, the minimum average daily extent for the year.  But 2022 started 230k km2 higher, and on day 244 was 606k km2 above average, before ending on day 260 with a surplus of 212k km2   The extents in Sea Ice Index in orange  were mostly lower during the period. The table for day 260 shows how large are the 2022 surpluses and how the ice is distributed across the various seas comprising the Arctic Ocean.   The surplus this year over 2007 is nearly 0.7 of a Wadham (1M km2 ice extent). The surplus is ~5% above average.

Region 2022260 Day 260 Average 2022-Ave. 2007260 2022-2007
 (0) Northern_Hemisphere 4735485 4523606 211878 4045776 689709
 (1) Beaufort_Sea 551558 498415 53142 481384 70174
 (2) Chukchi_Sea 135794 171467 -35673 22527 113267
 (3) East_Siberian_Sea 305100 263291 41809 311 304789
 (4) Laptev_Sea 182035 119373 62662 235869 -53834
 (5) Kara_Sea 20413 31966 -11553 44067 -23654
 (6) Barents_Sea 326 16326 -15999 7420 -7094
 (7) Greenland_Sea 249159 184219 64940 333181 -84022
 (8) Baffin_Bay_Gulf_of_St._Lawrence 24537 29138 -4601 26703 -2165
 (9) Canadian_Archipelago 185541 285070 -99529 225526 -39984
 (10) Hudson_Bay 0 5149 -5149 2270 -2270
 (11) Central_Arctic 3080350 2918177 162173 2665244 415107

The main deficit to average is in CAA with a smaller loss in Chukchi, overcome by surpluses almost everywhere, especially in Central Arctic along with Laptev and Greenland seas. And as discussed below, the marginal basins have little ice left to lose.

The Bigger Picture 

We are close to the annual Arctic ice extent minimum, which typically occurs on or about day 260 (mid September). Some take any year’s slightly lower minimum as proof that Arctic ice is dying, but the image above shows the Arctic heart is beating clear and strong.

Over this decade, the Arctic ice minimum has not declined, but since 2007 looks like fluctuations around a plateau. By mid-September, all the peripheral seas have turned to water, and the residual ice shows up in a few places. The table below indicates where we can expect to find ice this September. Numbers are area units of Mkm2 (millions of square kilometers).

Day 260 15 year
Arctic Regions 2007 2010 2012 2014 2017 2019 2020 2021 Average 2022
Central Arctic Sea 2.67 3.16 2.64 2.98 3.07 2.97 2.50 2.95 2.90 3.08
BCE 0.50 1.08 0.31 1.38 0.84 0.46 0.65 1.55 0.89 0.99
LKB 0.29 0.24 0.02 0.19 0.26 0.11 0.01 0.13 0.16 0.20
Greenland & CAA 0.56 0.41 0.41 0.55 0.52 0.36 0.59 0.50 0.46 0.43
B&H Bays 0.03 0.03 0.02 0.02 0.07 0.01 0.02 0.04 0.04 0.02
NH Total 4.05 4.91 3.40 5.13 4.76 3.91 3.77 5.17 4.48 4.73

The table includes some early years of note along with the last 4 years compared to the 15 year average for five contiguous arctic regions. BCE (Beaufort, Chukchi and East Siberian) on the Asian side are quite variable as the largest source of ice other than the Central Arctic itself.   Greenland Sea and CAA (Canadian Arctic Archipelago) together hold almost 0.5M km2 of ice at annual minimum, fairly consistently.  LKB are the European seas of Laptev, Kara and Barents, a smaller source of ice, but a difference maker some years, as Laptev was in 2016.  Baffin and Hudson Bays are inconsequential as of day 260.

2022 extent of 4.73 is 5% over average, mainly due to surpluses in Central Arctic and BCE

For context, note that the average maximum has been 15M, so on average the extent shrinks to 30% of the March high (31% in 2022) before growing back the following winter.  In this context, it is foolhardy to project any summer minimum forward to proclaim the end of Arctic ice.

Resources:  Climate Compilation II Arctic Sea Ice