August Arctic Ice Results
Update September 1, 2018
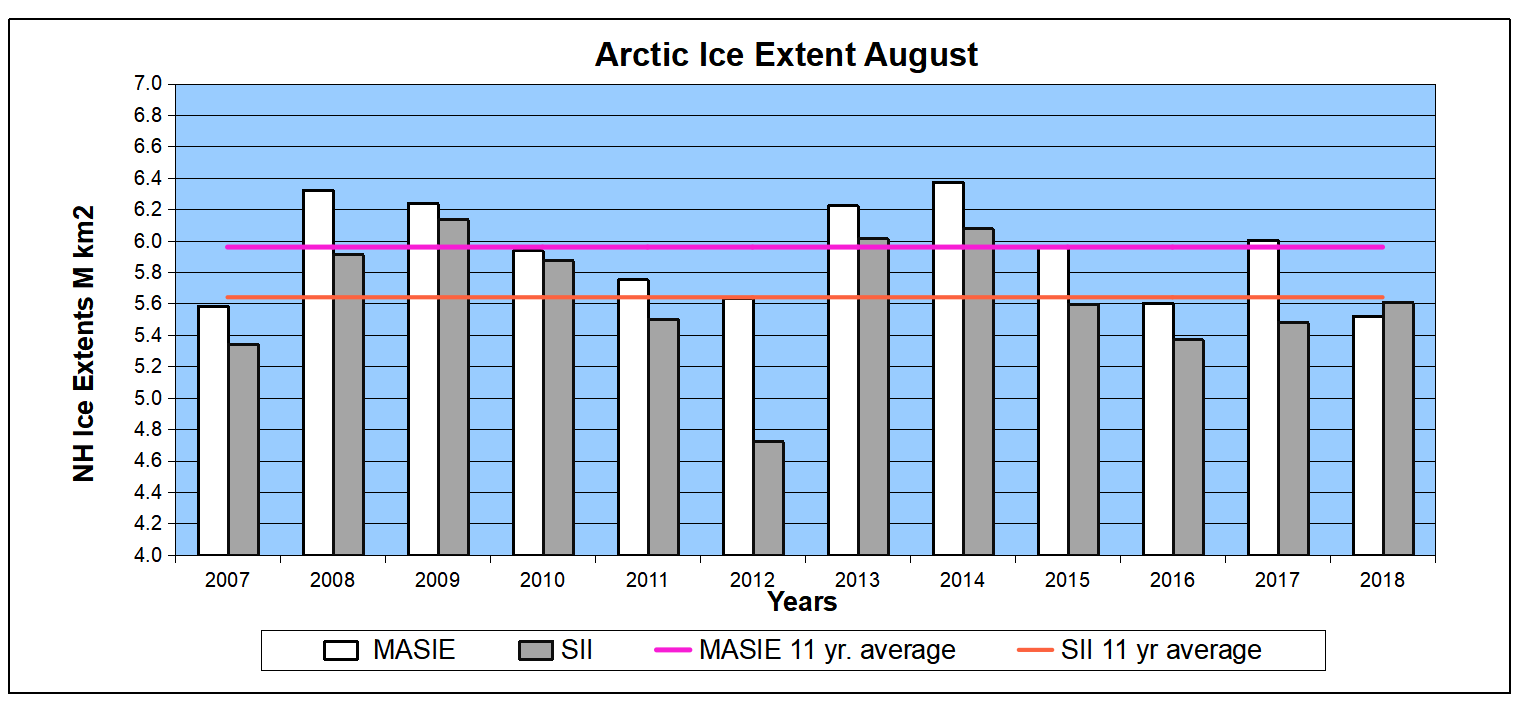
The graph above now contains the complete data for August, replacing a previous provisional one. These results confirm the depiction of what has happened. July was a surprise with both MASIE and SII showing a monthly surplus to the 11-year average. August ice decline in MASIE was large with 2018 coming in 400k km2 below 11 year average. Meanwhile SII which most years was lower than MASIE (note 2012) this year shows a greater extent and matches SII 11 year average. Note also that both indices are close to 2007 monthly ice extent. (MASIE is described in more detail below; SII refers to NOAA’s Sea Ice Index)
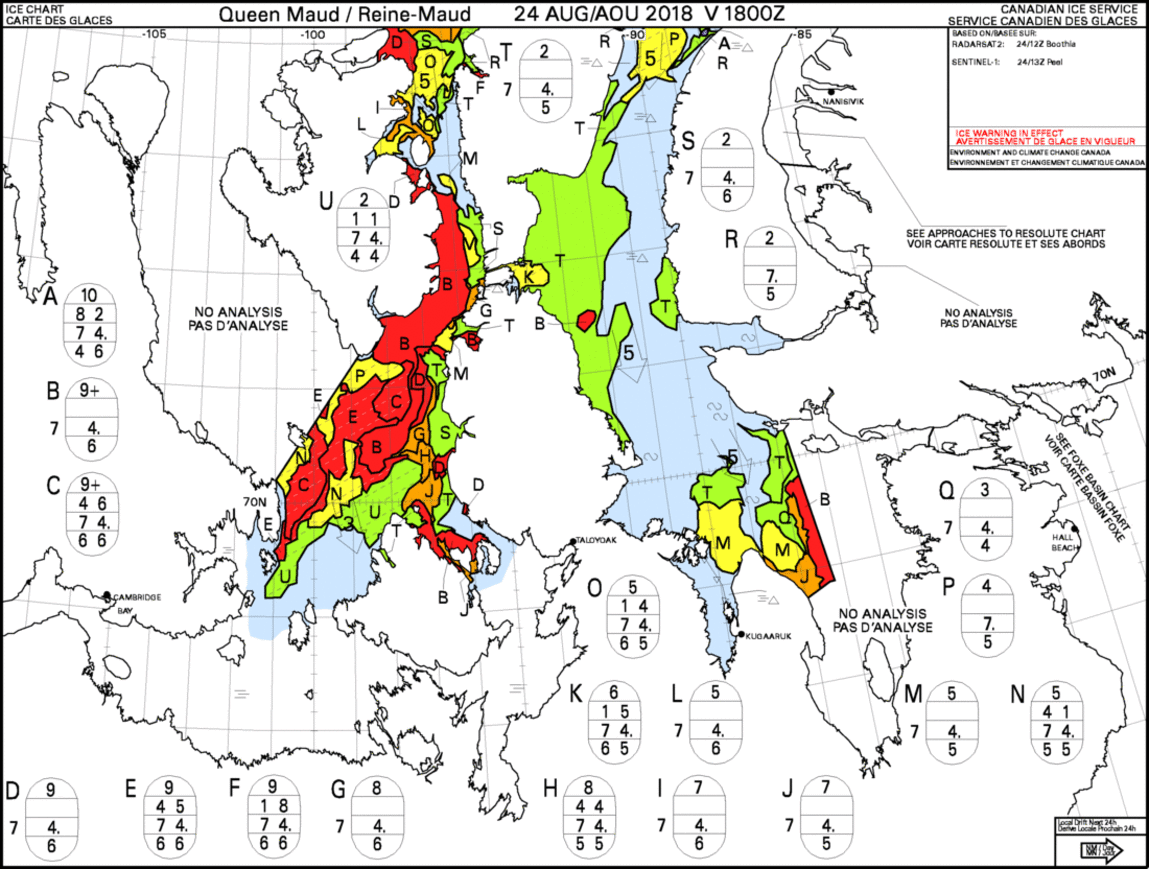
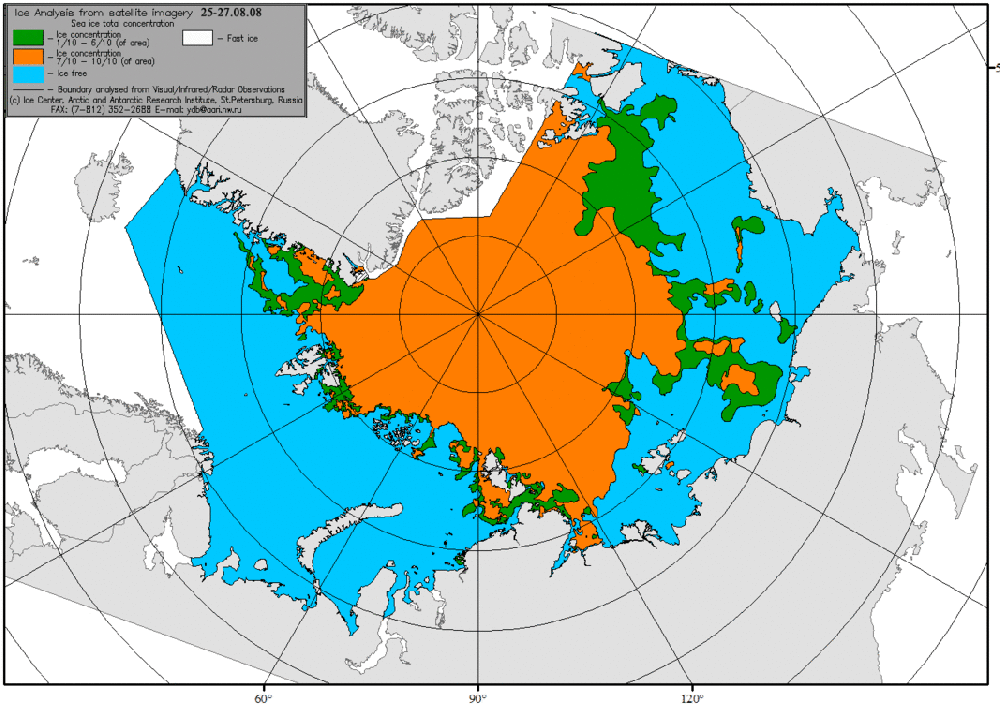 The image above shows end of August ice charts from AARI (St. Petersburg, Russia) from 2009 to 2018. The legend identifies the thicker, multi-year ice in brown, and extents less than 7/10 in green. 2018 compares to other recent years as showing less ice on the European side, a surplus in East Siberian basin, and thick ice on the CanAm side. Some alarmists pointed to a bit of green showing at the northern tip of Greenland, but that also appeared in 2011.

Interesting September outlook from AER
Dr. Judah Cohen published his Arctic Oscillation and Polar Vortex Analysis and Forecast as of August 27, 2018. Excerpts in italics with my bolds.
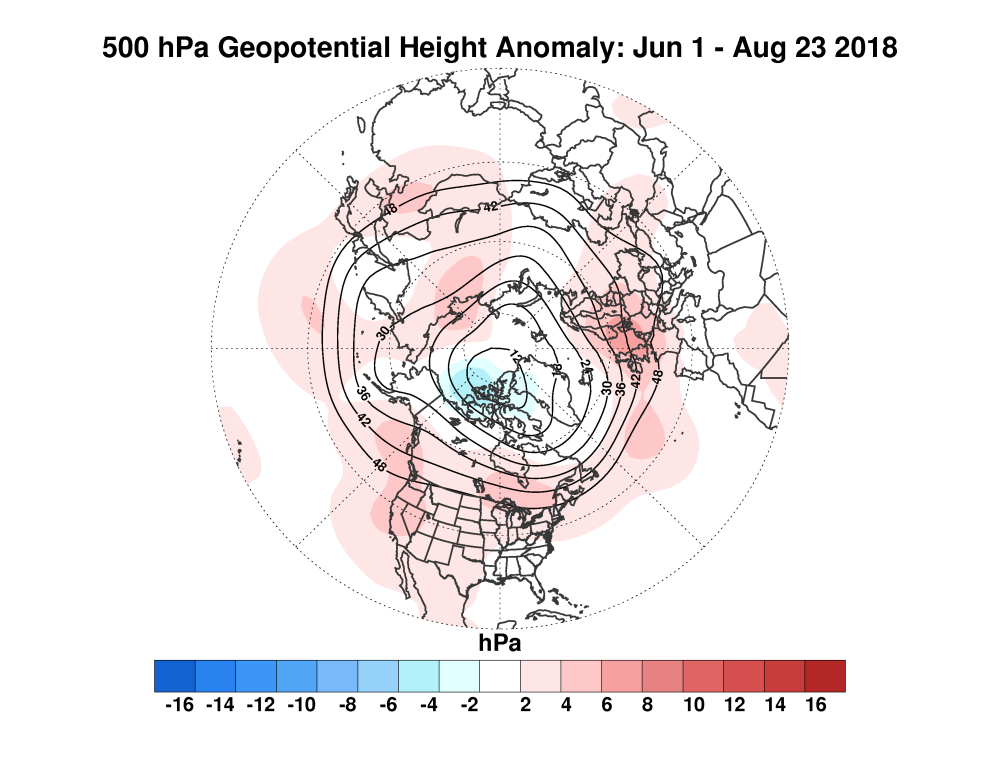
Looking at the 500 mb geopotential height pattern of this summer in Figure i, reveals a fairly striking pattern – an anulus of high anomalous geopotential heights encircling the midlatitudes and low anomalous heights centered on the Canadian side of the Arctic. The name of this blog is the Arctic Oscillation (and Polar Vortex) and the AO is also known as the northern annular mode (NAM). I don’t often use the term annular mode because at least in the troposphere you don’t usually observe an annular or donut like anomaly pattern, at least in my opinion. But this summer is an exception and that tropospheric height pattern looks remarkably annular, a phenomenon usually reserved for the stratosphere where topography and land-ocean contrasts are absent.

Figure i. Observed 500 mb geopotentail heights (contours) and anomalies (shading) for June 1 – August 23, 2018. Data is from NCEP/NCAR reanalysis NCEP-NCAR data.
Such an annular pattern favors above normal temperatures to be omnipresent across the mid-latitudes as the Jet Stream is forced to retreat poleward and allowing subtropical heat to overspread the mid-latitudes. This is not meant to be a discussion on climate change but I will just note that the poleward retreat of the Jet Stream, the northward expansion of the subtropical ridging into the mid-latitudes accompanied by heat and drought are projected to be consequences of climate change.
But the mid-latitudes gain was the Arctic’s loss in that though the pattern pumped heat across the mid-latitudes the annular structure in the geopotential heights protected the Arctic ocean from incursions of warm, moist air masses from the south and insulated the Arctic ocean and sea ice from excessive melt. This included Greenland, where melting was close to average. So even though sea ice extent was at record lows this past winter a new Arctic sea ice minimum will very likely not be achieved this September. The Arctic sea ice is on pace to be close to last year and above those minima observed in 2015 and 2016. The record Arctic sea ice minima was observed in 2012.
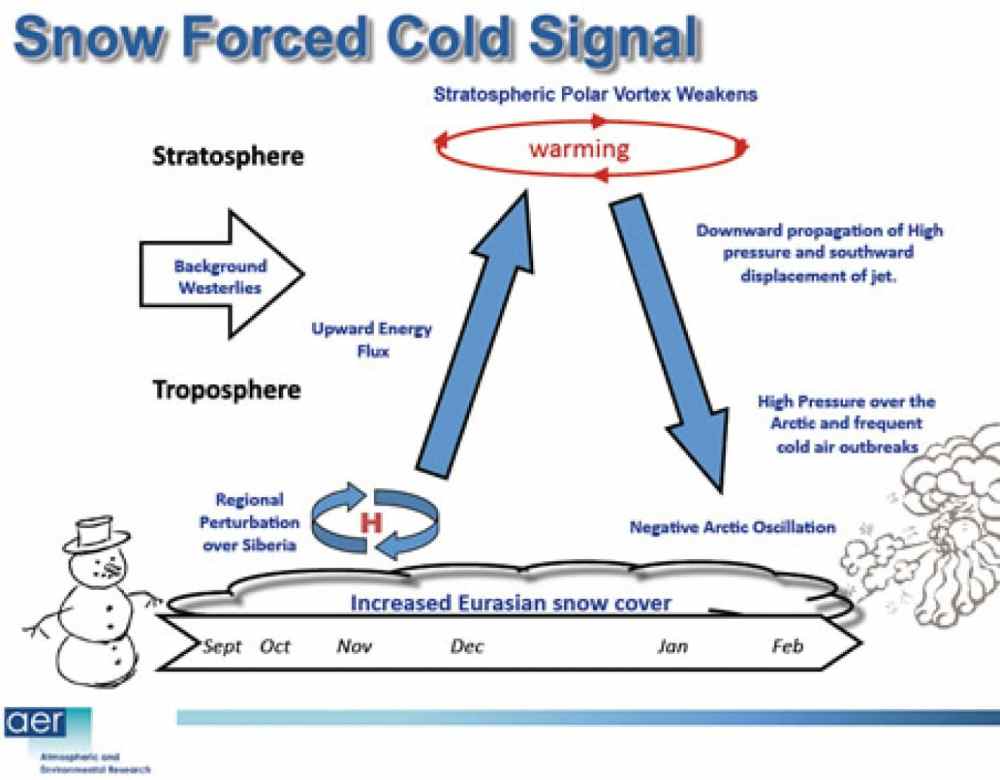
I don’t expect any notable deviation from the recent decadal fall temperature trends. One region that has experienced a cooling trend in contrast to the nearly universal warming is Siberia. I believe this in part due to the increasing trend in October snow cover extent across Eurasia. It will be interesting to see if this trend pattern repeats in 2018. And as I am sure many of you know this will be the focus of my attention in the coming weeks. Finally as the atmosphere cools more rapidly than the ocean I do expect to the heat transfer in the Arctic to reverse from into the ocean to out of the ocean. This could finally end the near perfect annular pattern of the Northern Hemisphere.
Footnote on MASIE Data Sources:
MASIE reports are based on data primarily from NIC’s Interactive Multisensor Snow and Ice Mapping System (IMS). From the documentation, the multiple sources feeding IMS are:
Platform(s) AQUA, DMSP, DMSP 5D-3/F17, GOES-10, GOES-11, GOES-13, GOES-9, METEOSAT, MSG, MTSAT-1R, MTSAT-2, NOAA-14, NOAA-15, NOAA-16, NOAA-17, NOAA-18, NOAA-N, RADARSAT-2, SUOMI-NPP, TERRA
Sensor(s): AMSU-A, ATMS, AVHRR, GOES I-M IMAGER, MODIS, MTSAT 1R Imager, MTSAT 2 Imager, MVIRI, SAR, SEVIRI, SSM/I, SSMIS, VIIRS

GOES-R (Geostationary Operational Environmental Satellite) | AER | Weather Risk Assessment
Summary: IMS Daily Northern Hemisphere Snow and Ice Analysis
The National Oceanic and Atmospheric Administration / National Environmental Satellite, Data, and Information Service (NOAA/NESDIS) has an extensive history of monitoring snow and ice coverage.Accurate monitoring of global snow/ice cover is a key component in the study of climate and global change as well as daily weather forecasting.
The Polar and Geostationary Operational Environmental Satellite programs (POES/GOES) operated by NESDIS provide invaluable visible and infrared spectral data in support of these efforts. Clear-sky imagery from both the POES and the GOES sensors show snow/ice boundaries very well; however, the visible and infrared techniques may suffer from persistent cloud cover near the snowline, making observations difficult (Ramsay, 1995). The microwave products (DMSP and AMSR-E) are unobstructed by clouds and thus can be used as another observational platform in most regions. Synthetic Aperture Radar (SAR) imagery also provides all-weather, near daily capacities to discriminate sea and lake ice. With several other derived snow/ice products of varying accuracy, such as those from NCEP and the NWS NOHRSC, it is highly desirable for analysts to be able to interactively compare and contrast the products so that a more accurate composite map can be produced.
The Satellite Analysis Branch (SAB) of NESDIS first began generating Northern Hemisphere Weekly Snow and Ice Cover analysis charts derived from the visible satellite imagery in November, 1966. The spatial and temporal resolutions of the analysis (190 km and 7 days, respectively) remained unchanged for the product’s 33-year lifespan.
As a result of increasing customer needs and expectations, it was decided that an efficient, interactive workstation application should be constructed which would enable SAB to produce snow/ice analyses at a higher resolution and on a daily basis (~25 km / 1024 x 1024 grid and once per day) using a consolidated array of new as well as existing satellite and surface imagery products. The Daily Northern Hemisphere Snow and Ice Cover chart has been produced since February, 1997 by SAB meteorologists on the IMS.
Another large resolution improvement began in early 2004, when improved technology allowed the SAB to begin creation of a daily ~4 km (6144×6144) grid. At this time, both the ~4 km and ~24 km products are available from NSIDC with a slight delay. Near real-time gridded data is available in ASCII format by request.
In March 2008, the product was migrated from SAB to the National Ice Center (NIC) of NESDIS. The production system and methodology was preserved during the migration. Improved access to DMSP, SAR, and modeled data sources is expected as a short-term from the migration, with longer term plans of twice daily production, GRIB2 output format, a Southern Hemisphere analysis, and an expanded suite of integrated snow and ice variable on horizon. Source: Interactive Multisensor Snow and Ice Mapping System (IMS)


 Others think it means: It is real that using fossil fuels causes global warming. This too lacks persuasive evidence.
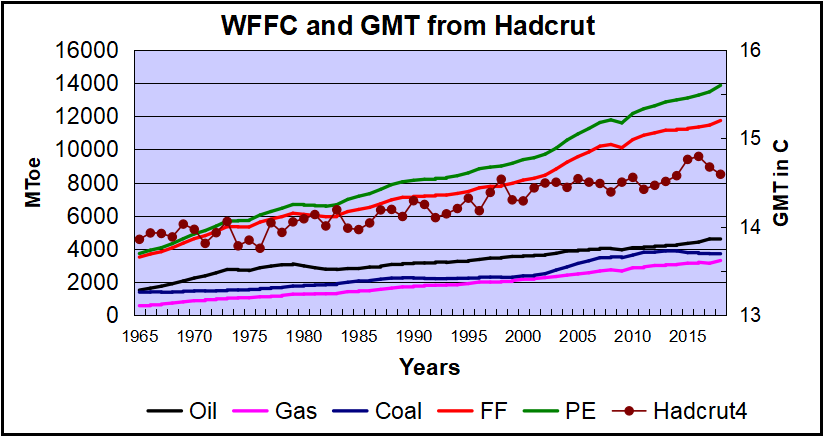 Over the last five decades the increase in fossil fuel consumption is dramatic and monotonic, steadily increasing by 234% from 3.5B to 11.7B oil equivalent tons. Meanwhile the GMT record from Hadcrut shows multiple ups and downs with an accumulated rise of 0.74C over 53 years, 5% of the starting value.
 Conclusion