CAMBRIDGE, MA — President Biden announced plans today to forgive $10,000 in student loan debt for anyone making less than $125k per year. In completely unrelated news, the nation’s colleges and universities announced plans to immediately raise tuition by $10,000.
“Look, Jack! Here’s the deal! No malarkey at all! Not a joke!” said Biden before an aide had to step in and explain he was signing an order to forgive student loan debt.
Dr. Charles Moneybags, director of the National Association for the Advancement Of College Professors (NAACP), said he applauds the president’s decision to cancel student debt for so many borrowers. “We’re very excited that a college education will be more affordable for the next generation of art history majors,” he said.
Moneybags then went on to explain why immediate tuition increases were necessary. “Due to an unfortunate concurrence of high inflation, global warming, and, uh, the upcoming solar eclipse in 2024, we’ve all had to raise our tuition by $10k,” he noted. “Plus, we’ve had to spend a ton of money building safe spaces and bathrooms for all the new genders.“
Shelia Johnson, a 45-year-old Harvard student working on her ninth degree, said she is excited for her loans to be forgiven, but worries about the ever-increasing cost of education. “I’m nervous that I might need to leave school one day to get a job and start paying my loans,” she said. “Hopefully President Kamala Harris can find a way to solve this problem.”
At publishing time, Moneybags had invited the press corps to his summer home in the Hamptons to show off the new helipad he had installed next to his swimming pool.
It being August and end of the Greenland Ice Sheet melting season, the media is replete with warnings about how the Greenland glacier is melting and will flood the coastlines with a foot or more of sea level rise. For Example:
Study: Greenland ice melt will raise sea levels by nearly a foot Axios
Greenland ice sheet losing ice faster than forecast, now irreversibly committed to at least 10 inches of sea level rise Phys.org
Melting Greenland ice sheet will raise seas by nearly a foot USA Today
Melting of Greenland Ice Sheet Poised to Trigger Almost a Foot of Sea Level Rise Common Dreams
Greenland’s Melting Ice Sheet Has ‘Passed The Point of No Return’, Scientists Say science alert
The scare du jour is about Greenland Ice Sheet (GIS) and how it will melt out and flood us all. It’s declared that GIS has passed its tipping point, and we are doomed. Typical is the Boston.com hysteria: Zombie ice from Greenland will raise sea level 10 inchesExcerpts in italics with my bolds.
Greenland’s rapidly melting ice sheet will eventually raise global sea level by at least 10.6 inches (27 centimeters) — more than twice as much as previously forecast — according to a study published Monday.
That’s because of something that could be called zombie ice. That’s doomed ice that, while still attached to thicker areas of ice, is no longer getting replenished by parent glaciers now receiving less snow. Without replenishment, the doomed ice is melting from climate change and will inevitably raise seas, said study co-author William Colgan, a glaciologist at the Geological Survey of Denmark and Greenland.
“It’s dead ice. It’s just going to melt and disappear from the ice sheet,” Colgan said in an interview. “This ice has been consigned to the ocean, regardless of what climate (emissions) scenario we take now.”
One of the study authors said that more than 120 trillion tons (110 trillion metric tons) of ice is already doomed to melt from the warming ice sheet’s inability to replenish its edges. When that ice melts into water, if it were concentrated only over the United States, it would be 37 feet (11 meters) deep.
Study lead author Jason Box, a glaciologist at the Greenland survey, said it is “more like one foot in the grave.”
Time is the key unknown here and a bit of a problem with the study, said two outside ice scientists, Leigh Stearns of the University of Kansas and Sophie Nowicki of the University of Buffalo. The researchers in the study said they couldn’t estimate the timing of the committed melting, yet in the last sentence they mention, “within this century,” without supporting it, Stearns said.
Annual Greenland Fluctuations in Perspective
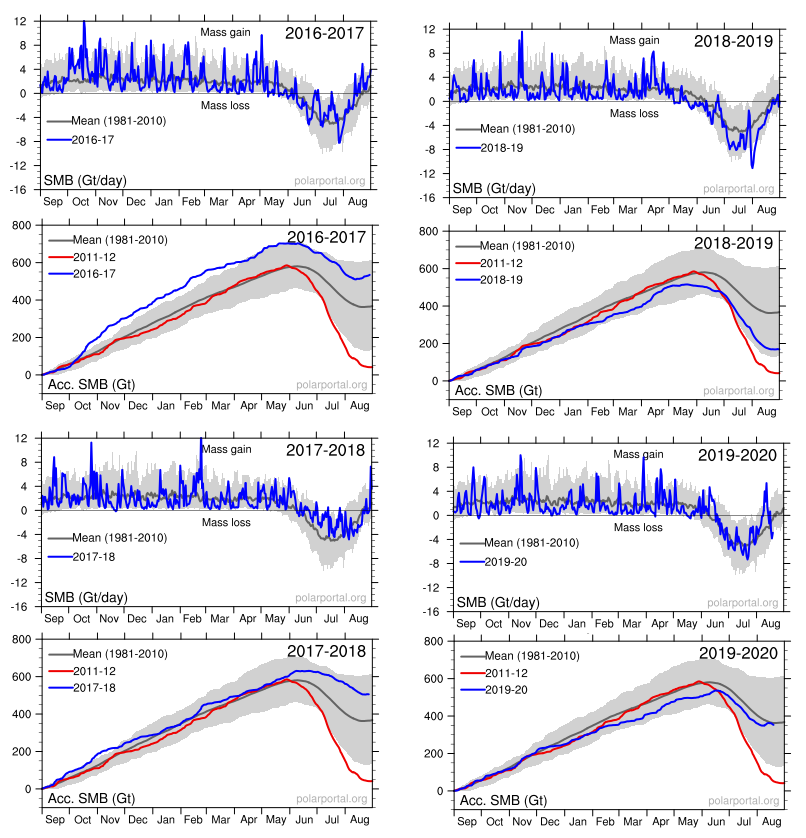
Panic is warranted only if you treat this as proof of an alarmist narrative and ignore the facts and context in which natural variation occurs. For starters, consider the last six years of GIS fluctuations reported by DMI and summarized in the twelve graphs below. Note the noisy blue lines showing how the surface mass balance (SMB) changes its daily weight by 8 or 10 gigatonnes (Gt) around the baseline mean from 1981 to 2010. Note also the summer decrease between May and August each year before recovering to match or exceed the mean.
The other six graphs show the accumulation of SMB for each of the last six years including 2022. Tipping Point? Note that in both 2017 and 2018, SMB ended about 500 Gt higher than the year began, and way higher than 2012, which added nothing. Then came 2019 dropping below the mean, but still above 2012. Finally, both this and last year exceeded the 30-year average. Note also that the charts do not integrate from previous years; i.e. each year starts at zero and shows the accumulation only for that year. Thus the gains from 2017 and 2018 do not result in 2019 starting the year up 1000 Gt, but from zero. Nor will the gains in 2021 and 2022 be added to the base.
While they may appear solid, all ice sheets—which are essentially giant glaciers—experience movement: ice flows downslope either through the process of deformation or sliding. The latest results suggest that the movement of the ice on the GIS is dominated by sliding, not deformation. This process is moving ice to the marginal zones of the sheet, where melting occurs, at a much faster rate.
“The study was motivated by a major unknown in how the ice of Greenland moves from the cold interior, to the melting regions on the margins,” Neil Humphrey, a professor of geology from the University of Wyoming and author of the study, told Newsweek. “The ice is known to move both by sliding over the bedrock under the ice, and by oozing (deforming) like slowly flowing honey or molasses. What was unknown was the ratio between these two modes of motion—sliding or deforming.
“This lack of understanding makes predicting the future difficult, since we know how to calculate the flowing, but do not know much about sliding,” he said. “Although melt can occur anywhere in Greenland, the only place that significant melt can occur is in the low altitude margins. The center (high altitude) of the ice is too cold for the melt to contribute significant water to the oceans; that only occurs at the margins. Therefore ice has to get from where it snows in the interior to the margins.
“The implications for having high sliding along the margin of the ice sheet means that thinning or thickening along the margins due to changes in ice speed can occur much more rapidly than previously thought,” Maier said. “This is really important; as when the ice sheet thins or thickens it will either increase the rate of melting or alternatively become more resilient in a changing climate.“
“There has been some debate as to whether ice flow along the edges of Greenland should be considered mostly deformation or mostly sliding,” Maier says. “This has to do with uncertainty of trying to calculate deformation motion using surface measurements alone. Our direct measurements of sliding- dominated motion, along with sliding measurements made by other research teams in Greenland, make a pretty compelling argument that no matter where you go along the edges of Greenland, you are likely to have a lot of sliding.”
The sliding ice does two things, Humphrey says. First, it allows the ice to slide into the ocean and make icebergs, which then float away. Two, the ice slides into lower, warmer climate, where it can melt faster.
While it may sound dire, Humphrey notes the entire Greenland Ice Sheet is 5,000 to 10,000 feet thick.
“In a really big melt year, the ice sheet might melt a few feet. It means Greenland is going to be there another 10,000 years,” Humphrey says. “So, it’s not the catastrophe the media is overhyping.”
Humphrey has been working in Greenland for the past 30 years and says the Greenland Ice Sheet has only melted 10 feet during that time span.
Summary
The Greenland ice sheet is more than 1.2 miles thick in most regions. If all of its ice was to melt, global sea levels could be expected to rise by about 25 feet. However, this would take more than 10,000 years at the current rates of melting.
Background from Previous Post: Greenland Glaciers: History vs. Hysteria
The modern pattern of environmental scares started with Rachel Carson’s Silent Spring claiming chemicals are killing birds, only today it is windmills doing the carnage. That was followed by ever expanding doomsday scenarios, from DDT, to SST, to CFC, and now the most glorious of them all, CO2. In all cases the menace was placed in remote areas difficult for objective observers to verify or contradict. From the wilderness bird sanctuaries, the scares are now hiding in the stratosphere and more recently in the Arctic and Antarctic polar deserts. See Progressively Scaring the World (Lewin book synopsis)
The advantage of course is that no one can challenge the claims with facts on the ground, or on the ice. Correction: Scratch “no one”, because the climate faithful are the exception. Highly motivated to go to the ends of the earth, they will look through their alarmist glasses and bring back the news that we are indeed doomed for using fossil fuels.
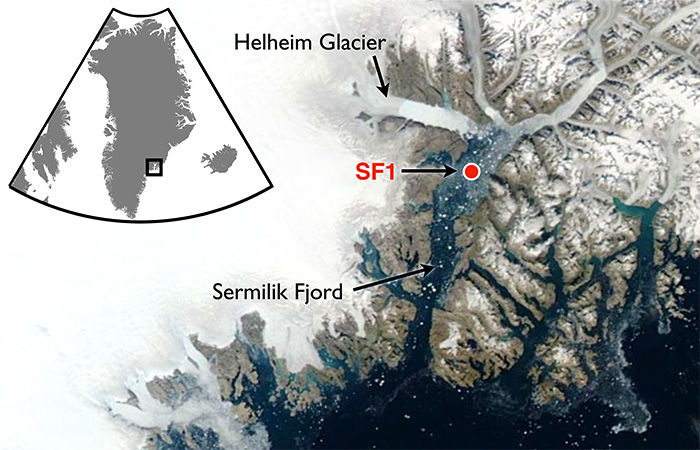
A recent example is a team of researchers from Dubai (the hot and sandy petro kingdom) going to Greenland to report on the melting of Helheim glacier there. The article is NYUAD team finds reasons behind Greenland’s glacier melt. Excerpts in italics with my bolds.
First the study and findings:
For the first time, warm waters that originate in the tropics have been found at uniform depth, displacing the cold polar water at the Helheim calving front, causing an unusually high melt rate. Typically, ocean waters near the terminus of an outlet glacier like Helheim are at the freezing point and cause little melting.
NYUAD researchers, led by Professor of Mathematics at NYU’s Courant Institute of Mathematical Sciences and Principal Investigator for NYU Abu Dhabi’s Centre for Sea Level Change David Holland, on August 5, deployed a helicopter-borne ocean temperature probe into a pond-like opening, created by warm ocean waters, in the usually thick and frozen melange in front of the glacier terminus.
Normally, warm, salty waters from the tropics travel north with the Gulf Stream, where at Greenland they meet with cold, fresh water coming from the polar region. Because the tropical waters are so salty, they normally sink beneath the polar waters. But Holland and his team discovered that the temperature of the ocean water at the base of the glacier was a uniform 4 degrees Centigrade from top to bottom at depth to 800 metres. The finding was also recently confirmed by Nasa’s OMG (Oceans Melting Greenland) project.
“This is unsustainable from the point of view of glacier mass balance as the warm waters are melting the glacier much faster than they can be replenished,” said Holland.
Surface melt drains through the ice sheet and flows under the glacier and into the ocean. Such fresh waters input at the calving front at depth have enormous buoyancy and want to reach the surface of the ocean at the calving front. In doing so, they draw the deep warm tropical water up to the surface, as well.
All around Greenland, at depth, warm tropical waters can be found at many locations. Their presence over time changes depending on the behaviour of the Gulf Stream. Over the last two decades, the warm tropical waters at depth have been found in abundance. Greenland outlet glaciers like Helheim have been melting rapidly and retreating since the arrival of these warm waters.
Then the Hysteria and Pledge of Alligiance to Global Warming
“We are surprised to learn that increased surface glacier melt due to warming atmosphere can trigger increased ocean melting of the glacier,” added Holland. “Essentially, the warming air and warming ocean water are delivering a troubling ‘one-two punch’ that is rapidly accelerating glacier melt.”
My comment: Hold on. They studied effects from warmer ocean water gaining access underneath that glacier. Oceans have roughly 1000 times the heat capacity of the atmosphere, so the idea that the air is warming the water is far-fetched. And remember also that long wave radiation of the sort that CO2 can emit can not penetrate beyond the first millimeter or so of the water surface. So how did warmer ocean water get attributed to rising CO2? Don’t ask, don’t tell. And the idea that air is melting Arctic glaciers is also unfounded.
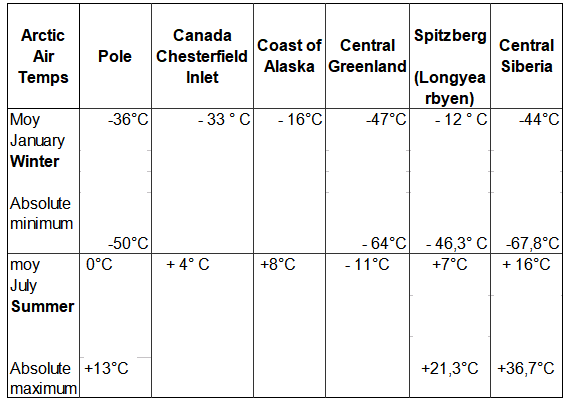
Consider the basics of air parcels in the Arctic.
The central region of the Arctic is very dry. Why? Firstly because the water is frozen and releases very little water vapour into the atmosphere. And secondly because (according to the laws of physics) cold air can retain very little moisture.
Greenland has the only veritable polar ice cap in the Arctic, meaning that the climate is even harsher (10°C colder) than at the North Pole, except along the coast and in the southern part of the landmass where the Atlantic has a warming effect. The marked stability of Greenland’s climate is due to a layer of very cold air just above ground level, air that is always heavier than the upper layers of the troposphere. The result of this is a strong, gravity-driven air flow down the slopes (i.e. catabatic winds), generating gusts that can reach 200 kph at ground level.
Arctic air temperatures Some history and scientific facts are needed to put these claims in context. Let’s start with what is known about Helheim Glacier.
Holocene history of the Helheim Glacier, southeast Greenland
Helheim Glacier ranks among the fastest flowing and most ice discharging outlets of the Greenland Ice Sheet (GrIS). After undergoing rapid speed-up in the early 2000s, understanding its long-term mass balance and dynamic has become increasingly important. Here, we present the first record of direct Holocene ice-marginal changes of the Helheim Glacier following the initial deglaciation. By analysing cores from lakes adjacent to the present ice margin, we pinpoint periods of advance and retreat. We target threshold lakes, which receive glacial meltwater only when the margin is at an advanced position, similar to the present. We show that, during the period from 10.5 to 9.6 cal ka BP, the extent of Helheim Glacier was similar to that of todays, after which it remained retracted for most of the Holocene until a re-advance caused it to reach its present extent at c. 0.3 cal ka BP, during the Little Ice Age (LIA). Thus, Helheim Glacier’s present extent is the largest since the last deglaciation, and its Holocene history shows that it is capable of recovering after several millennia of warming and retreat. Furthermore, the absence of advances beyond the present-day position during for example the 9.3 and 8.2 ka cold events as well as the early-Neoglacial suggest a substantial retreat during most of the Holocene.
The topography of Greenland shows why its ice cap has persisted for millenia despite its southerly location. It is a bowl surrounded by ridges except for a few outlets, Helheim being a major one.
Helheim Glacier is the fastest flowing glacier along the eastern edge of Greenland Ice Sheet and one of the island’s largest ocean-terminating rivers of ice. Named after the Vikings’ world of the dead, Helheim has kept scientists on their toes for the past two decades. Between 2000 and 2005, Helheim quickly increased the rate at which it dumped ice to the sea, while also rapidly retreating inland- a behavior also seen in other glaciers around Greenland. Since then, the ice loss has slowed down and the glacier’s front has partially recovered, readvancing by about 2 miles of the more than 4 miles it had initially retreated.
NASA has compiled a time series of airborne observations of Helheim’s changes into a new visualization that illustrates the complexity of studying Earth’s changing ice sheets. NASA uses satellites and airborne sensors to track variations in polar ice year after year to figure out what’s driving these changes and what impact they will have in the future on global concerns like sea level rise.
Since 1997, NASA has collected data over Helheim Glacier almost every year during annual airborne surveys of the Greenland Ice Sheet using an airborne laser altimeter called the Airborne Topographic Mapper (ATM). Since 2009 these surveys have continued as part of Operation IceBridge, NASA’s ongoing airborne survey of polar ice and its longest-running airborne mission. ATM measures the elevation of the glacier along a swath as the plane files along the middle of the glacier. By comparing the changes in the height of the glacier surface from year to year, scientists estimate how much ice the glacier has lost.
The animation begins by showing the NASA P-3 plane collecting elevation data in 1998. The laser instrument maps the glacier’s surface in a circular scanning pattern, firing laser shots that reflect off the ice and are recorded by the laser’s detectors aboard the airplane. The instrument measures the time it takes for the laser pulses to travel down to the ice and back to the aircraft, enabling scientists to measure the height of the ice surface. In the animation, the laser data is combined with three-dimensional images created from IceBridge’s high-resolution camera system. The animation then switches to data collected in 2013, showing how the surface elevation and position of the calving front (the edge of the glacier, from where it sheds ice) have changed over those 15 years.
Helheim’s calving front retreated about 2.5 miles between 1998 and 2013. It also thinned by around 330 feet during that period, one of the fastest thinning rates in Greenland.
“The calving front of the glacier most likely was perched on a ledge in the bedrock in 1998 and then something altered its equilibrium,” said Joe MacGregor, IceBridge deputy project scientist. “One of the most likely culprits is a change in ocean circulation or temperature, such that slightly warmer water entered into the fjord, melted a bit more ice and disturbed the glacier’s delicate balance of forces.”
In addition consider Greenland Ice Math
Prompted by comments from Gordon Walleville, let’s look at Greenland ice gains and losses in context. The ongoing SMB (surface mass balance) estimates ice sheet mass net from melting and sublimation losses and precipitation gains. Dynamic ice loss is a separate calculation of calving chunks of ice off the edges of the sheet, as discussed in the post above. The two factors are combined in a paper Forty-six years of Greenland Ice Sheet mass balance from 1972 to 2018 by Mouginot et al. (2019) Excerpt in italics. (“D” refers to dynamic ice loss.)
Greenland’s SMB averaged 422 ± 10 Gt/y in 1961–1989 (SI Appendix, Fig. S1H). It decreased from 506 ± 18 Gt/y in the 1970s to 410 ± 17 Gt/y in the 1980s and 1990s, 251 ± 20 Gt/y in 2010–2018, and a minimum at 145 ± 55 Gt/y in 2012. In 2018, SMB was above equilibrium at 449 ± 55 Gt, but the ice sheet still lost 105 ± 55 Gt, because D is well above equilibrium and 15 Gt higher than in 2017. In 1972–2000, D averaged 456 ± 1 Gt/y, near balance, to peak at 555 ± 12 Gt/y in 2018. In total, the mass loss increased to 286 ± 20 Gt/y in 2010–2018 due to an 18 ± 1% increase in D and a 48 ± 9% decrease in SMB. The ice sheet gained 47 ± 21 Gt/y in 1972–1980, and lost 50 ± 17 Gt/y in the 1980s, 41 ± 17 Gt/y in the 1990s, 187 ± 17 Gt/y in the 2000s, and 286 ± 20 Gt/y in 2010–2018 (Fig. 2). Since 1972, the ice sheet lost 4,976 ± 400 Gt, or 13.7 ± 1.1 mm SLR.
Doing the numbers: Greenland area 2.1 10^6 km2 80% ice cover, 1500 m thick in average- That is 2.5 Million Gton. Simplified to 1 km3 = 1 Gton
The estimated loss since 1972 is 5000 Gt (rounded off), which is 110 Gt a year. The more recent estimates are higher, in the 200 Gt range.
200 Gton is 0.008 % of the Greenland ice sheet mass.
Annual snowfall: From the Lost Squadron, we know at that particular spot, the ice increase since 1942 – 1990 was 1.5 m/year ( Planes were found 75 m below surface) Assume that yearly precipitation is 100 mm / year over the entire surface. That is 168000 Gton. Yes, Greenland is Big! Inflow = 168,000Gton. Outflow is 168,200 Gton.
So if that 200 Gton rate continued, (assuming as models do, despite air photos showing fluctuations), that ice loss would result in a 1% loss of Greenland ice in 800 years. (H/t Bengt Abelsson)
Comment:
Once again, history is a better guide than hysteria. Over time glaciers advance and retreat, and incursions of warm water are a key factor. Greenland ice cap and glaciers are part of the Arctic self-oscillating climate system operating on a quasi-60 year cycle.
It appears the reconciliation bill that includes some $370 billion in energy-related spending is going to become law. The measure includes a panoply of tax credits for alternative energy technologies, including incentives for electric vehicles, hydrogen, energy storage, and of course, billions of dollars in tax credits for wind and solar energy.
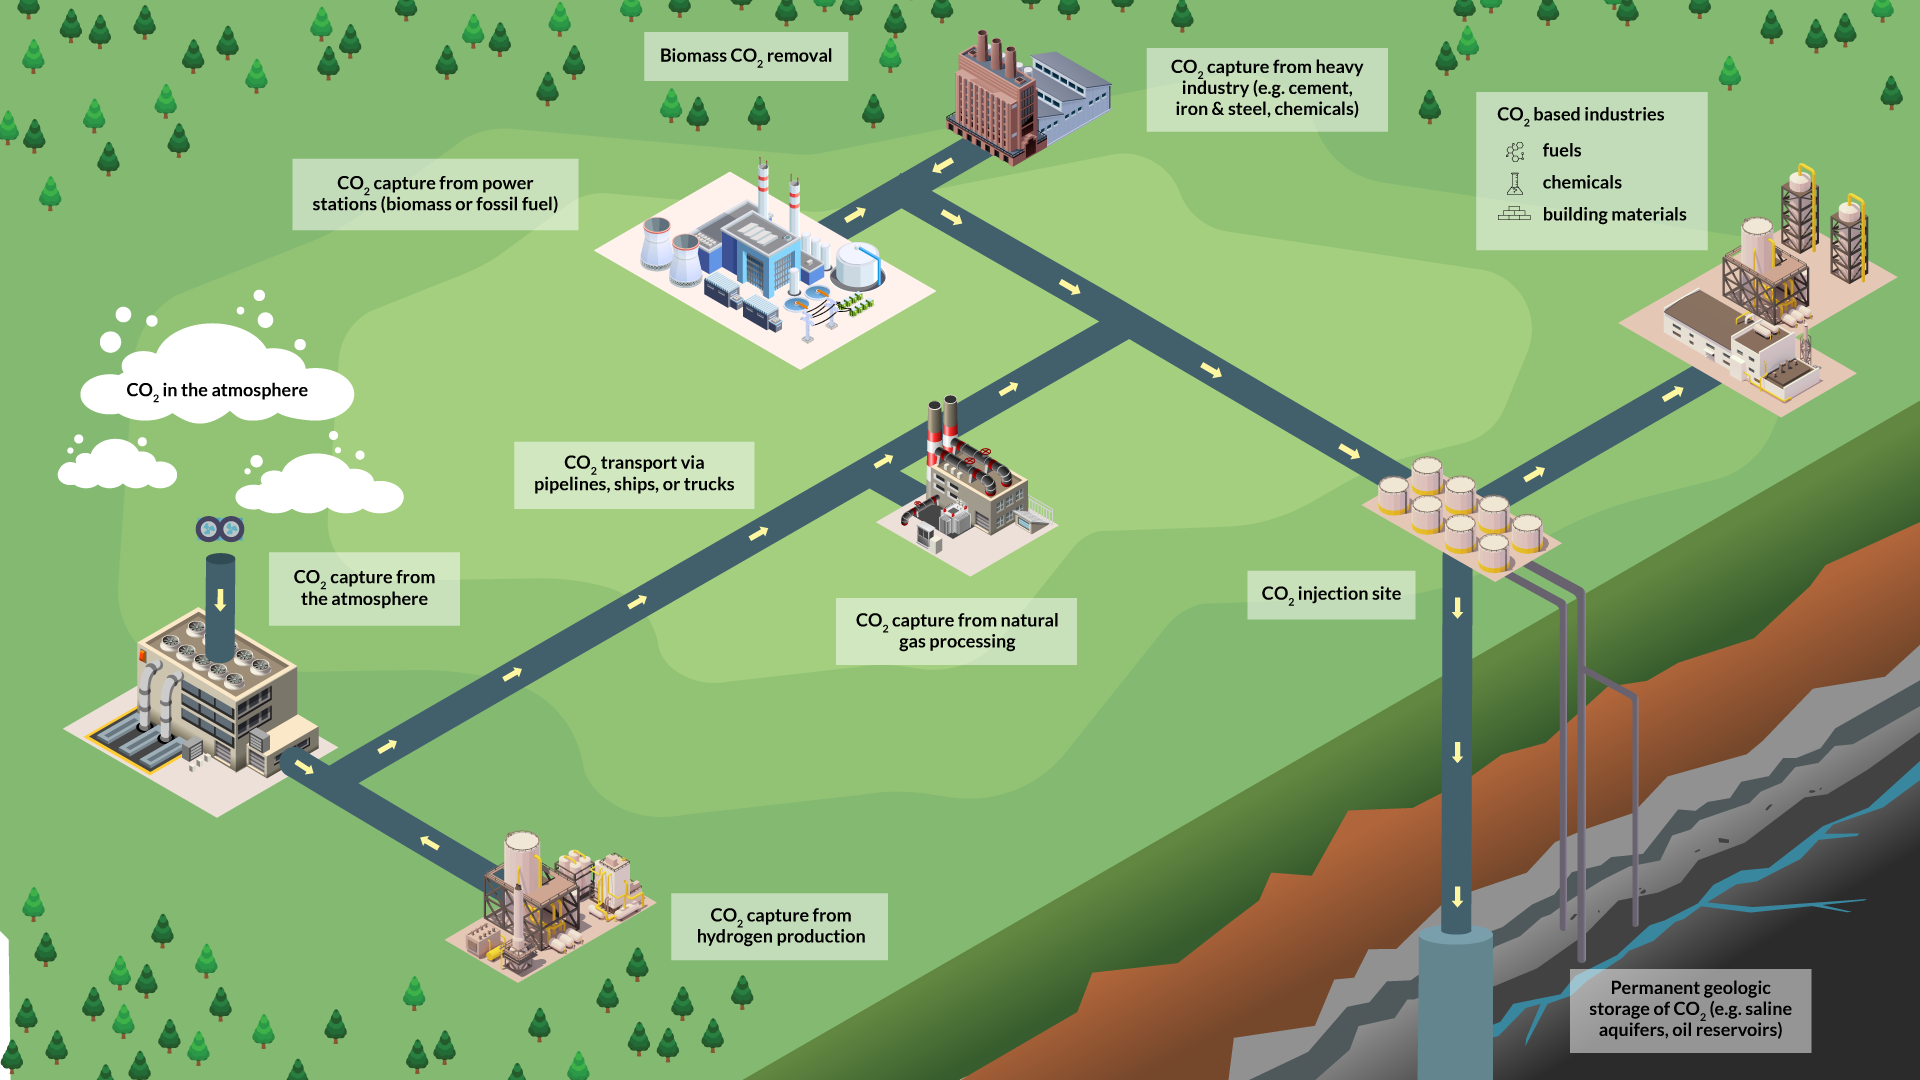
The measure also includes, according to the Congressional Budget Office, some $3.2 billion in tax credits for carbon capture and sequestration, a technology that has plenty of supporters but precious little in the way of commercially successful projects. Back in 2018, Al Gore blasted CCS, calling it “nonsense” and an “extremely improbable solution.”
The new tax credits for CCS remind me that I published a piece in the New York Times on May 12, 2010, about the technology. In looking back, the piece is still relevant today. In fact, I wouldn’t change a word of it. Furthermore, my prediction about the difficulty of siting the pipelines needed to move the CO2 has already come true. For proof, see this August 6, Wall Street Journal article about the opposition to a proposed CO2 pipeline in Iowa.
In any case here’s my 12-year-old take on why CCS is a bad bet:
On Wednesday, John Kerry and Joseph Lieberman introduced their long-awaited Senate energy bill, which includes incentives of $2 billion per year for carbon capture and sequestration, the technology that removes carbon dioxide from the smokestack at power plants and forces it into underground storage. This significant allocation would come on top of the $2.4 billion for carbon capture projects that appeared in last year’s stimulus package.
That’s a lot of money for a technology whose adoption faces three potentially insurmountable hurdles: it greatly reduces the output of power plants; pipeline capacity to move the newly captured carbon dioxide is woefully insufficient; and the volume of waste material is staggering. Lawmakers should stop perpetuating the hope that the technology can help make huge cuts in the United States’ carbon dioxide emissions.
1. An Energy Intensive Process
Let’s take the first problem. Capturing carbon dioxide from the flue gas of a coal-fired electric generation plant is an energy-intensive process. Analysts estimate that capturing the carbon dioxide cuts the output of a typical plant by as much as 28 percent.
Given that the global energy sector is already straining to meet booming demand for electricity, it’s hard to believe that the United States, or any other country that relies on coal-fired generation, will agree to reduce the output of its coal-fired plants by almost a third in order to attempt carbon capture and sequestration.
2. Costly Pipelines for a Waste Gas
Here’s the second problem. The Pacific Northwest National Laboratory has estimated that up to 23,000 miles of new pipeline will be needed to carry the captured carbon dioxide to the still-undesignated underground sequestration sites. That doesn’t sound like much when you consider that America’s gas pipeline system sprawls over some 2.3 million miles. But those natural gas pipelines carry a valuable, marketable, useful commodity.
By contrast, carbon dioxide is a worthless waste product, so taxpayers would likely end up shouldering most of the cost. Yes, some of that waste gas could be used for enhanced oil recovery projects; flooding depleted oil reservoirs with carbon dioxide is a proven technology that can increase production and extend the life of existing oilfields. But the process would be useful in only a limited number of oilfields — probably less than 10 percent of the waste carbon dioxide captured from coal-fired power plants could actually be injected into American oilfields.
3. Impossibly Massive Scale
The third, and most vexing, problem has to do with scale. In 2009, carbon dioxide emissions in the United States totaled 5.4 billion tons. Let’s assume that policymakers want to use carbon capture to get rid of half of those emissions — say, 3 billion tons per year. That works out to about 8.2 million tons of carbon dioxide per day, which would have to be collected and compressed to about 1,000 pounds per square inch (that compressed volume of carbon dioxide would be roughly equivalent to the volume of daily global oil production).
In other words, we would need to find an underground location (or locations) able to swallow a volume equal to the contents of 41 oil supertankers each day, 365 days a year.
There will also be considerable public resistance to carbon dioxide pipelines and sequestration projects — local outcry has already stalled proposed carbon capture projects in Germany and Denmark. The fact is, few landowners are eager to have pipelines built across their property. And because of the possibility of deadly leaks, few people will want to live near a pipeline or an underground storage cavern. This leads to the obvious question: which members of the House and Senate are going to volunteer their states to be dumping grounds for all that carbon dioxide?
For some, carbon capture and sequestration will remain the Holy Grail of carbon-reduction strategies. But before Congress throws yet more money at the procedure, lawmakers need to take a closer look at the issues that hamstring nearly every new energy-related technology: cost and scale.
Footnote: The project is not only impractical, its deluded objective is to deprive the biosphere of plant food.
Christopher Gage writes at his blog Oxford Sour The Cost of Folly Excerpts in italics with my bolds and added images.
Sociologists say one third of any society harbours a ‘latent authoritarianism.’ All they need is a little wink and a nudge from someone in a lab coat.
For such people, the pandemic was the glory days of a humdrum existence.
They were the winners. They studied the ever-changing rules, the more ridiculous the better. They pretended Sweden didn’t exist. They willed Florida to swamp herself in Covid deaths.
When such measures failed, they recanted with primitive fervour: ‘We didn’t lock down hard enough!’
The pandemic celebrated usually negative personality traits. High neuroticism combined with high agreeableness—the psychic soup of scolds and puritans—became the stuff of winners.
Back then, ten percent of people consistently told pollsters they’d lockdown indefinitely. A crazy poll in The Economist found forty percent wanted masks to remain; a quarter would shut down all nightclubs and casinos; another third craved socially-distanced theatres, pubs, and stadiums. A sizeable number wanted a 10 p.m. curfew! And they wanted all this regardless of Covid-19.
No doubt, the same people would now tell pollsters much different. The social currency of lockdown fanaticism has, like our money, eroded in value.
But they’re still there, and given the chance, they’ll fall in line when the conditions are right.
In his work, The True Believer, Eric Hoffer said that “by embracing a holy cause and dedicating their energies and substance to its advancement,” such people, “find a new life of purpose and meaning.”
To some, the pandemic was the great equaliser. Freedom to them is an ‘irksome burden’ and revealing of one’s shortcomings. As Hoffer said, they want freedom from freedom itself.
Why is it so many obey authority when coerced?
Social psychologist Stanley Milgram’s obedience experiments found that people obeyed either out of fear or out of a desire to fit in, even when obeying went against their better judgements.
In Milgram’s classic study, sixty-five percent were willing to administer a fatal dose of electricity to a fellow human being, provided an authority figure told them to do so. Participants were told the experiment would study the effects of punishment on learning. The ‘learner’ (an actor) was rigged up to electrodes.
The ‘teacher’ (an unknowing participant) was instructed to ask the learner questions, and zap the learner for any wrong answers, increasing the severity of the shock for each wrong answer. The shock generator was marked from 15 volts (a slight shock) to 450 volts (Danger! Severe shock.) The final shock was marked: ‘XXXX.’
The actor would provide the wrong answers on purpose. And dial up the volume of his complaints as the shocks got worse. A slight shock elicited a grunt. He’d scream in agony at 285 volts. Further up the scale, he’d complain of heart pain. At 330 volts: total silence.
When the teacher hesitated, the experimenter would pressure him to keep going: From, ‘please continue,’ to ‘the experiment requires that you continue,’ to ‘You have no choice but to continue.’
One teacher who begged to end the experiment was told he must continue. He went on, repeating to himself: “It’s got to go on. It’s got to go on.”
Milgram found that over two-thirds of ordinary people, when ordered to by an authority figure, would administer a fatal 450v shock to an innocent human being.
Another study found many will change their beliefs to fit in. Solomon Asch asked participants to match one line with three other lines. Two lines were of obviously different lengths, and one line was of obviously matching length.
Without actors present, 99 percent of participants answered correctly. When surrounded by actors claiming a shorter or longer line was actually the matching line, the result was much different. A full 37 percent of participants would change their mind to agree with the others, despite the correct answer being childishly obvious.
Asch said of the results, “That intelligent, well-meaning, young people are willing to call white, black is a matter of concern.”
And don’t we know it.
Freedom is not our default state. Our default state is of safety and suspicion. The free society is an aberration. That’s something we tend to forget.
Postscript: Clive James once said: ‘The problem with Australians is not that so many of them are descended from convicts but that so many are descended from prison officers.’
The best context for understanding decadal temperature changes comes from the world’s sea surface temperatures (SST), for several reasons:
The ocean covers 71% of the globe and drives average temperatures;
SSTs have a constant water content, (unlike air temperatures), so give a better reading of heat content variations;
A major El Nino was the dominant climate feature in recent years.
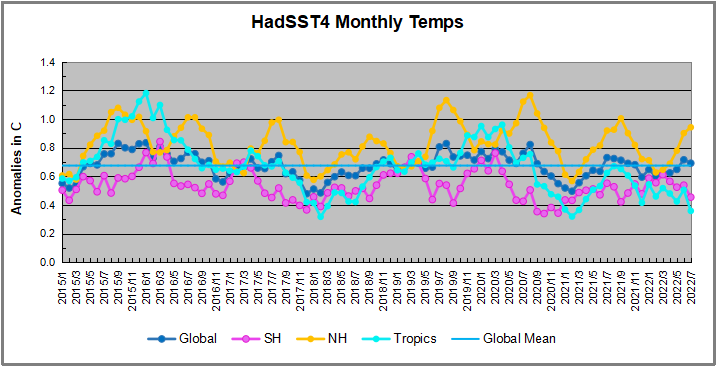
HadSST is generally regarded as the best of the global SST data sets, and so the temperature story here comes from that source. Previously I used HadSST3 for these reports, but Hadley Centre has made HadSST4 the priority, and v.3 will no longer be updated. HadSST4 is the same as v.3, except that the older data from ship water intake was re-estimated to be generally lower temperatures than shown in v.3. The effect is that v.4 has lower average anomalies for the baseline period 1961-1990, thereby showing higher current anomalies than v.3. This analysis concerns more recent time periods and depends on very similar differentials as those from v.3 despite higher absolute anomaly values in v.4. More on what distinguishes HadSST3 and 4 from other SST products at the end. The user guide for HadSST4 is here.
The Current Context
The 2021 year end report included below showed rapid cooling in all regions. The anomalies then continued in 2022 to remain near the mean since 2015. This Global Cooling was also evident in the UAH Land and Ocean air temperature ( Tropics Lead Remarkable Cooling June 2022 )
The chart below shows SST monthly anomalies as reported in HadSST4 starting in 2015 through July 2022. A global cooling pattern is seen clearly in the Tropics since its peak in 2016, joined by NH and SH cycling downward since 2016.
Note that higher temps in 2015 and 2016 were first of all due to a sharp rise in Tropical SST, beginning in March 2015, peaking in January 2016, and steadily declining back below its beginning level. Secondly, the Northern Hemisphere added three bumps on the shoulders of Tropical warming, with peaks in August of each year. A fourth NH bump was lower and peaked in September 2018. As noted above, a fifth peak in August 2019 and a sixth August 2020 exceeded the four previous upward bumps in NH. A smaller NH rise in 2021 peaked in September of that year.
After an upward bump in August, the 2021 yearend Global temp anomaly dropped below the mean, driven by sharp declines in the Tropics and NH. 2022 started with all regions remaining cool and the Global anomaly lower than the mean for this period. Despite an upward bump in NH May to July, other regions remained cool leaving the Global anomaly little changed. This year the summer NH upward bump is not joined by warming in the Tropics or in SH, which in July resulted in a cooler Global anomaly offsetting NH warming.
A longer view of SSTs
The graph above is noisy, but the density is needed to see the seasonal patterns in the oceanic fluctuations. Previous posts focused on the rise and fall of the last El Nino starting in 2015. This post adds a longer view, encompassing the significant 1998 El Nino and since. The color schemes are retained for Global, Tropics, NH and SH anomalies. Despite the longer time frame, I have kept the monthly data (rather than yearly averages) because of interesting shifts between January and July.1995 is a reasonable (ENSO neutral) starting point prior to the first El Nino. The sharp Tropical rise peaking in 1998 is dominant in the record, starting Jan. ’97 to pull up SSTs uniformly before returning to the same level Jan. ’99. For the next 2 years, the Tropics stayed down, and the world’s oceans held steady around 0.5C above 1961 to 1990 average.
Then comes a steady rise over two years to a lesser peak Jan. 2003, but again uniformly pulling all oceans up around 0.5C. Something changes at this point, with more hemispheric divergence than before. Over the 4 years until Jan 2007, the Tropics go through ups and downs, NH a series of ups and SH mostly downs. As a result the Global average fluctuates around that same 0.5C, which also turns out to be the average for the entire record since 1995.
2007 stands out with a sharp drop in temperatures so that Jan.08 matches the low in Jan. ’99, but starting from a lower high. The oceans all decline as well, until temps build peaking in 2010.
Now again a different pattern appears. The Tropics cool sharply to Jan 11, then rise steadily for 4 years to Jan 15, at which point the most recent major El Nino takes off. But this time in contrast to ’97-’99, the Northern Hemisphere produces peaks every summer pulling up the Global average. In fact, these NH peaks appear every July starting in 2003, growing stronger to produce 3 massive highs in 2014, 15 and 16. NH July 2017 was only slightly lower, and a fifth NH peak still lower in Sept. 2018.
The highest summer NH peaks came in 2019 and 2020, only this time the Tropics and SH are offsetting rather adding to the warming. (Note: these are high anomalies on top of the highest absolute temps in the NH.) Since 2014 SH has played a moderating role, offsetting the NH warming pulses. After September 2020 temps dropped off down until February 2021, then all regions rose to bring the global anomaly above the mean since 1995 June 2021 backed down before warming again slightly in July and August 2021, then cooling slightly in September. The present 2022 level compares with 2014 and also 2018.
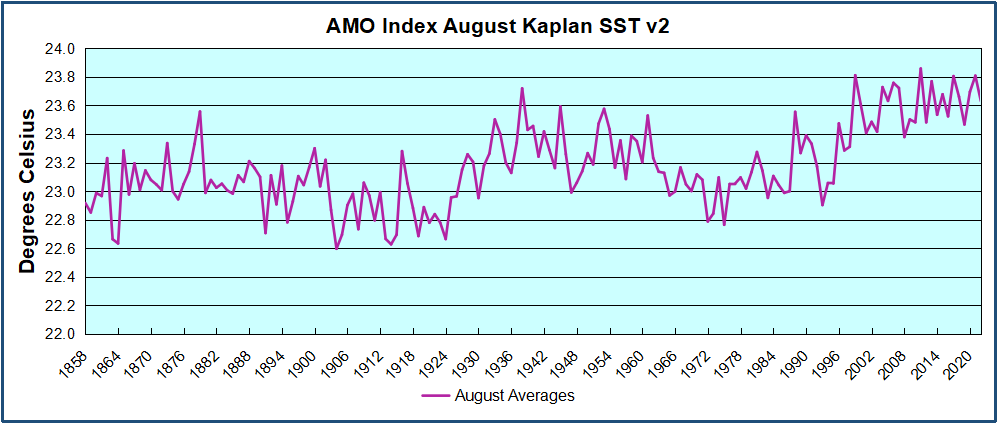
What to make of all this? The patterns suggest that in addition to El Ninos in the Pacific driving the Tropic SSTs, something else is going on in the NH. The obvious culprit is the North Atlantic, since I have seen this sort of pulsing before. After reading some papers by David Dilley, I confirmed his observation of Atlantic pulses into the Arctic every 8 to 10 years.
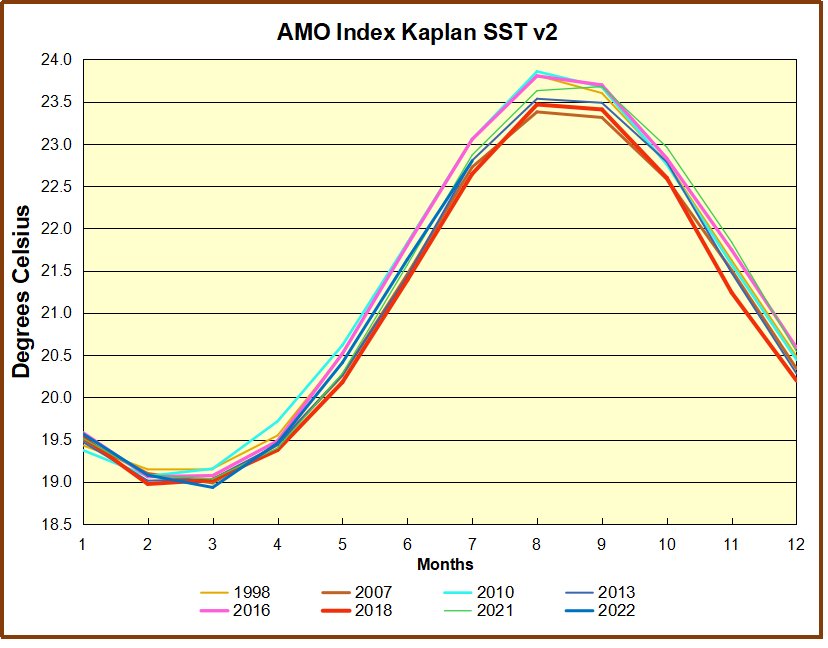
But the peaks coming nearly every summer in HadSST require a different picture. Let’s look at August, the hottest month in the North Atlantic from the Kaplan dataset.
The AMO Index is from from Kaplan SST v2, the unaltered and not detrended dataset. By definition, the data are monthly average SSTs interpolated to a 5×5 grid over the North Atlantic basically 0 to 70N. The graph shows August warming began after 1992 up to 1998, with a series of matching years since, including 2020, dropping down in 2021. Because the N. Atlantic has partnered with the Pacific ENSO recently, let’s take a closer look at some AMO years in the last 2 decades.
This graph shows monthly AMO temps for some important years. The Peak years were 1998, 2010 and 2016, with the latter emphasized as the most recent. The other years show lesser warming, with 2007 emphasized as the coolest in the last 20 years. Note the red 2018 line is at the bottom of all these tracks. The heavy blue line shows that 2022 started warm, dropped to the bottom and now is near the lower tracks pictured.
Summary
The oceans are driving the warming this century. SSTs took a step up with the 1998 El Nino and have stayed there with help from the North Atlantic, and more recently the Pacific northern “Blob.” The ocean surfaces are releasing a lot of energy, warming the air, but eventually will have a cooling effect. The decline after 1937 was rapid by comparison, so one wonders: How long can the oceans keep this up? If the pattern of recent years continues, NH SST anomalies may rise slightly in coming months, but once again, ENSO which has weakened will probably determine the outcome.
Footnote: Why Rely on HadSST4
HadSST is distinguished from other SST products because HadCRU (Hadley Climatic Research Unit) does not engage in SST interpolation, i.e. infilling estimated anomalies into grid cells lacking sufficient sampling in a given month. From reading the documentation and from queries to Met Office, this is their procedure.
HadSST4 imports data from gridcells containing ocean, excluding land cells. From past records, they have calculated daily and monthly average readings for each grid cell for the period 1961 to 1990. Those temperatures form the baseline from which anomalies are calculated.
In a given month, each gridcell with sufficient sampling is averaged for the month and then the baseline value for that cell and that month is subtracted, resulting in the monthly anomaly for that cell. All cells with monthly anomalies are averaged to produce global, hemispheric and tropical anomalies for the month, based on the cells in those locations. For example, Tropics averages include ocean grid cells lying between latitudes 20N and 20S.
Gridcells lacking sufficient sampling that month are left out of the averaging, and the uncertainty from such missing data is estimated. IMO that is more reasonable than inventing data to infill. And it seems that the Global Drifter Array displayed in the top image is providing more uniform coverage of the oceans than in the past.
USS Pearl Harbor deploys Global Drifter Buoys in Pacific Ocean
Footnote Rare Triple Dip La Nina Likely This Winter
The unusual weather phenomenon might result in the snowiest season in years for some parts of the country.
The long-range winter forecast could be good news for skiers living in the certain parts of the U.S. and Canada. The National Oceanic and Atmospheric Administration(NOAA) estimates that the chance of a La Niña occurring this fall and early winter is 86 percent, and the main beneficiary is expected to be mountains in the Northwest and Northern Rockies.
If NOAA’s predictions pan out, this will be the third La Niña in a row—a rare phenomenon called a “Triple Dip La Niña.” Between now and 1950, only two Triple Dips have occurred.
Smith also notes that winters on the East Coast are similarly tricky to predict during La Niña years. “In the West, you’re simply looking for above-average precipitation, which typically translates to above-average snowfall, but in the East, you have temperature to worry about as well … that adds another complication.” In other words, increased precip could lead to more rain if the temperatures aren’t cooperative.
The presence of a La Niña doesn’t always translate to higher snowfall in the North, either, as evidenced by last ski season, which saw few powder days.
However, in consecutive La Niña triplets, one winter usually involves above-average snowfall. While this historical pattern isn’t tied to any documented meteorological function, it could mean that the odds of a snowy 2022’-’23 season are higher, given the previous two La Niñas didn’t deliver the goods.
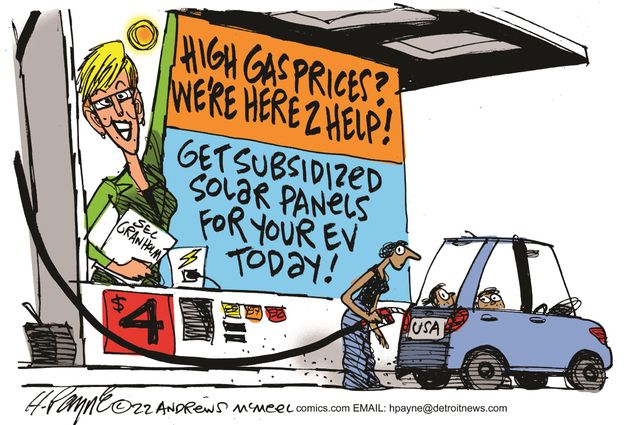
Bonner Cohen reveals land mines and pitfalls in the just signed climate law, the so-called Inflation Reduction Act. Converting the US auto fleet to Electric Vehicles (EVs) just got much harder, not to say impossible. His Daily Caller article is Why Democrats’ Road to EV Utopia Got a Whole Lot Bumpier. Excerpts in italics with my bolds.
Aside from the new taxes, handouts to the well-connected, and price controls on certain pharmaceuticals, the bill’s “climate” provisions contain a slew of incentives crafted to promote electric vehicles (EVs). But the Byzantine structure lawmakers erected to govern the transition to the EV green utopia guarantees that things will get a lot bumpier than Bette Davis’s character could ever have imagined.
Let’s start with the handouts to the EV industry. U.S. taxpayers have been subsidizing the purchase of EVs for years. Under the new law, those subsidies will be extended through 2032. But only EVs below a certain price will qualify for the tax credits, and only buyers whose income is below a certain level will be eligible to take advantage of them.
Before the new law took effect, buyers could receive tax credits of up to $7,500 only if an automaker had sold fewer than 200,000 EVs, a threshold Tesla and General Motors crossed years ago, and one that other manufacturers are rapidly approaching. Now, only new electric-powered SUVs, vans and trucks that cost less than $80,000 qualify for up to $7.500 in tax credits.
EVs eligible for the tax credits, however, must be assembled in North America and their battery components must come from the U.S. or a handful of friendly nations. And, by 2029, the law stipulates that 100% of battery components are to come from North America. This is where life gets interesting.
Geopolitical Consequences
“Today’s battery and mineral supply chains revolve around China,’ the International Energy Agency (IEA) reported in July. “China produces three-quarters of all lithium-ion batteries and is home to 70% of production capacity for cathodes and 85% of anodes (both are key components of batteries). Over half of lithium, cobalt, and graphite processing and refining capacity is located in China.”
IEA projects that the global market for lithium will grow more than 40-fold by 2040, with demand for nickel, cobalt and graphite likely to be 25-times higher than it is today. Russia is home to about a fifth of the world’s high-grade nickel — a substance coveted by EV manufacturers for extending the range and power of batteries.
In other words, the raw materials essential to the EV transition are largely under the control of America’s geopolitical rivals. China and Russia are also the chief beneficiaries of the soaring costs of the commodities essential to power EVs. But the Schumer-Manchin bill seeks to shift the source of EV battery components to the U.S. or its allies.
Is this realistic? There is only one nickel mine in the U.S., and that Michigan operation is set to close in 2025. Two lithium mines have been proposed in Nevada, but they are encountering fierce resistance from tribal and environmental groups. On average, it takes 12 years for a mining project in the U.S. to clear all the permitting red tape and litigation before it can go into operation. Many projects never come to fruition.
As commodity prices increase, the prices of EVs — already higher than conventionally-powered vehicles — will rise accordingly. Most automakers have already announced plans to cease production of gas-powered vehicles by the middle of the next decade. They, too, will become more expensive as their numbers dwindle. Consumers, being force-fed EVs by government and automakers, will have to dig deeper and deeper.
The disruptions will go far beyond what people will have to pay for personal transportation. Ford just announced it is laying off 3,000 white-collar employees as part of the company’s transition to EVs. Blue-collar workers at Ford, and other automakers, will follow, because it takes fewer workers to assemble an EV (fewer parts) than a conventional vehicle.
Squeeze Play
Furthermore, the vast number of wind farms and solar arrays the Biden administration is planning for the country will require an enormous number of batteries to supply electricity when the sun doesn’t shine and the wind doesn’t blow. Those batteries will compete with EV batteries for the expensive raw materials they need to function, opening the door to shortages and higher costs.
The consumer of modest means will be caught in a squeeze play, struggling to pay soaring power bills while trying to afford a new, or used, car.
“Even with the tax credits, EVs are impractical and unaffordable for most low-income households,” says Donna Jackson, director of membership development for Project 21, a network of black conservatives. “The real message to the poor and minority communities is take the bus.”
Indeed, the Democrats’ dystopian Inflation Reduction Act will only exacerbate America’s energy woes and cause incalculable hardship for those who can afford it least, low-income, minority families.
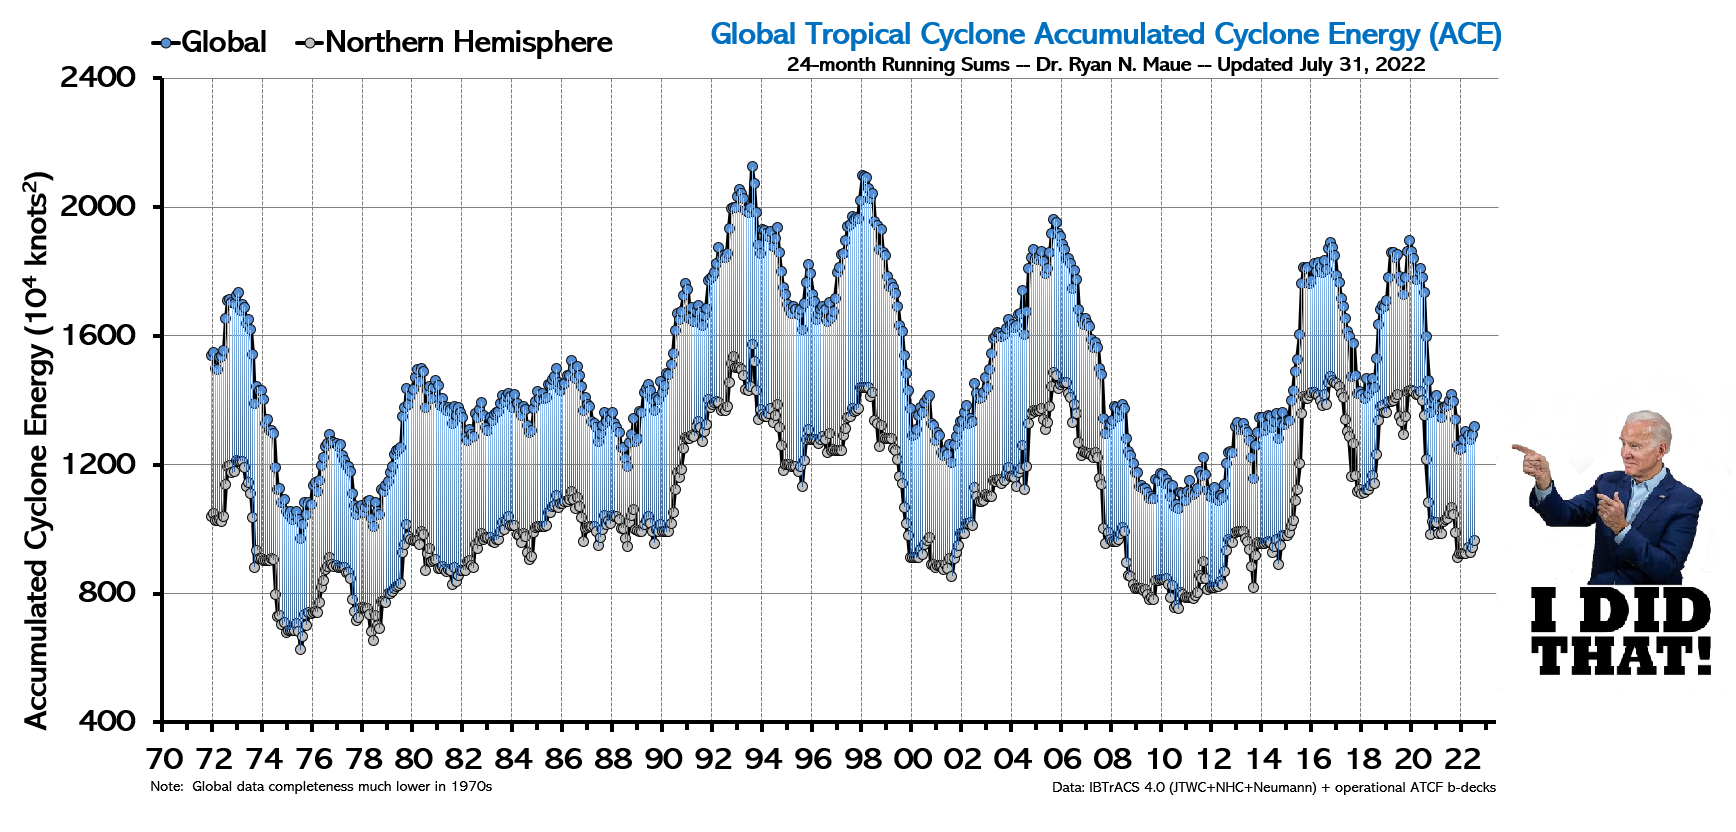
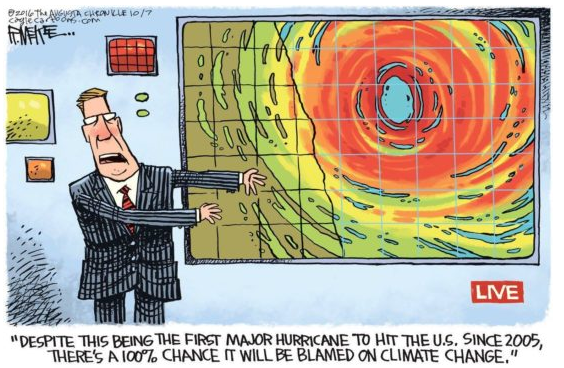
Once again, as nearly every year, officials at NOAA and other agencies called for 2022 to be a “very active” hurricane season. In its May 24 release, NOAA predicted “an “above-average hurricane activity this year — which would make it the seventh consecutive above-average hurricane season.” It’s like the old joke that everyone’s grandkid is “above average”: for some reason, every hurricane season, the risk is now “above average.”
I don’t know how every year can be “above average,” something that defies the laws of statistics. I suspect that it has to do with the strong bias of climate scientists rather than the strength of hurricanes. And in fact, hurricanes have been “fewer than average” this year and for many years recently.
So far, halfway through the hurricane season, no Atlantic storms have made landfall on U.S. soil.
This lack of severe storms defies the dire predictions of global warming alarmists: that rising temperatures will cause catastrophic storms. In reality, one reason why there are fewer and less severe storms this year is that the Atlantic waters have been cooler than usual. That, combined with drier air over the Atlantic, caused by the atmospheric drift of Saharan dust, has caused potential tropical storms to dissipate.
Predictions of “very active” storm seasons are widely publicized each spring, but the reality of fewer and less severe storms never makes its way into the media.
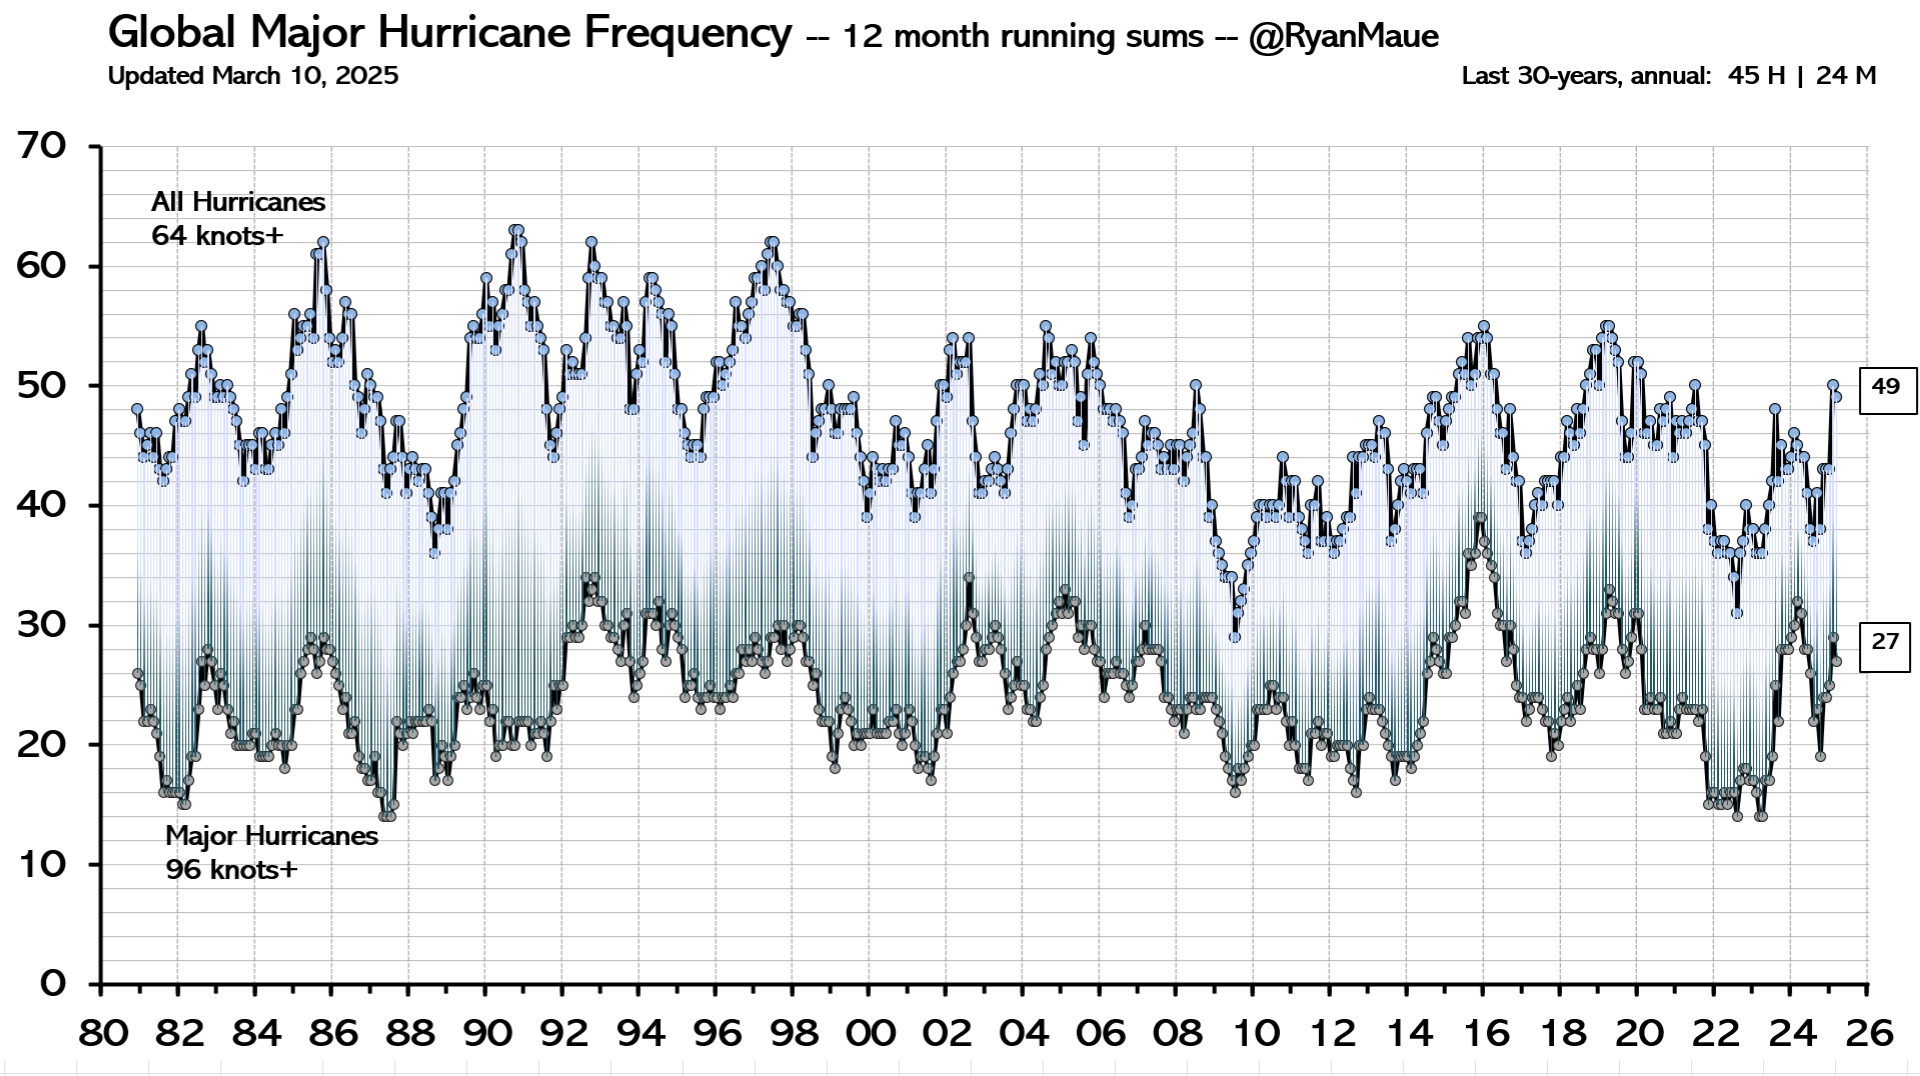
The truth is that some hurricane seasons are more active and some less so. The same is true of tornadoes, droughts, floods, and other natural phenomena. But only the extreme events get publicized and treated as confirmation of climate change. If the media were honest, they would report the truth that the weather has not changed a great deal, at least not since the end of the Little Ice Age in 1850 — and the warmer temperatures since then have been a blessing.
Global temperatures have risen one degree Celsius since the low point of 1850, so severe storms may be somewhat more common than in the distant past. But death rates have dropped precipitously. The worst hurricane in American history was the Great Galveston hurricane of September 8, 1900, which killed some 8,000 people. The worst tornado recorded in U.S. history was the Tri-State Tornado of March 18, 1925, which killed 751 people. Both of these storms occurred long before the period in which alarmists like Al Gore predicted that global warming would cause catastrophic storms — and clearly, they were not “man-made.”
We are safer now because of technology. With advance warning, populations can take shelter or evacuate, and a smartphone or weather radio is all that is necessary to receive warnings. As warning systems become more sophisticated, fewer people will die or be injured by severe weather events. But the development of those systems depends on the ability of individuals to pay for them, and recent government spending will make that less likely — just as it will affect medical research, transportation safety, and police protection.
In addition to the “regular” budget of $5 trillion, this year, Biden has appropriated $7 trillion in emergency spending, much of it for climate change. But that money is not intended to protect us from severe storms. It is being spent on green energy boondoggles that enrich connected insiders but impoverish average citizens. And that impoverishment is the heart of the problem.
With less wealth, it is more difficult to protect oneself against severe weather. Even in years like 2022, which have so far been less active than normal, homeowners must be vigilant if they live along the Atlantic Coast, especially in Florida and other hurricane-prone states. Three months of the hurricane season remain. The odds are that an Atlantic hurricane will strike the East Coast. If a hurricane does make landfall, the media will tout it as proof of the catastrophic effects of global warming. In reality, it will just prove that the climate hasn’t changed much.
Since the destructive 2004 hurricane season, Florida has required all new construction to incorporate tie-down roofing and storm-resistant glass, measures that have made life safer for residents. And since taking office, Gov. Ron DeSantis has maintained storm preparedness and worked to protect citizens of Florida.
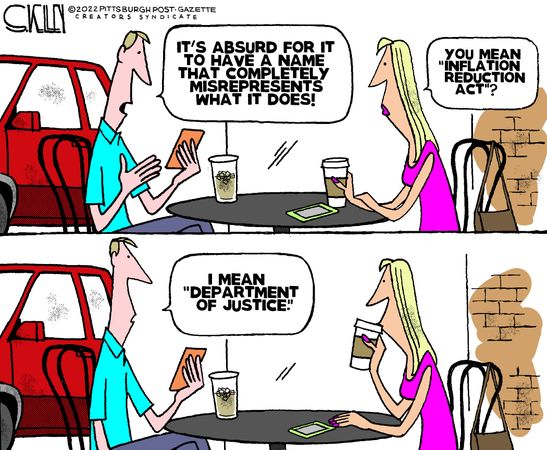
But Biden’s ludicrously entitled “Inflation Reduction Act” does nothing to strengthen homes and businesses. Its primary aim is to reward Democrat donors, including unions and green energy corporations. How does the mandate of a “union wage” included in the bill help protect Americans against severe storms?
But prosperity really is the solution to global warming. There may or may not be more severe storms this year or the next. Human beings have no control over that. But they can control how well prepared they are for the events — that is, if government leaves them with enough money to do so.
John Stossel explains with examples in his Town Hall article Scientific ‘Integrity’. Excerpts in italics with my bolds.
“Trust the science,” say the media. Polls show that fewer Americans do. There’s good reason for that.
“They don’t trust science because science is increasingly untrustworthy,” says science writer Andrew Follet in my new video. “The only group that trusts science right now is Democrats.” Sixty-four percent of Democrats have “a great deal” of confidence in the scientific community, compared to 34% of Republicans.
Of course, true science — using the scientific method — is important. But that’s not what much of “science” is these days.
Instead, today government science is misused by progressive politicians.
Example 1: Environmental activists want to limit commercial fishing. They want Congress to pass what they call the “Ocean-Based Climate Solutions Act.” It claims climate change is the “greatest threat to America’s national security” and offers a dubious solution: close more of the ocean to commercial fishing.
The administration’s deputy director of Climate, Jane Lubchenco,told Congress thata scientific paper concludes that closing more of the ocean can actually increase catches of fish.
Really? That doesn’t seem logical. It isn’t. The paper was retracted. One scientist called its logic “biologically impossible.” Also, Lubchenco’s didn’t tell Congress that the paper was written by her brother-in-law! And edited by her!
Did the White House punish Lubchenco for her ethics violations?No. In fact, after her testimony, she was appointed co-head of President Joe Biden’s Scientific Integrity Task Force!
Last week, the National Academy of Sciences banned her for five years. Yet she’s still on the White House’s Scientific Integrity Task Force.
Sadly, much of what’s called science today is simply left-wing advocacy.
“New fields like fat studies, African studies, Latinx studies, queer studies,” says Follet, “are essentially entirely fake.” Fake? Well, they must be. “Experts” in those fields keep being fooled by people who submit gibberish.
Example 2: Fat Studies
A ridiculous paper, “Embracing Fatness as Self-Care in the Era of Trump,” was accepted by Massey University’s “Fat Studies” conference. The conference then invited the paper’s author, “Sea Matheson,” to speak.
Attendees gave Matheson’s speech rave reviews, praising the paper’s description of Donald Trump’s “fatphobia” and inviting Matheson to review other work submitted to their “scientific” journal, Fat Studies: An Interdisciplinary Journal of Body Weight and Society.
But Matheson is no scientist. “She” is actually comedian Steven Crowder, who disguised himself as an overweight woman to expose “ivory tower quackery.”
Crowder is just the latest person to fool today’s so-called science journals. James Lindsay, Peter Boghossian and Helen Pluckrose submitted nonsense papers to “grievance studies” journals like Fat Studies, Sexuality & Culture and Sex Roles.
Seven accepted ridiculous papers.
One that took a section of “Mein Kampf” but replaced references to “National Socialism” with “feminism,” was accepted by Affilia: Journal of Women and Social Work.
Gender, Place and Culture accepted a paper that claimed there is rape culture at dog parks.
Follett blames this perversion of science on government. Its science agencies, like much of America, have been taken over by leftists hungry to promote themselves and their agenda.
In science, the way to promote yourself is to get papers published. That often gets you more funding. Government agencies like the National Science Foundation provide most of that funding.
“Nobody wants to publish something that goes against the paymaster,” says Follett. “You don’t get published unless the NSF likes your results.”
Example 3: The NSF gave nearly half a million dollars to a team that wrote a paper questioning glacier science because it “stems from knowledge created by men.”
Absurdities are pushed by the right, too. .Some people still claim that man plays no part in climate change or that the climate isn’t warming at all. Some say vaccines don’t work. But the right’s junk science doesn’t get backed by government funds.
I’m angry that my tax dollars go to support leftist nonsense.
Unfortunately, most Americans don’t care. That’s probably because they don’t know that government throws so much money at ridiculous progressive advocacy.
“We’ll all start caring when the bridges start falling down and the planes start crashing,” says Follet. “That’s the inevitable end result of this.”
H/T to Ghengis for reminding me of this insightful analysis of the climatist ideology. The GWPF publication is here: GLOBAL WARMING A case study in groupthink My transcript of the video is below in italics with my bolds and added images.
For most of the last 30 years climate change has been called settled science. As letters, observations and scientific advances have shed more light on the problem, it became clear that many of the most alarming and urgent fears about the effects of global warming were unfounded.
These dramatic stories were not just the work of fringe activists. World leaders and internationally renowned scientists too often departed from science to speculate about how terrible the future would be.
“Heat waves, droughts, wildfires, floods all are now more frequent and more intense.” -Obama
But when the truth of these stories was discovered very few politicians attempted to bring a sense of calm or reason to the political debate.
“Global warming is man-made and it’s happening. We’re all agreed that climate change is one of the greatest and most daunting challenges of our age.”
“The scientific reality is compelling us to act. We are on the course for a very, very dangerous world over the next century.”
“The scientific evidence is stronger than ever, and science itself has been slow to correct alarmist claims.”
“Human influence on the climate system is clear.” (IPCC)
Even worse attempts to question the scientific basis of scare stories has been met with hostility.
“We don’t need another meeting of the Flat Earth Society. We need to get on and tackle climate change.”
Given the emphasis placed on science, data and evidence in the debate, how is this possible?
One answer might be a theory formulated in 1972 by psychologist Irving Janus. He argued that groupthink occurs when a single-minded group dominates a decision-making process, excluding alternative perspectives and criticism. Janus discovered that groupthink was the cause of many catastrophic failures of military planning. Groupthink theory is the basis of a new report by Christopher Booker for the Global warming Policy Foundation
Booker looks at the history of climate change consensus building, policymaking and coverage of the issue in the media. Three rules of groupthink emerge from this historical view. Booker finds that though a consensus on the role of anthropogenic global warming did emerge, this consensus was not dominant in official thinking and coverage. Scientists as well as politicians, campaigners and journalists told stories that owed much more to speculation than to settled science.
“We have built a society, an agricultural system and cities. And everything that we do based on assumptions that basically the climate is not going to change. Eventually this is going to be a problem that is so large that we will transition . . .”
“But after damaging scandals at East Anglia University and the UN’s Intergovernmental Panel on Climate Change, it is Mr Miliband’s side who need to change their approach.”
These unfounded stories cost serious setbacks for the climate agenda.
“Or we can choose to believe in the overwhelming judgment of science and act before it’s too late.” (Obama)
Increasingly in cases where mainstream thinking was shown to be wrong, it was defended from criticism not on its scientific merits but on the basis of the scientific consensus that climate change is real, is happening and will be dangerous.
“But they’re wasting everybody’s time on a settled debate. Climate change is a fact.” (Obama)
“Of the scientists who expressed a view, ninety-seven percent said that climate change was happening and it was human-made activity.”
“Certainly of course that has been substantially discredited.” (Hugh Mathers)
“Isn’t it exactly the stifling of dissent that has got the climate scientists into this mess in the first place? Why are you going down this road again?”
“Oh, I’m not trying to stifle dissent, Krishnan, but you’ve got to make the judgment: When there’s a mistake does it undermine the basic facts about climate science?”
Even where criticism of alarmism has come from inside the consensus it was excluded from public debate rather than allowed to improve scientific understanding. Consequently without debate, climate change became the explanation for ever more things from poverty, migration, to war and even mental illness.
“There are a number of statements that have been attributed to me that are not correct. I don’t believe I called anybody here a denier, and yet that’s been stated over and over again. So I’ve been misrepresented quite a bit today by several.” (Michael Mann)
“But it’s in your written testimony. I’ll read it again.” (Judith Curry)
The growing distance between climate stories and reality led to increasingly hostile public campaigns against dissenting opinions.
Scientists openly criticizing climate change alarmism have been forced into silence under the threat of losing their jobs. Dissent in the media has led to campaigns to remove skeptics from public attention and for increasing control over the media.
“I complained about this article and have just heard from the media self regulator that they found nothing wrong at all with the newspaper article. And so I wrote to them and complained. I complained to the Press Complaints Commission there have even been calls for climate skeptics to face criminal prosecution and even the death penalty.”
“Right kids, just before you go, there’s a brilliant idea in the air that I’d like to run by you . . .”
The insistence that everyone in the public sphere must adhere to the consensus has harmed research, political debate and journalistic coverage of climate change. The result of such climate change groupthink may be the least scrutinized, most expensive and counterproductive policies ever conceived. To find out more about how groupthink has been confused for the scientific consensus on climate change download the report from the G WPF website.
The terms “red pill” and “blue pill” refer to a choice between the willingness to learn a potentially unsettling or life-changing truth by taking the red pill or remaining in contented ignorance with the blue pill. The terms refer to a scene in the 1999 film The Matrix. Sash Stone applies the metaphor in discussing American perceptions of socio-political reality in her substack article The Raid that Red-Pilled America. Excerpts in italics with my bolds.
No one who watches Joe and Mika or Rachel Maddow or reads the New York Times will ever be red-pilled. They simply believe that is the only reality. How could it not be if every high-status person in America is going along with it? If your friends and family go along with it, if your social media feed confirms it every day with links. If it’s in the media, it must be true, right? How do you not trust it if it’s on NBC News or the Washington Post?
Waking up to the media’s near-total collapse during the Trump years is a big part of being red-pilled. Once you see it, you can’t unsee it. The only way to escape the media’s hold on the narrative is to cut it out completely, at least until you can see that there is another reality, and very often, the actual truth.
If they hadn’t already given up on the “establishment” by watching them crush Bernie Sanders like a bug in 2016, 2020 would do it. The response to COVID was a big one. Dividing the country the way it did into the compliant and the non-compliant. What it did to businesses, to the minds of children, to everyone who was locked down and locked in – unable to attend funerals, weddings, and death beds.
But the raid on Mar-a-Lago very likely has red-pilled Americans even more, especially when you put it together with the authoritarianism during COVID, the suppression of speech, the silencing of dissent, and the dehumanization we all live with every day.
To watch our Department of Justice raid a former president’s home months before the midterms, where the Democrats were expected to do very badly, looks suspect to anyone. If they were trying to create distrust in our institutions, they succeeded.
Most Americans have seen, maybe for the first time, that our government has become too powerful, too punitive, and too authoritarian in crushing dissenting voices and outsiders who challenge that authority. We call that being red-pilled.
More worrisome is the ongoing mass hysteria that started on Twitter, spread into our institutions of power, and now has spread to our government. To have such a complicit and compliant media is even more terrifying. What wouldn’t they go along with by now? Gulags?
We all thought “cancel culture” would be confined to social media but clearly it has become the modus operandi for our establishment government. It’s hard not see this as yet another extension of the insanity and hysteria over Trump.
The Mar-a-Lago raid on its own would have one thing. But it comes right after Merrick Garland announced the “largest investigation in American history” against a former president. That came on the heels of prime-time hearings that aired on every news network except Fox, led by Liz Cheney, where they compared January 6th to the end of slavery and the Jim Crow South. This, after Kamala Harris, compared January 6th to Pearl Harbor and 9/11.
A red-pilled America is probably starting to think the reaction to Trump, rather than Trump himself, might be the even bigger threat.
Instead of bringing more voters in, the administrative state has now red-pilled even more Americans. . . It’s likely that many of these voters agree with Rep. Mayra Flores (R-Texas) who responded to the Mar-a-Lago search thus: “The FBI raid on the residence of the former POTUS is unprecedented. We do not live in a third world country.”
Whether the newly red-pilled Americans will become GOP voters or whether they will support Trump at all remains an open question. But many of them will be coming out of August 8th with a high distrust for a government that would use the Department of Justice to sabotage its political enemies.
The media has long since lost touch with reality.
They listen to Twitter, not the American public. For too long now, the Biden administration has been taking its cues from the wrong people. They think if it makes Joy Behar happy, it’s worth doing. They think it’s the right move if Rob Reiner approves on Twitter. Twitter is a small pond with way too many big fish driving ongoing hysteria and preventing the Democrats from focusing on the problems of average Americans.
Chasing Trump for six years based on one mass hysteria event after another has destroyed the Democratic Party and possibly our Department of Justice. Just because they can indict Trump on some procedural error doesn’t mean they should.
The problem with mass hysteria is that it often leads to the dehumanization of whole groups of people. While most see it as more of a physical affliction, like coughing fits or laughing disease, it can also work when a threat spreads quickly in a tight-knit community. Think about a snake slithering into a tent. The more who are connected, the faster the hysteria spreads.
The hysteria only ends when they’ve gotten rid of the bad thing. That is why we watched person after person purged and persecuted from their jobs, Hollywood, and social media all through the Trump years, a practice that continues to this day. In 2016 there are more people online and connected than ever before. In 2020, even more people were online and connected.
Dehumanization is the red line we should never cross, not necessarily because of what it does to other people, but because of what it does to ourselves, nothing less than the total destruction of the human soul.
There were no real witches in Salem, America is not corrupt to its core with “white supremacy,” and Trump is not an omnipotent Super Villain. We’re all just human beings, flaws and all. Trump is still the same gadfly from the 1980s whose fame revolved around his opulent lifestyle.
There is nothing left of the Trump hunters. They have been destroyed by their addiction. It defines who they are now and defines what they are. For people who have everything – money, culture, art museums, every major corporation in the country, all Big Tech platforms were undone by their need to destroy one man.
Americans are looking at the January 6th committee hearings, and now, with the raid on Mar-a-Lago and thinking, do they not trust their own candidates or policies to win in November? Why are they so worried the people will vote for Trump instead? Shouldn’t they be fixing themselves rather than trying to take out their opponent before he’s even announced he’s running?
I never thought anything could shake my faith and loyalty to the Democratic Party. I trusted them. I believed in them. That doesn’t mean I think the Republican Party is any better, but they don’t control everything as the Democrats do.
They will probably indict Trump. That will mark the last gasp of their collapsing empire. The red pills will be eaten like candy. No American will ever see them the same way again.
I am not MAGA. I am not a Conservative. My friends and family do not understand why I care about Trump and his supporters. They want me to join them in their hatred. They want me to be inside the same group hysteria as they are. I know where they’re coming from. I used to be among them. I did everything they’re doing now.
But the red pill is a powerful one. Once you find your way out of the bubble of hysteria on the Left, it feels more like normal life. People are people again. And that, my friends, is worth waking up for.
Another red-pill moment?
Postscript
In response to Michael’s question in his comment, “Where’s the science in this matter?”
“Truth” is a verbal representation of what is or what has happened. Truth does not care whether you believe it or not. It will not argue with you. It will simply hit you between the eyes when you ignore or deny it enough times. For example, if you have no income and you keep spending money, eventually your credit card will be rejected. It’s not complicated; it’s just a fact. It’s not my truth or your truth. It is the truth. In this vein, we must consider the seizure of documents from Mar-a-Lago. There are four classes of material.
The first is the simplest. Donald Trump works at Mar-a-Lago while he’s there, so he has created work-related documents. Those are properly his and should never have been taken. They aren’t covered by the Presidential Records Act and aren’t classified security documents.
Second are his passports. As president, he had both a personal and a diplomatic passport. Those are his unless he is required to surrender them by a Court or the State Department.No such orders have been given and, should he be required to surrender them, the Mar-a-Lago raid would look like kicking over a sand castle on a beach.
The third class is security-related documents. Here’s where things get interesting. If Trump took classified documents with him and did not store them properly, then it is possible to suggest that there might be a security violation.
But…
In 1988, the Supreme Court, in Navy v. Egan, declared that the President’s control over classified documents is absolute:
“The President, after all, is the “Commander in Chief of the Army and Navy of the United States.” U.S.Const., Art. II, § 2. His authority to classify and control access to information bearing on national security and to determine whether an individual is sufficiently trustworthy to occupy a position in the Executive Branch that will give that person access to such information flows primarily from this constitutional investment of power in the President, and exists quite apart from any explicit congressional grant.
This is also a direct reference to Article II, Section 1 of the Constitution. “The executive Power shall be vested in a President of the United States of America.”
In short, the Constitution granted President Trump complete authority to classify or declassify anything he wanted. No one had any legal authority to question him. He was not required to follow any procedure. His standing order that any materials he removed from the Oval Office were deemed declassified was both fully effective and unquestionable. He had “plenary authority.”
There is only one possibility regarding any materials taken from the White House before noon on January 20, 2021. Unless Donald Trump rescinded his standing order, all those documents were, in fact, declassified the moment they left the Oval Office.
Thus, any Espionage Act charge relating to documents at Mar-a-Lago is bogus.
As President Trump said, “All the documents were declassified.”
As for the movers, they are required to be gone with all the outgoing President’s belongings, mementos, and whatever before noon. Put bluntly, if Trump didn’t get it out of the White House by noon, he didn’t have it at Mar-a-Lago, and that means that any papers fell under his standing declassification order. Game, set, and match.
The final question is whether Trump had documents that the Presidential Records Act says belong to the National Archives. While that’s possible, 45 has been very cooperative on that count. When the movers took things out of the White House, it’s quite likely that they scooped up some items that fit into that description. On an earlier DOJ visit to Mar-a-Lago, some of these things were identified and handed over without objection. And as The Donald has noted, all they had to do was ask. For National Archives issues, a simple phone call would work. Trump’s personal work and passports don’t fall under any form of request or excuse. So, what’s going on?
I can’t read the alleged mind of anyone on the Left, so here comes my best guess. Sleepy Joe’s puppet masters realized that their attempt to use the January 6 circus to paint Trump as an insurrectionist was failing. So, they needed to find a way to soil him so badly that his base would reject him. “Under investigation” would be the magic words. But they forgot a key item.
First, as I’ve noted above, Trump did nothing illegal. Second, they tried multiple investigations. Russiagate flopped. Then, an investigation into a routine phone call resulted in a sham impeachment. Finally, when bad actors crashed Biden’s Electoral College party, the Left gave Trump credit. But in every case, the Left failed.