2022 Hurricane Season Winding Down

The Atlantic hurricane season runs from June 1 through Nov. 30.  The official peak of the season was Sept. 10; Hurricane Ian made landfall on September 27. The season ends November 30 and in the past 172 years, only 13 tropical storms and 7 hurricane landfalls have occurred in the continental U.S. on or after October 27.

2022 Accumulated Cyclone Energy [ACE], updated October 31, 2022 by Dr. Ryan Maue *Yearly climatology from historical 1991-2020 Tropical cyclone best track datasets  Source: Global Tropical Cyclone Activity 

The chart shows NH is below a normal YTD, the difference being an unusually quiet Western Pacific.  Elsewhere, the activity is around 90% YTD.

The North Atlantic 2022 year to date (YTD) update by Dr. Maue includes 13 storms, 11 named, with three in October.

Alex 01L (60, ACE= 2.8325, June)
Bonnie 02L (50, ACE= 2.6525, June)
Colin 03L (35, ACE= 0.49, July)
PTC Four 04L (30, ACE= 0.0, July)
Danielle 05L (80, ACE= 12.545, Sep)
Earl 06L (90, ACE= 14.2225, Sep)
Fiona 07L (115, ACE= 26.2825, Sep)
Gaston 08L (55, ACE= 5.205, Sep)
Hermine 10L (35, ACE= 0.6125, Sep)
Ian 09L (135, ACE= 17.425, Sep)
TD 12L (30, ACE= 0.0, Oct)
Julia 13L (75, ACE= 2.87, Oct)
Karl 14L (50, ACE= 2.12, Oct)

Fiona and Ian were the two major hurricanes over 100 knots with the highest ACE, followed by Earl and Danielle. Julia was the fifth hurricane, > 64 knots. Nine storms were 5 ACE or less.

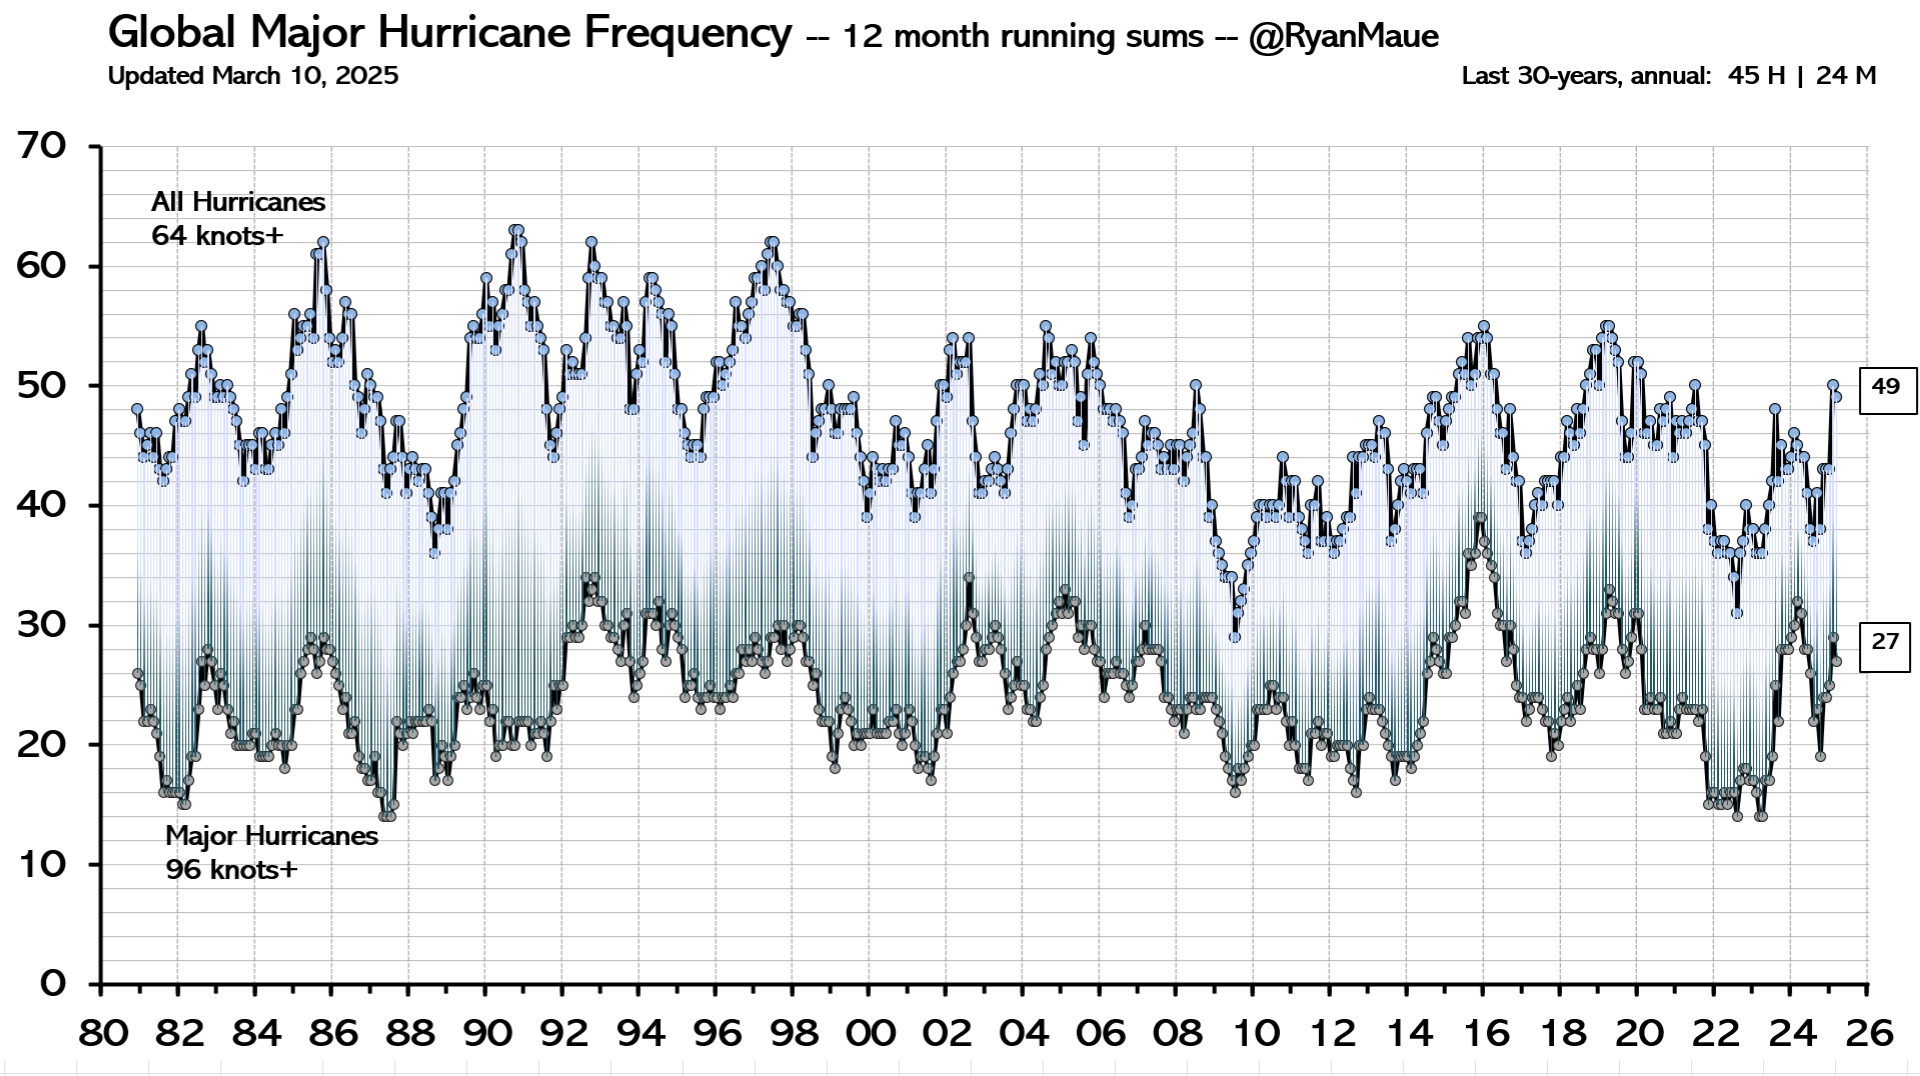
Figure: Global Hurricane Frequency (all & major) — 12-month running sums. The top time series is the number of global tropical cyclones that reached at least hurricane-force (maximum lifetime wind speed exceeds 64-knots). The bottom time series is the number of global tropical cyclones that reached major hurricane strength (96-knots+). Adapted from Maue (2011) GRL.

Background Post How Terrifying will be 2022 Hurricanes?

Jeffrey Folks wrote August 25, 2022, at American Thinker How Terrified Should We Be of Hurricane Season This Year?.  Excerpts in italics with my bolds and added images.

Once again, as nearly every year, officials at NOAA and other agencies called for 2022 to be a “very active” hurricane season. In its May 24 release, NOAA predicted “an “above-average hurricane activity this year — which would make it the seventh consecutive above-average hurricane season.” It’s like the old joke that everyone’s grandkid is “above average”: for some reason, every hurricane season, the risk is now “above average.”

I don’t know how every year can be “above average,” something that defies the laws of statistics. I suspect that it has to do with the strong bias of climate scientists rather than the strength of hurricanes. And in fact, hurricanes have been “fewer than average” this year and for many years recently.

So far, halfway through the hurricane season, no Atlantic storms have made landfall on U.S. soil.

This lack of severe storms defies the dire predictions of global warming alarmists: that rising temperatures will cause catastrophic storms. In reality, one reason why there are fewer and less severe storms this year is that the Atlantic waters have been cooler than usual. That, combined with drier air over the Atlantic, caused by the atmospheric drift of Saharan dust, has caused potential tropical storms to dissipate.

Predictions of “very active” storm seasons are widely publicized each spring, but the reality of fewer and less severe storms never makes its way into the media.

The truth is that some hurricane seasons are more active and some less so. The same is true of tornadoes, droughts, floods, and other natural phenomena. But only the extreme events get publicized and treated as confirmation of climate change. If the media were honest, they would report the truth that the weather has not changed a great deal, at least not since the end of the Little Ice Age in 1850 — and the warmer temperatures since then have been a blessing.

Global temperatures have risen one degree Celsius since the low point of 1850, so severe storms may be somewhat more common than in the distant past. But death rates have dropped precipitously. The worst hurricane in American history was the Great Galveston hurricane of September 8, 1900, which killed some 8,000 people. The worst tornado recorded in U.S. history was the Tri-State Tornado of March 18, 1925, which killed 751 people. Both of these storms occurred long before the period in which alarmists like Al Gore predicted that global warming would cause catastrophic storms — and clearly, they were not “man-made.”

We are safer now because of technology. With advance warning, populations can take shelter or evacuate, and a smartphone or weather radio is all that is necessary to receive warnings. As warning systems become more sophisticated, fewer people will die or be injured by severe weather events. But the development of those systems depends on the ability of individuals to pay for them, and recent government spending will make that less likely — just as it will affect medical research, transportation safety, and police protection.

In addition to the “regular” budget of $5 trillion, this year, Biden has appropriated $7 trillion in emergency spending, much of it for climate change. But that money is not intended to protect us from severe storms. It is being spent on green energy boondoggles that enrich connected insiders but impoverish average citizens. And that impoverishment is the heart of the problem.

With less wealth, it is more difficult to protect oneself against severe weather. Even in years like 2022, which have so far been less active than normal, homeowners must be vigilant if they live along the Atlantic Coast, especially in Florida and other hurricane-prone states. Three months of the hurricane season remain. The odds are that an Atlantic hurricane will strike the East Coast. If a hurricane does make landfall, the media will tout it as proof of the catastrophic effects of global warming. In reality, it will just prove that the climate hasn’t changed much.

Since the destructive 2004 hurricane season, Florida has required all new construction to incorporate tie-down roofing and storm-resistant glass, measures that have made life safer for residents. And since taking office, Gov. Ron DeSantis has maintained storm preparedness and worked to protect citizens of Florida.

But Biden’s ludicrously entitled “Inflation Reduction Act” does nothing to strengthen homes and businesses. Its primary aim is to reward Democrat donors, including unions and green energy corporations. How does the mandate of a “union wage” included in the bill help protect Americans against severe storms?

But prosperity really is the solution to global warming. There may or may not be more severe storms this year or the next. Human beings have no control over that. But they can control how well prepared they are for the events — that is, if government leaves them with enough money to do so.

See also Hurricanes Unrelated to CO2

Integrated Storm Activity Annually over the Continental U.S. (ISAAC)

How Terrifying will be 2022 Hurricanes?

Jeffrey Folks writes at American Thinker How Terrified Should We Be of Hurricane Season This Year?.  Excerpts in italics with my bolds and added images.

Once again, as nearly every year, officials at NOAA and other agencies called for 2022 to be a “very active” hurricane season. In its May 24 release, NOAA predicted “an “above-average hurricane activity this year — which would make it the seventh consecutive above-average hurricane season.” It’s like the old joke that everyone’s grandkid is “above average”: for some reason, every hurricane season, the risk is now “above average.”

I don’t know how every year can be “above average,” something that defies the laws of statistics. I suspect that it has to do with the strong bias of climate scientists rather than the strength of hurricanes. And in fact, hurricanes have been “fewer than average” this year and for many years recently.

So far, halfway through the hurricane season, no Atlantic storms have made landfall on U.S. soil.

This lack of severe storms defies the dire predictions of global warming alarmists: that rising temperatures will cause catastrophic storms. In reality, one reason why there are fewer and less severe storms this year is that the Atlantic waters have been cooler than usual. That, combined with drier air over the Atlantic, caused by the atmospheric drift of Saharan dust, has caused potential tropical storms to dissipate.

Predictions of “very active” storm seasons are widely publicized each spring, but the reality of fewer and less severe storms never makes its way into the media.

The truth is that some hurricane seasons are more active and some less so. The same is true of tornadoes, droughts, floods, and other natural phenomena. But only the extreme events get publicized and treated as confirmation of climate change. If the media were honest, they would report the truth that the weather has not changed a great deal, at least not since the end of the Little Ice Age in 1850 — and the warmer temperatures since then have been a blessing.

Global temperatures have risen one degree Celsius since the low point of 1850, so severe storms may be somewhat more common than in the distant past. But death rates have dropped precipitously. The worst hurricane in American history was the Great Galveston hurricane of September 8, 1900, which killed some 8,000 people. The worst tornado recorded in U.S. history was the Tri-State Tornado of March 18, 1925, which killed 751 people. Both of these storms occurred long before the period in which alarmists like Al Gore predicted that global warming would cause catastrophic storms — and clearly, they were not “man-made.”

We are safer now because of technology. With advance warning, populations can take shelter or evacuate, and a smartphone or weather radio is all that is necessary to receive warnings. As warning systems become more sophisticated, fewer people will die or be injured by severe weather events. But the development of those systems depends on the ability of individuals to pay for them, and recent government spending will make that less likely — just as it will affect medical research, transportation safety, and police protection.

In addition to the “regular” budget of $5 trillion, this year, Biden has appropriated $7 trillion in emergency spending, much of it for climate change. But that money is not intended to protect us from severe storms. It is being spent on green energy boondoggles that enrich connected insiders but impoverish average citizens. And that impoverishment is the heart of the problem.

With less wealth, it is more difficult to protect oneself against severe weather. Even in years like 2022, which have so far been less active than normal, homeowners must be vigilant if they live along the Atlantic Coast, especially in Florida and other hurricane-prone states. Three months of the hurricane season remain. The odds are that an Atlantic hurricane will strike the East Coast. If a hurricane does make landfall, the media will tout it as proof of the catastrophic effects of global warming. In reality, it will just prove that the climate hasn’t changed much.

Since the destructive 2004 hurricane season, Florida has required all new construction to incorporate tie-down roofing and storm-resistant glass, measures that have made life safer for residents. And since taking office, Gov. Ron DeSantis has maintained storm preparedness and worked to protect citizens of Florida.

But Biden’s ludicrously entitled “Inflation Reduction Act” does nothing to strengthen homes and businesses. Its primary aim is to reward Democrat donors, including unions and green energy corporations. How does the mandate of a “union wage” included in the bill help protect Americans against severe storms?

But prosperity really is the solution to global warming. There may or may not be more severe storms this year or the next. Human beings have no control over that. But they can control how well prepared they are for the events — that is, if government leaves them with enough money to do so.


See also Hurricanes Unrelated to CO2

Integrated Storm Activity Annually over the Continental U.S. (ISAAC)


All About Hurricanes

And there is the University of Miami Hurricanes sports team logo:

But many are interested in what to make of the latest one, Hurricane Ida.  She did after all flood the US Open tennis venue one night, although matches resumed the next day.

And in Louisiana, the flooding was major, although the new dikes in New Orleans held.

Of course the media, always certain of their story and impervious to contrary facts and details, declared Ida proof positive of a climate “emergency.”

Some anonymous scribbler put the PC words in Biden’s mouth:

Scientists have warned about extreme weather “for decades” and the U.S. doesn’t have “any more time” to confront it, he said.  “Every part of the country is getting hit by extreme weather, and we’re now living in real time what the country’s going to look like,” Biden told reporters.  Hurricane Ida Is An ‘Opportunity’ to Act on ‘Global Warming’ – ‘We either act or we’re going to be in real, real trouble’.

So what to make of these storms and the threat of global warming climate change?

Firstly,these storms are dangerous.  As the joke goes:

Q: Why are storms named after women?
A: Because they come in hot and steamy, then they leave with your house and car.

Of course, this is now considered sexist, in spite of the traditional respect for women as forces of nature.  In fact, nowadays in the age of genderism, some parents name their newborns “Storm” in order to leave their kids’ options open.  But I digress.

This post is really about understanding tropical storms in their historical context.  And for that we have an excellent recent scientific study published in Nature Changes in Atlantic major hurricane frequency since the late-19th century. by Vecchi, Landsea et al. Excerpts in italics with my bolds.

Introduction

Tropical cyclones (TCs) are of intense scientific interest and are a major threat to human life and property across the globe. Of particular interest are multi-decadal changes in TC frequency arising from some combination of intrinsic variability in the weather and climate system, and the response to natural and anthropogenic climate forcing.  Even though the North Atlantic (NA) basin is a minor contributor to global TC frequency, Atlantic hurricanes (HUs) have been the topic of considerable research both because of the long-term records of their track and frequency that exist for this basin, and because of their impacts at landfall. It is convenient and common to consider Saffir-Simpson Categories 3–5 (peak sustained winds exceeding 50 ms−1) HUs separately from the overall frequency, and label them major hurricanes, or MHs. Historically, MHs have accounted for ~80% of hurricane-related damage in the United States of America (USA) despite only representing 34% of USA TC occurrences.

Globally, models and theoretical arguments indicate that in a warming world the HU peak intensity and intensification rate should increase, so that there is a tendency for the fraction of HU reaching high Saffir-Simpson Categories (3, 4, or 5) to increase in models in response to CO2 increases, yet model projections are more mixed regarding changes in the frequency of MHs in individual basins.

Has there been a century-scale change in the number of the most intense hurricanes in the North Atlantic?

Due to changes in observing practices, severe inhomogeneities exist in this database, complicating the assessment of long-term changes.  In particular, there has been a substantial increase in monitoring capacity over the past 170 years, so that the probability that a HU is observed is substantially higher in the present than early in the record; the recorded increase in both Atlantic TC and HU frequency in HURDAT2 since the late-19th century is consistent with the impact of known changes in observing practices. Major hurricane frequency estimates can also be impacted by changing observing systems

Hurricane and major hurricane frequency adjusted for missing storms

Previous work has led to the development of a number of methods to estimate the impact of changing observing capabilities on the recorded increase in basin-wide HU frequency between 1878 and 2008 (ref. 10). We here update the analysis of ref. 10 to build an adjustment to recorded HU counts over 1851–1971, based on the characteristics of observed HUs over 1972–2019. We then extend that methodology to build an adjustment to recorded MH counts over 1851–1971, based on MHs recorded over 1972–2019 (see “Methods”).

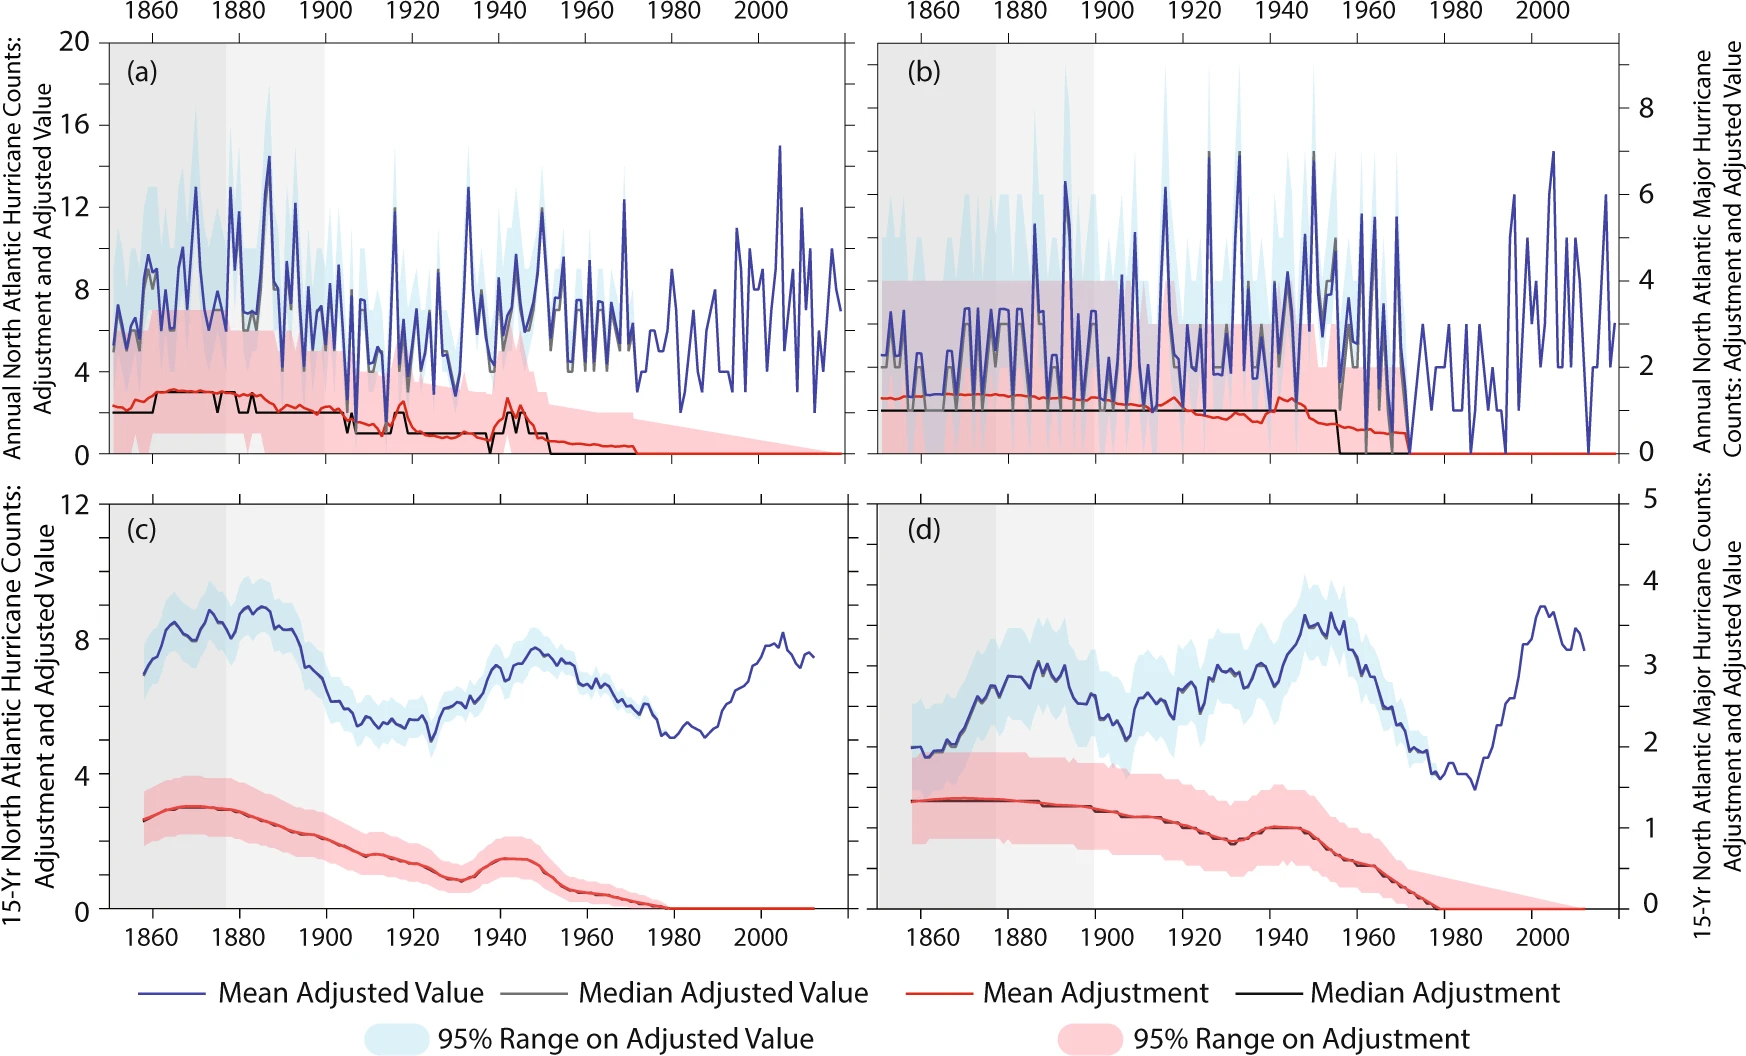
Once the adjustment is added to the recorded number of Atlantic HUs and MHs, substantial year-to-year and decade-to-decade variability is still present in the data, with the late-19th, mid-20th and early-21st centuries showing relative maxima, and the early 20th and late 20th centuries showing local minima (Fig. 2). However, after adjustment, the recent epoch (1995–2019) does not stand out as unprecedented in either basin-wide HU or MH frequency. There have been notable years since 2000 in terms of basin-wide HU frequency, but we cannot exclude at the 95% level that the most active years in terms of NA basin-wide HU or MH frequency occurred in either the 19th century or mid-20th century (blue lines and shading in Fig. 2a, b). Further, we cannot exclude that the most active epoch for NA HU frequency was in the late-19th century, with the mid-20th century comparable to the early-21st in terms of basin-wide HU frequency. The 19th century maximum in activity is more pronounced in overall frequency than in MH frequency, while the late-20th century multi-decadal temporary dip in MH frequency stands out relative to that in the early-20th century.

Ratio of the 15-year running count of United States of America (USA) strikes and 15-year running count of basin-wide frequency for hurricanes (a) and major hurricanes (b). Dotted gray line shows the values based on the recorded version 2 of the North Atlantic Hurricane Database (HURDAT2, ref. 33) frequency, while the thick solid line shows the value based on the HURDAT2 recorded USA strikes and the adjusted basin-wide frequencies; blue shading shows the 95% range on the ratio based on a Bootstrap sampling of the adjustment values. Gray background shading is as in Fig. 1, and highlights times where we have reduced confidence in the basin-wide and USA strike frequency estimates even after adjusting for likely missing storms.

Conclusion

Caution should be taken in connecting recent changes in Atlantic hurricane activity to the century-scale warming of our planet.

The adjusted records presented here provide a century-scale context with which to interpret recent studies indicating a significant recent increase in NA MH/HU ratio over 1980–2017 (ref. 14), or in the fraction of NA tropical storms that rapidly intensified over 1982–2009 (ref. 15). Our results indicate that the recent increase in NA basin-wide MH/HU ratio or MH frequency is not part of a century-scale increase. Rather it is a rebound from a deep local minimum in the 1960s–1980s.

We hypothesize that these recent increases contain a substantial, even dominant, contribution from internal climate variability, and/or late-20th century aerosol increases and subsequent decreases, in addition to any contributions from recent greenhouse gas-induced warming. It has been hypothesized, for example, that aerosol-induced reductions in surface insolation over the tropical Atlantic since between the mid-20th century and the 1980s may have resulted in an inhibition of tropical cyclone activity; the relative contributions of anthropogenic sulfate aerosols, dust, and volcanic aerosols to this signal (each of which would carry distinct implications for future hurricane evolution)—along with the magnitude and impact of aerosol-mediated cloud changes—remain a vigorous topic of scientific inquiry. It has also been suggested that multi-decadal climate variations connected to changes in meridional ocean overturning may have resulted in a minimum in northward heat transport in the Atlantic and a resulting reduction in Atlantic hurricane activity.

Given the uncertainties that presently exist in understanding multi-decadal climate variability, the climate response to aerosols and impact of greenhouse gas warming on NA TC activity, care must be exercised in not over-interpreting the implications of, and causes behind, these recent NA MH increases. Disentangling the relative impact of multiple climate drivers on NA MH activity is crucial to building a more confident assessment of the likely course of future HU activity in a world where the effects of greenhouse gas changes are expected to become increasingly important.


Footnote:

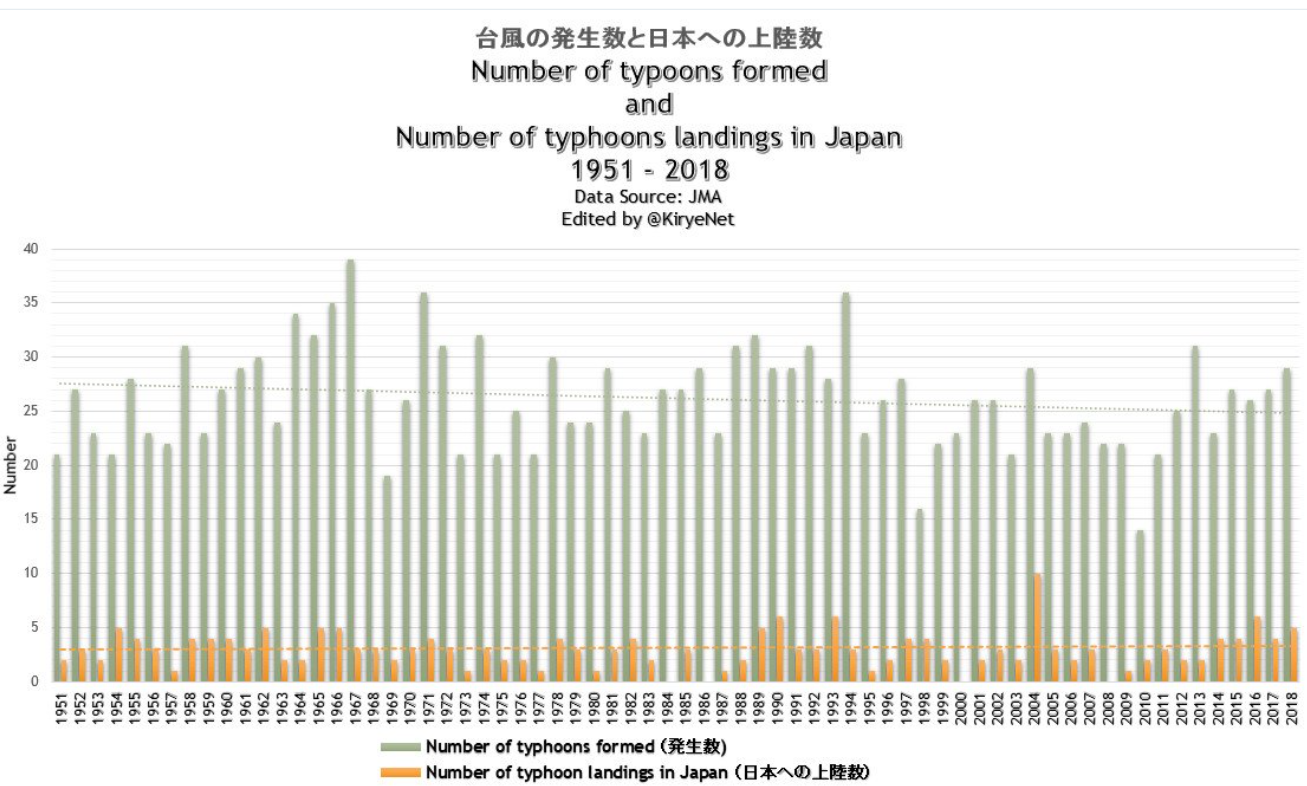
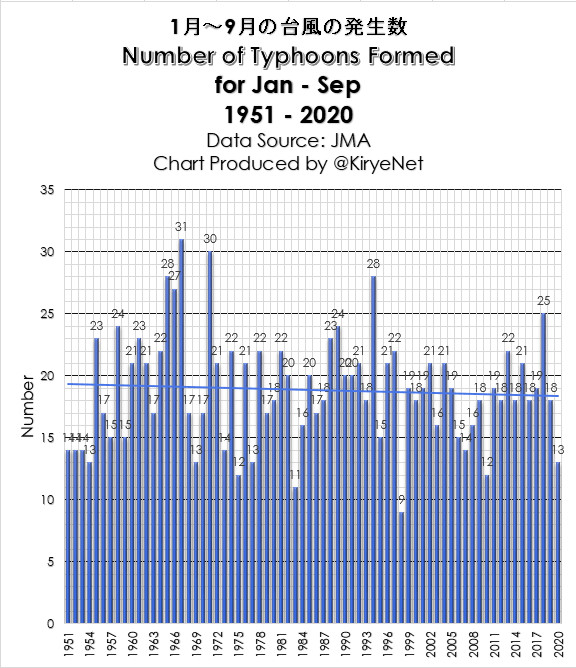
Pacific hurricanes (typhoons) also show no increase with global warming


Hurricane Season Overview Oct. 11

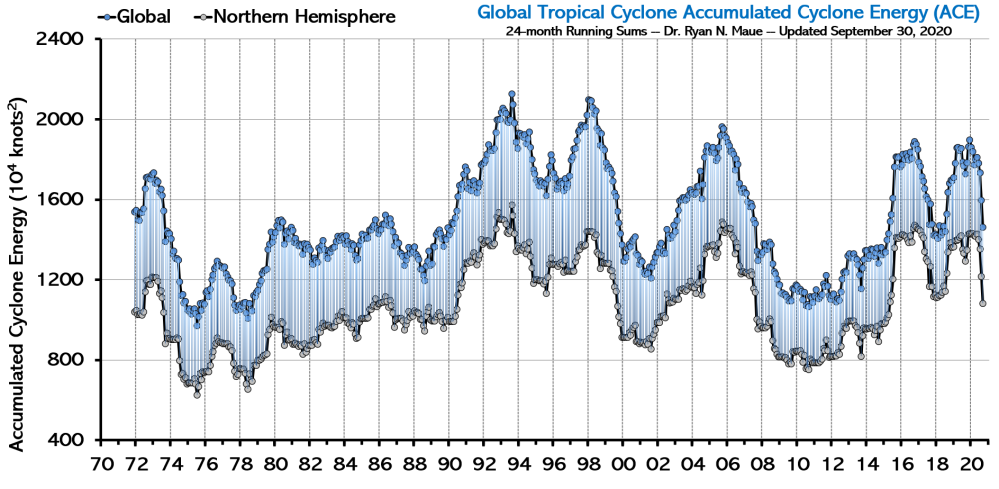
Your weather channel is airing charts like this to show how active is this year’s storm season impacting the Caribbean and US east coast.  So far, there have been many more named storms, two more hurricanes than average, and one less major hurricane at this point in the season.  Dr. Ryan Maue provides (here) a global context for understanding storm activity this year, updated October 11, 2020.

So globally, the ACE (Accumulated Cyclone Energy) is 2/3 of the average 1981-2010 at this point in the season.  ACE compiles the storm strengths as well the the number of storms.  Clearly the North Atlantic is 143% of average, but slightly behind 2019.  This indicates that many of the named storms were not that strong.

Meanwhile the Northern Hemisphere is running 69% of average and well behind last year.  This is due to North Pacific having a quiet season offsetting North Atlantic activity.  See the graph below from RealClimateScience

The historical summary of Tropical Hurricane ACE as of September 30, 2020:

Figure: Last 50-years+ of Global and Northern Hemisphere Accumulated Cyclone Energy: 24 month running sums. Note that the year indicated represents the value of ACE through the previous 24-months for the Northern Hemisphere (bottom line/gray boxes) and the entire global (top line/blue boxes). The area in between represents the Southern Hemisphere total ACE.

The hiatus of storms lasted a decade after 2006 (Thanks Global Warming).  Now seasons are more active (Your fault Global Warming), though somewhat less than previous peaks.   Maybe it’s Mother Nature after all.

Why the Left Coast is Still Burning

Update September 13, 2020:  This reprint of a post two years ago shows nothing has changed, except for the worse.

It is often said that truth is the first casualty in the fog of war. That is especially true of the war against fossil fuels and smoke from wildfires. The forests are burning in California, Oregon and Washington, all of them steeped in liberal, progressive and post-modern ideology. There are human reasons that fires are out of control in those places, and it is not due to CO2 emissions. As we shall see, Zinke is right and Brown is wrong. Some truths the media are not telling you in their drive to blame global warming/climate change. Text below is excerpted from sources linked at the end.

1. The World and the US are not burning.

The geographic extent of this summer’s forest fires won’t come close to the aggregate record for the U.S. Far from it. Yes, there are some terrible fires now burning in California, Oregon, and elsewhere, and the total burnt area this summer in the U.S. is likely to exceed the 2017 total. But as the chart above shows, the burnt area in 2017 was less than 20% of the record set way back in 1930. The same is true of the global burnt area, which has declined over many decades.

In fact, this 2006 paper reported the following:

“Analysis of charcoal records in sediments [31] and isotope-ratio records in ice cores [32] suggest that global biomass burning during the past century has been lower than at any time in the past 2000 years. Although the magnitude of the actual differences between pre-industrial and current biomass burning rates may not be as pronounced as suggested by those studies [33], modelling approaches agree with a general decrease of global fire activity at least in past centuries [34]. In spite of this, fire is often quoted as an increasing issue around the globe [11,26–29].”

People have a tendency to exaggerate the significance of current events. Perhaps the youthful can be forgiven for thinking hot summers are a new phenomenon. Incredibly, more “seasoned” folks are often subject to the same fallacies. The fires in California have so impressed climate alarmists that many of them truly believe global warming is the cause of forest fires in recent years, including the confused bureaucrats at Cal Fire, the state’s firefighting agency. Of course, the fires have given fresh fuel to self-interested climate activists and pressure groups, an opportunity for greater exaggeration of an ongoing scare story.

This year, however, and not for the first time, a high-pressure system has been parked over the West, bringing southern winds up the coast along with warmer waters from the south, keeping things warm and dry inland. It’s just weather, though a few arsonists and careless individuals always seem to contribute to the conflagrations. Beyond all that, the impact of a warmer climate on the tendency for biomass to burn is considered ambiguous for realistic climate scenarios.

2. Public forests are no longer managed due to litigation.

According to a 2014 white paper titled; ‘Twenty Years of Forest Service Land Management Litigation’, by Amanda M.A. Miner, Robert W. Malmsheimer, and Denise M. Keele: “This study provides a comprehensive analysis of USDA Forest Service litigation from 1989 to 2008. Using a census and improved analyses, we document the final outcome of the 1125 land management cases filed in federal court. The Forest Service won 53.8% of these cases, lost 23.3%, and settled 22.9%. It won 64.0% of the 669 cases decided by a judge based on cases’ merits. The agency was more likely to lose and settle cases during the last six years; the number of cases initiated during this time varied greatly. The Pacific Northwest region along with the Ninth Circuit Court of Appeals had the most frequent occurrence of cases. Litigants generally challenged vegetative management (e.g. logging) projects, most often by alleging violations of the National Environmental Policy Act and the National Forest Management Act. The results document the continued influence of the legal system on national forest management and describe the complexity of this litigation.”

There is abundant evidence to support the position that when any forest project posits vegetative management in forests as a pretense for a logging operation, salvage or otherwise, litigation is likely to ensue, and in addition to NEPA, the USFS uses the Property Clause to address any potential removal of ‘forest products’. Nevertheless, the USFS currently spends more than 50% of its total budget on wildfire suppression alone; about $1.8 billion annually, while there is scant spending for wildfire prevention.

3. Mega fires are the unnatural result of fire suppression.

And what of the “mega-fires” burning in the West, like the huge Mendocino Complex Fire and last year’s Thomas Fire? Unfortunately, many decades of fire suppression measures — prohibitions on logging, grazing, and controlled burns — have left the forests with too much dead wood and debris, especially on public lands. From the last link:

“Oregon, like much of the western U.S., was ravaged by massive wildfires in the 1930s during the Dust Bowl drought. Megafires were largely contained due to logging and policies to actively manage forests, but there’s been an increasing trend since the 1980s of larger fires.

Active management of the forests and logging kept fires at bay for decades, but that largely ended in the 1980s over concerns too many old growth trees and the northern spotted owl. Lawsuits from environmental groups hamstrung logging and government planners cut back on thinning trees and road maintenance.

[Bob] Zybach [a forester] said Native Americans used controlled burns to manage the landscape in Oregon, Washington and northern California for thousands of years. Tribes would burn up to 1 million acres a year on the west coast to prime the land for hunting and grazing, Zybach’s research has shown.

‘The Indians had lots of big fires, but they were controlled,’ Zybach said. ‘It’s the lack of Indian burning, the lack of grazing’ and other active management techniques that caused fires to become more destructive in the 19th and early 20th centuries before logging operations and forest management techniques got fires under control in the mid-20th Century.”

4. Bad federal forest administration started in 1990s.

Bob Zybach feels like a broken record. Decades ago he warned government officials allowing Oregon’s forests to grow unchecked by proper management would result in catastrophic wildfires.

While some want to blame global warming for the uptick in catastrophic wildfires, Zybach said a change in forest management policies is the main reason Americans are seeing a return to more intense fires, particularly in the Pacific Northwest and California where millions of acres of protected forests stand.

“We knew exactly what would happen if we just walked away,” Zybach, an experienced forester with a PhD in environmental science, told The Daily Caller News Foundation.

Zybach spent two decades as a reforestation contractor before heading to graduate school in the 1990s. Then the Clinton administration in 1994 introduced its plan to protect old growth trees and spotted owls by strictly limiting logging.  Less logging also meant government foresters weren’t doing as much active management of forests — thinnings, prescribed burns and other activities to reduce wildfire risk.

Zybach told Evergreen magazine that year the Clinton administration’s plan for “naturally functioning ecosystems” free of human interference ignored history and would fuel “wildfires reminiscent of the Tillamook burn, the 1910 fires and the Yellowstone fire.”

Between 1952 and 1987, western Oregon saw only one major fire above 10,000 acres. The region’s relatively fire-free streak ended with the Silver Complex Fire of 1987 that burned more than 100,000 acres in the Kalmiopsis Wilderness area, torching rare plants and trees the federal government set aside to protect from human activities. The area has burned several more times since the 1980s.

“Mostly fuels were removed through logging, active management — which they stopped — and grazing,” Zybach said in an interview. “You take away logging, grazing and maintenance, and you get firebombs.”

Now, Oregonians are dealing with 13 wildfires engulfing 185,000 acres. California is battling nine fires scorching more than 577,000 acres, mostly in the northern forested parts of the state managed by federal agencies.

The Mendocino Complex Fire quickly spread to become the largest wildfire in California since the 1930s, engulfing more than 283,000 acres. The previous wildfire record was set by 2017’s Thomas Fire that scorched 281,893 acres in Southern California.

While bad fires still happen on state and private lands, most of the massive blazes happen on or around lands managed by the U.S. Forest Service and other federal agencies, Zybach said. Poor management has turned western forests into “slow-motion time bombs,” he said.

A feller buncher removing small trees that act as fuel ladders and transmit fire into the forest canopy.

5. True environmentalism is not nature love, but nature management.

While wildfires do happen across the country, poor management by western states has served to turn entire regions into tinderboxes. By letting nature play out its course so close to civilization, this is the course California and Oregon have taken.

Many in heartland America and along the Eastern Seaboard often see logging and firelines if they travel to a rural area. This is part and parcel of life outside of the city, where everyone knows that because of a few minor eyesores their houses and communities are safer from the primal fury of wildfires.

In other words, leaving the forests to “nature,” and protecting the endangered Spotted Owl created denser forests––300-400 trees per acre rather than 50-80–– with more fuel from the 129 million diseased and dead trees that create more intense and destructive fires. Yet California spends more than ten times as much money on electric vehicle subsidies ($335 million) than on reducing fuel in a mere 60,000 of 33 million acres of forests ($30 million).

Rancher Ross Frank worries that funding to fight fires in Western communities like Chumstick, Wash., has crowded out important land management work. Rowan Moore Gerety/Northwest Public Radio

Once again, global warming “science” is a camouflage for political ideology and gratifying myths about nature and human interactions with it. On the one hand, progressives seek “crises” that justify more government regulation and intrusion that limit citizen autonomy and increase government power. On the other, well-nourished moderns protected by technology from nature’s cruel indifference to all life can afford to indulge myths that give them psychic gratification at little cost to their daily lives.

As usual, bad cultural ideas lie behind these policies and attitudes. Most important is the modern fantasy that before civilization human beings lived in harmony and balance with nature. The rise of cities and agriculture began the rupture with the environment, “disenchanting” nature and reducing it to mere resources to be exploited for profit. In the early 19thcentury, the growth of science that led to the industrial revolution inspired the Romantic movement to contrast industrialism’s “Satanic mills” and the “shades of the prison-house,” with a superior natural world and its “beauteous forms.” In an increasingly secular age, nature now became the Garden of Eden, and technology and science the signs of the fall that has banished us from the paradise enjoyed by humanity before civilization.

The untouched nature glorified by romantic environmentalism, then, is not our home. Ever since the cave men, humans have altered nature to make it more conducive to human survival and flourishing. After the retreat of the ice sheets changed the environment and animal species on which people had depended for food, humans in at least four different regions of the world independently invented agriculture to better manage the food supply. Nor did the American Indians, for example, live “lightly on the land” in a pristine “forest primeval.” They used fire to shape their environment for their own benefit. They burned forests to clear land for cultivation, to create pathways to control the migration of bison and other game, and to promote the growth of trees more useful for them.

Remaining trees and vegetation on the forest floor are more vigorous after removal of small trees for fuels reduction.

And today we continue to improve cultivation techniques and foods to make them more reliable, abundant, and nutritious, not to mention more various and safe. We have been so successful at managing our food supply that today one person out of ten provides food that used to require nine out of ten, obesity has become the plague of poverty, and famines result from political dysfunction rather than nature.

That’s why untouched nature, the wild forests filled with predators, has not been our home. The cultivated nature improved by our creative minds has. True environmentalism is not nature love, but nature management: applying skill and technique to make nature more useful for humans, at the same time conserving resources so that those who come after us will be able to survive. Managing resources and exploiting them for our benefit without destroying them is how we should approach the natural world. We should not squander resources or degrade them, not because of nature, but because when we do so, we are endangering the well-being of ourselves and future generations.

Conclusion

The annual burnt area from wildfires has declined over the past ninety years both in the U.S. and globally. Even this year’s wildfires are unlikely to come close to the average burn extent of the 1930s. The large wildfires this year are due to a combination of decades of poor forest management along with a weather pattern that has trapped warm, dry air over the West. The contention that global warming has played a causal role in the pattern is balderdash, but apparently that explanation seems plausible to the uninformed, and it is typical of the propaganda put forward by climate change interests.

Sources: 

https://www.frontpagemag.com/fpm/271044/junk-science-and-leftist-folklore-have-set-bruce-thornton

https://www.4baseball.com/westernjournal.com/after-libs-blame-west-coast-fires-on-global-warming-forester-speaks-out/

https://sacredcowchips.net/tag/bob-zybach/

https://www.horsetalk.co.nz/2017/10/13/ecological-imbalance-wildfires-us-rangelands/

http://dailycaller.com/2018/08/08/mismanagement-forests-time-bombs/

Footnote:  So how do you want your forest fires, some small ones now or mega fires later?

Hurricane Hype (Again)

James Taylor explains at climaterealism Miami Herald Misleads Readers About Reassuring NOAA Hurricane Study.  A study finding calmer recent storm seasons was flipped into alarms about global warming/climate change.  Excerpts in italics with my bolds.

Among the top Google News search results this morning for “climate change,” the Miami Herald published an article asserting a new study shows global warming is causing more Atlantic hurricanes. In reality, the new study shows there is a declining trend in hurricanes in many parts of the world and concludes there will likely be a declining trend globally during the 21st century. Moreover, objective data show the number of Atlantic hurricanes is declining, just like the forecast global trend.

The National Oceanic and Atmospheric Administration (NOAA) study referenced by the Herald reports, “our climate models project decreases in the number of global TCs [tropical cyclones] toward the end of the 21st century due to the dominant effect of greenhouse gases on decreasing TC occurrence in most of the tropics, consistent with many previous studies.”

The NOAA study reported a trend of “substantial decreases” in Indian Ocean and North Pacific hurricanes is already detected in the record. The study asserts there has been an increase in Atlantic hurricanes since 1980, which “anthropogenic aerosols could have also influenced.”

The major takeaway from the NOAA study is there will be fewer hurricanes as the world continues its modest warming. That is good news. Rather than reporting good climate news, however, the Herald goes to great lengths to try to pull some bad news from a good-news study.

The only reason the authors of the NOAA study could report an increase in Atlantic hurricanes since 1980 is because the decade ending in 1980 was an abnormally low year, with the fewest number of Atlantic hurricanes on record. So, any trend line starting at the record-low point of 1980 will show more frequent hurricanes. However, a more complete and representative record shows a long-term and ongoing decline in Atlantic hurricanes. The graph below illustrates that point.

Located in Florida, the Miami Herald surprisingly did not mention two very important facts about hurricanes and Florida. As documented in Climate at a Glance: Hurricanes, Florida recently concluded an 11-year period (2005 through 2016) without a landfalling hurricane of any size—the longest such period in recorded history. The Gulf of Mexico also recently benefited from its longest hurricane-free period in recorded history (2013 through 2016).

For completely misleading its readers about the recent NOAA study, and for asserting the exact opposite of the truth regarding hurricane frequency and Atlantic hurricane frequency, the Miami Herald earns a gigantic Pinocchio award.

Footnote:  The 2020 consensus forecast for the coming hurricane season is for an active season (H/T trackthetropics)

GWO’s prediction calls for 16 named storms, 7 hurricanes and 3 to 4 major hurricanes. They note the United States can expect 5 named storms to make landfall, with 2 or 3 hurricane landfalls – one of which will likely be a major category 3 hurricane. Professor David Dilley – senior research scientist for GWO, says several favorable meteorological and climatological factors are in place to produce another above average hurricane season this year. Some of the factors include a 72-year ClimatePulse Hurricane Landfall Enhancement Cycle – coupled with the continuance of above normal warm Atlantic Ocean and Gulf of Mexico water temperatures – and the lack of either a moderate or strong El Niño to subdue the hurricane seasons. Entire forecast: https://www.globalweatheroscillations.com/

Of course, any storm making US landfall is big weather news, and the media is ready.

Blaiming Hurricanes on Global Warming Denies the Facts

James Piereson writes at New Criterion An overblown hypothesis. Excerpts in italics with my bolds.

We are well into hurricane season with a dangerous storm lurking off the coast of Florida and now poised to make a run up the east coast of the United States. As happens every year at this time, the appearance of hurricanes provokes speculation about the role of climate change in the formation of these destructive storms.

Climate change theorists assert that warming ocean temperatures are increasing the number and strength of hurricanes that form and make landfall in the United States. As David Leonhardt writes this week in the New York Times, “The frequency of severe hurricanes in the Atlantic Ocean has roughly doubled over the last two decades, and climate change appears to be the reason.” He cites some statistics to support this conclusion, though his review of the facts is far from thorough.

As he notes, the underlying science holds that hurricanes develop in warm ocean waters in late summer, so that over time rising ocean temperatures will generate rising numbers of hurricanes, and stronger ones as well. According to scientists, average ocean temperatures have increased by about one degree Fahrenheit over the past one hundred to a hundred and fifty years, a finding that provides a foundation for the “hurricane hypothesis.” Thus, we hear the refrain that global warming is causing more storms with higher wind speeds, and that these storms last longer, are more destructive, and make landfall more often than in the past.

It is a plausible hypothesis and, unlike many claims in this area, is capable of being tested against the facts. The evidence for it turns out to be quite thin—at least in relation to the certainty with which it is usually expressed.

Looking at the historical data, one does not find a startling increase in hurricane activity in recent decades, and only modest evidence to suggest that hurricanes in the Atlantic basin are increasing either in number or severity.

The National Hurricane Center, a division of the National Weather Service, has compiled reliable information on hurricanes going back to the middle of the nineteenth century—though the information the nhc collects has grown much more reliable in recent decades with the development of satellite imagery and ever-more sensitive instruments with which to measure the strength and windspeeds of hurricanes. There is no shortage of information to test the claims about increasing hurricane activity.

1. Are hurricanes in the Atlantic Ocean increasing in frequency with the passage of time?

The modern era of hurricane tracking and measurement got underway about 1950. From 1950 through 2018, the Hurricane Research Division (HRD) tells us that on average 6.3 named hurricanes formed per year, with a high of fifteen storms in 2005 (the year of Katrina) and a low of two in 1982 and 2013. A named hurricane is one strong enough to be classified between 1 and 5 on the Saffir-Simpson Hurricane scale. Again, these are storms that formed in the Atlantic, but not all of them made landfall. Broken down decade by decade, the averages look like this:

1950-59: 6.9 per year
1960-69: 6.1 per year
1970-79: 5.0 per year
1980-89: 5.2 per year
1990-99: 6.4 per year
2000-09: 7.4 per year
2010-18: 7.0 per year

Conclusion: There has been a modest increase in the number of hurricanes formed per year since 2000, but these rates are not significantly higher than the long-term average and are very close to the rates experienced in the 1950s.

2. Are more hurricanes making landfall in the United States with the passage of time?

The HRD maintains an accurate list of hurricanes making landfall in the United States going back to 1851 and running through 2018. On average over this hundred-seventy-year period, between one and two hurricanes made landfall per year in the United States. The busiest years for hurricanes since 1950 were 1985, 2004, and 2005, as six named storms made landfall in each of these years. The busiest decade going back to 1850 was the 1940s, when twenty-six hurricanes made landfall; more recently, the busiest decade was between 2000 and 2009, when nineteen hurricanes made landfall.

Average by decade, 1950 to 2018: 15
Average by decade, 1990-2018: 15
Average by decade, 1950-1989: 15

Conclusion: There has been no long-term increase in the number of named hurricanes making landfall in the United States.

3, Are Atlantic hurricanes growing more powerful with the passage of time?

Over the hundred-seventy-year period, just four Category 5 hurricanes (the most powerful of all storms) have made landfall in the United States: The Labor Day hurricane that hit the Florida Keys in 1935; Hurricane Camille, which hit the Gulf coast in 1969; Hurricane Andrew, which hit south Florida in 1992; and Hurricane Michael, which hit Florida and Georgia in 2018. These events appear unrelated to changes in ocean temperatures.

The two most destructive storms to hit the USA occurred in 1900 (Galvaston) and 1926 (Miami), long before the era of rising ocean temperatures.

From 1950 to 2018, an average of 2.7 major hurricanes have formed per year in the Atlantic basin, with highs of eight major hurricanes in 1950 and seven in 2005. There were several years in the period, most recently in 2013 and 1994, when there were no major hurricanes in the Atlantic. (The HRD defines a major hurricane as a storm classified as 3, 4, or 5 on the Saffir-Simpson Scale.)

A total of twelve Category 4 and 5 hurricanes have made landfall in the United States since 1950, following no particular historical pattern or trend.

Conclusion: There has been a slight increase in the frequency of powerful hurricanes since 1990, but mostly in relation to the numbers of such storms from 1970 to 1989, a quiet period for hurricane formation. The frequency of powerful hurricanes from 2000 to 2018 (3.3 per year) mirrors the rates experienced from 1950 to 1969 (also 3.3 per year). Moreover, there is no pattern or trend in the frequency of Category 4 and 5 hurricanes making landfall over the 1950-2018 period.

How, then, in view of these data, should we assess the claims that Atlantic hurricanes are increasing in numbers and strength in recent decades in response to rising atmospheric and ocean temperatures, and are also making landfall at increasing rates?

There has been a modest increase in the frequency of Atlantic hurricanes in recent decades along with a slight increase in their strength from year to year, but no increase in the number of hurricanes making landfall in the United States and no increase since 1950 in the number of the most powerful hurricanes (Category 4 and 5 storms) to hit the U.S. mainland. Moreover, any trend that we find in the frequency and strength of hurricanes in the past few decades is mostly washed out when we compare those rates to the ones experienced in the 1950s and 1960s. This suggests that the frequency and strength, though perhaps increasing of late, are but loosely related to recent measured increases in Atlantic Ocean temperatures.

Climate Out of Control

Coors Baseball Field, Denver, Colorado, April 29, 2019

Frank Miele writes at Real Clear Politics Climate Is Unpredictable, Weather You Like It or Not!
Excerpts in italics with my bolds.

They say all politics is local; so is all weather.

So on behalf of my fellow Westerners, I have to ask: What’s up with all this cold weather? It may not be a crisis yet, but in the two weeks leading up to Memorial Day — the traditional start of summer activities — much of the country has been donning sweaters and turning up the heat.

I know, I know. Weather is not climate, and you can’t generalize from anecdotal evidence of localized weather conditions to a unified theory of thermal dynamics, but isn’t that exactly what the climate alarmists have done, on a larger scale, for the past 25 years?

Getting Coors Field ready for Colorado Rockies to play baseball.

Haven’t we been brainwashed by political scientists (oops! I mean climate scientists!) to believe that the Earth is on the verge of turning into “Venus: The Sequel.” You know, catastrophic overheating from greenhouse gases, rising oceans, death and mayhem — oh, yeah, and the world ending in 12 years if we don’t ban carbon or something.

But despite the best fake climate data and the scariest computer simulations, Mother Nature doesn’t seem to be cooperating with the global-warming scare scenario. Sure, there is warm weather in other parts of the country, but here in Montana we have been desperately seeking spring. Instead of enjoying our beautiful outdoors, we are stuck in perennial chill mode, shivering under our blankets and wondering if it will snow in late May.

Cars pile up in the snow, Denver, May 21, 2019

In Denver, they didn’t have to wonder. Last Tuesday that area got more than three inches of the white stuff, the most at this late date since 1975. They also matched the record low of 31 degrees. Snow also hit Minnesota, Arizona and California. Yosemite had as much as two feet of snow fall.

Should we start to panic? Roll out computer models to explain why our tootsie toes are turning blue? Maybe we could get rich by promoting the end of the world — even if it’s by ice instead of fire. But let’s face it, intelligent people already know that climate changes on a regular basis and that mankind deals with it just as other species do — by adapting. Technically, we are currently between ice ages, so if it gets a little cold, here’s some advice — get used to it! And if it gets a little warmer? Be grateful! Ice ages are much more deadly than any old heat wave.

Fact of the matter is that for the past few years, real scientists have been warning us that sunspot activity is currently at an unusually low level. In February, there was not even one sunspot recorded, and history tells us that fewer sunspots means colder weather. That’s why current predictions call for cooling weather for the next 20-30 years till the sunspot cycle ticks upward again.

OK, the climate terrorists tell us, you may be right about the next 30 years but that doesn’t mean global warming won’t resume a few years after that. Well, no, but what they won’t tell you is that during the period of increased warming in the late 20th century, sunspot activity was at an 8,000-year high. That was the conclusion of a study in 2004 led by Sami Solanki of the Max Planck Institute in Germany.

So let me get this straight. When sunspot activity is at millennially high levels, Earth gets warmer. When sunspot activity drops to negligible levels, Earth gets cooler. Sounds like a pattern, doesn’t it? In fact, it sounds like something that would interest real scientists.

So why don’t climate scientists just admit that humans don’t control climate, and get on with the business of recording data and analyzing it? That’s easy to explain. Because you can’t mandate massive changes in human behavior if the sun dictates terrestrial temperature variations. The sun doesn’t care what Democratic propagandists say, and all the carbon in the world won’t put one little ol’ sunspot on the surface of our nearest star, so you can expect the sun to be dismissed as irrelevant. Carbon is king.

After all, who ya gonna believe? Al Gore or your own lying thermometer?


2019 Springtime in America: No Collusion, No Warming

Brian C. Joondeph writes at American Thinker Global Warming Going the way of Russia Collusion Excerpts in italics with my bolds.

The last thing we expect mid-spring is snow. Yet that’s just what we have. As the Weather Channel reports, “It may be late April, but Winter Storm Xyler will make you forget that it is spring in the Midwest this weekend as it is expected to bring some unusually heavy late season snowfall.”

Snow is heading to New York as well, despite the state’s all-out effort to combat global warming by attempting to ban plastic straws and now hot dogs. From the New York Post, “Upstate NY may get up to 3 inches of snow this weekend.”

Across the country in Denver, the weather won’t be much different, as The Denver Channel reports, “Mild through the weekend, cold, rain and snow next week!” What’s going on? I thought the planet was heating up, with melting icecaps, rising sea levels, and less than 12 years before the earth burns to a crisp?

We have been hearing this song and dance for several decades now. The global warming chicken littles keep telling us that snow is a thing of the past and we had better get used to it, along with a warming planet.

In 2000, British newspaper The Independent ran this headline, “Snowfalls are just a thing of the past.” In 2014, The New York Times ran a sequel headline, “The end of snow?”

Yet here we are, at the end of April, planting our gardens and facing snow in much of the country. If this is evidence of global warming, then Bernie Sanders’s popularity is evidence that the Democrat Party has shifted to the right. Good luck selling that.

One important factor always neglected by the climate warriors is the Sun, a ball of fire a million times larger than the Earth, the source of life on Earth, as well as destruction if the fires ever were extinguished, or expanded. If we were a few million miles closer to or further from the Sun, life on Earth would cease to exist. Just look at Venus and Mars, neighboring planets either too hot or too cold, respectively, for life as we know it.

Even the Earth’s tilt toward or away from the Sun is enough to cause our seasons, with large temperature variations and the difference between food production or not. Yet climate warriors ignore the Sun, instead focusing on human activity, driving SUV’s, flying in airplanes, and running our air conditioners.

Sunspots, according to the National Weather Service, “Are areas where the magnetic field is about 2,500 times stronger than Earth’s, much higher than anywhere else on the Sun.” Sunspots are quite large, about the size of the Earth, and are several thousand degrees cooler than the surrounding Sun surface.

Sunspots lead to solar flares, surface explosions which “release as much energy as a billion megatons of TNT.” These flares emit x-rays and magnetic fields which blast the Earth as geomagnetic storms, disrupting power grids and satellites, and warming the Earth.

Sunspots are not random but instead follow an 11-year cycle, from a minimum to a maximum. Sometimes the cycles last longer, for unknown reasons, with a 70-year period of near zero sunspot activity from 1645 to 1715, called the Maunder Minimum, or Little Ice Age. Enough of science class, how is this relevant now?

As reported by the Express, we are now entering one of these 11 year cycles as the Sun enters a solar minimum. As they report,

During a solar maximum, the Sun gives off more heat and is littered with sunspots. Less heat in a solar minimum is due to a decrease in magnetic waves.

Fewer magnetic waves equates to the Sun being slightly cooler, and experts are expecting the solar minimum to deepen even further before it gets warmer.

With less magnetic waves coming from the Sun, cosmic rays find it easier to penetrate Earth’s atmosphere and are more noticeable to scientists.

While cosmic rays have little effect on our planet, one of the reasons scientists monitor them is to see when the Sun has entered a solar minimum.

Now, with cosmic rays at an all-time high, scientists know the Sun is about to enter a prolonged cooling period.

The bottom line is that decreasing sunspot activity translates to a cooling planet, contrary to the doomsday non-scientific pronouncements of Al Gore and Alexandria Occasional-Cortex. Sunspot activity typically follows an 11-year cycle, but as noted above, there may be other perhaps longer cycles as occurred in the 1600s leading to a 70-year mini ice age.

Then there are even longer climatic cycles, with real ice ages occurring every 100,000 years. These glaciations end with a 10,000 year inter-glacial warming period, the current such warming period soon ending, as distinguished scientist S. Fred Singer wrote in American Thinker.

Clearly there are factors at play in climate cycles that we barely understand and certainly cannot control. Some play out in shorter time spans, which we as humans can observe directly. Others are on a far longer and grander scale than human existence, much less our individual life spans, which are merely the blink of an eye by comparison.

Aside from solar activity and sunspots, there are volcanic eruptions emitting more greenhouse gas per eruption than years of worldwide human activity. What other forces are at play? That’s for scientists to discover. Our solar system is a mere speck in the Milky Way Galaxy, which is another speck in the vast universe.

It’s the ultimate in hubris to believe climate revolves solely around human activity. Yet politicians, rather admitting the obvious, that we don’t know far more than we do know, blame an ever-changing climate on everything from flatulent cows to processed meats.

Much like the Russian collusion hoax, the left creates a narrative to fit their agenda, putting conclusions before research and discovery. Instead they would be better served by applying the scientific method of observing, formulating a hypothesis, testing it against observations, modifying and refining the hypothesis, until after extensive testing it accurately predicts future events.

Otherwise it’s just more blather and fear mongering, just as we heard for over two years with Russian collusion fantasies that turned out to be nothing. Just as late April snow, in the eyes of the left, is further evidence of a warming planet.

See The Warmist Who Came in from the Cold

See also The cosmoclimatology theory


The Warmist Who Came in from the Cold

Deroy Murdock writes in The American Spectator This Opinion Just In… Baby It’s Cold Outside Excerpts in italics with my bolds and images.

I might be slightly less hostile to the Green New Deal, had I not walked home the other Sunday in a hail storm. Even before the BB-sized bits of ice came shooting down from the heavens that morning, this winter has been brutal, from Gotham to the Golden Gate.

Our Lady of Perpetual Limelight, Saint Alexandria Ocasio-Cortez, demands that America battle so-called “deadly, manmade global warming” as if it were Nazi Germany. Ten-year cost: $93 trillion. But this supposed threat somehow seems less menacing than Adolf Hitler and the Wehrmacht.

A cyclist rides through the falling snow in the Financial District, January 30th, 2019, in New York City (Photo: Drew Angerer/Getty Images)

Any given winter does not equal “climate.” Still, if mounting concentrations of carbon dioxide are the broth in which we homo sapiens are poaching ourselves like so many salmon cutlets, then we should not be enduring the entirely contrary scenarios that have unfolded so vividly from coast to coast:

A “bomb cyclone” last week slammed the Rockies and Midwest with hurricane-speed winds and abundant snowfall. As 97-MPH gusts struck Colorado Springs, marooned passengers huddled in horror inside a shuttered Denver International Airport.

• At this point in 2017, Lake Superior was just 7.3 percent covered in ice; 2018’s figure: 49 percent. Lake Superior was 94 percent iced over on March 8. This was the first time in four years that the largest Great Lake’s ice coverage exceeded 90 percent, the Detroit Free Press reported. Not so far away, Lake Erie was 20 percent ice a year ago. Today: 94.1 percent. Overall, the Great Lakes have gone from 27.8 percent ice in 2018 to 74.6 percent in 2019.

Ice builds up along the shore of Lake Michigan as temperatures dipped to lows around -20 degrees on January 31st, 2019, in Chicago, Illinois. Businesses and schools closed, Amtrak suspended service into the city, more than a thousand flights were canceled, and mail delivery was suspended as the city coped with record-setting low temperatures. (Photo: Scott Olson/Getty Images)

Lake Erie recently experienced a sort of frozen tsunami, as huge chunks of wind-blown ice washed onto the shore at Hamburg,New York. Footage of this phenomenon is fascinating and terrifying, especially as the solid water violates homes, marinas, and other structures in and around the lake.

• Several polar vortexes pumped Arctic air into the Midwest and parked it there for days. This drove air temperatures to 22 degrees below zero in Chicago and minus-28 Fahrenheit in Minneapolis on January 30.

Snow hit Las Vegas on February 17 and 19, with some 5.5 inches of the white stuff fluffing the peaks of Sin City’s western suburbs. Some 100 flights were canceled at McCarran Airport on only the second day in two decades that it received measurable snow.

Drew Johnson, a transplant from Tennessee to Vegas’s western hills, told me: “I moved to Las Vegas specifically to avoid long, dark, cold winters with snow and freezing temperatures. I thought global warming was supposed to mean shorter, warmer winters. Man, have I been ripped off. Instead, we’re getting regular snowstorms in Vegas.” He blames, in part, his former neighbor in Nashville. “It’s tough to take the Al Gores of the world seriously when schools are closed for snow in Las Vegas, and kids are sledding and building snowmen.”

The State of California has been more white than golden lately. “For the first time in at least 132 years, the temperature didn’t hit 70 degrees in downtown Los Angeles in February,” the Wall Street Journal editorialized on March 4. “Snow powdered the hills of West Hollywood and Malibu,” the Journal added. Last month, downtown Los Angeles saw snow for the first time since January 1962. Santa Barbara Airport logged its all-time record low of 33 degrees.

USPS Suspended Service in 11 States Due to Record Low Temperatures.

• The Sierra Nevadas repeatedly have seen avalanches swamp mountain roads. Last year’s early-March snowpack was just 19 percent of normal levels. On Tuesday, the Central Sierra snowpack reached 164 percent of normal.

“Open for skiing through July 7,” Lake Tahoe’s Squaw Valley USA/Alpine Meadows resort announced last week, after February became its snowiest month on record. “Thanks to nearly 600” [50 feet] of snowfall, we are once again going to have Tahoe’s longest spring season. In fact, we’ll be skiing right into July this year. Make your spring and summer skiing plans today.”

Summer skiing? How, exactly, does so-called “global warming” trigger summer skiing?

Temperature gauges aboard space-based satellites have recorded average global temperatures on Earth that peaked in 1997 and then slid or flat-lined from there. A quick, El Niño warming spike broke this “pause” in 2015-2016, followed by declining average readings. This virtual absence of observed warming led Greenpeace’s Steven Guilbeault to explain: “Global warming can mean colder, it can mean drier, it can mean wetter, that’s what we’re dealing with.”

Perhaps suspecting that such authentic frontier gibberish was not — as the Greens say — sustainable, the government-control-hungry Left ditched their “global warming!” battle cry and instead screamed, “Climate change! Climate CHANGE! CLIMATE CHANGE!” This nebulous phrase is magically self-confirming. The absence of global warming disproves global warming. However, the absence of climate change is nothing that should worry the alarmists since the climate always changes. It has done so since the dinosaurs ran this place. So, warming equals climate change. Cooling equals climate change. Droughts equal climate change. Floods equal climate change.

How convenient!

Meanwhile, the giant, deadly Camp Fire that killed some 86 people in and around Paradise, California, last fall “proved” that so-called “global warming” is fueling fatal fires in the West. Um, well, except that downed power lines ignited Camp and other big blazes, so much so that Pacific Gas & Electric filed for bankruptcy protection amid mounting lawsuits.

Did dry conditions fuel these blazes? Surely. California was in a drought. And now that’s over, thanks to the state’s snow-choked mountains. Apparently, these conditions can correct themselves, which refutes the Left’s narrative of a steady, speedy, ski run into doom. Anyway, if not for the electric cables dangling from old towers, many of these fires would not have started. And clearing excess brush and some of California’s 129 million dead trees makes much more sense than waiting for President Ocasio-Cortez to install high-speed trains from San Francisco to Honolulu, after she bans jumbo jets in 2025.

But wait. Before Americans surrender our Boeing 787s, New York Strip steaks, national prosperity, and sacred honor, wouldn’t it be nice if some serious scientists determined whether we will boil over or freeze to death?

Fortunately, President Donald J. Trump will decide soon whether or not to proceed with the Presidential Commission on Climate Science. The PCCS’s goal is to take a sober, scientific look at the warmists’ claims. In January, Saint Alexandria prophesied that “the world is gonna end in 12 years if we don’t address climate change.” Catchy slogan, but does science confirm her hypothesis? Why not find out?

Many on the warming-alarmist Left oppose such intellectual inquiry. They attack the PCCS since “the science is settled.” Of course, it’s not settled. Like a lioness in heat, this debate roars on.

Indeed, the PCCS is the ideal venue for the final showdown between the Alarmists and the Deniers. Here is the chance for scientists who are 97 percent confident of Earth’s imminent meltdown to make fools, once and for all, of Sallie Baliunas, John Christy, Paul Driessen, John Droz, James Inhofe, Bjorn Lomborg, Pat Michaels, Lord Monckton of Brenchley, Marc Morano, Fred Singer, Roy Spencer, Mark Steyn, and all the other scientists and policy experts who deny that cataclysm is just around the corner. And yet the Alarmists spurn such a confrontation. Methinks they doth protest too much.

Instead, the Green New Dealers are pushing Trump to ditch the PCCS and embrace “the climate consensus” — complete with swelling subsidies, sweeping regulations, slower growth, and slumping prosperity for (nearly) all, and a stunning bonanza for the fortunate few in the solar and wind sectors.

If this sounds like a raw deal, please call the White House comment line at 202-456-1111 and say so. Send President Trump a message by clicking here. Ask him to preserve and staff the Presidential Commission on Climate Science and order it to decipher this frigid warming.

Deroy Murdock is a Manhattan-based Fox News Contributor, a contributing editor at National Review Online, and a senior fellow with the London Center for Policy Research. Michael Malarkey furnished research for this opinion piece.

See Also: Cold Waves and CO2

No, Cold Doesn’t Disprove Warming, Nothing Can

Stop Fake Science. Approve the PCCS!