Russian Nuclear Icebreakers on the Northern Sea Route, March 2025
The arctic ice extents are now reported through end of May 2026, and as noted previously the wavy polar vortex has hampered ice formation with incusions of warmer southern air into the Arctic circle. This factor receded in May, and extents have closed the gap with the averages somewhat. The Northern Sea Route (NSR) goes through the Russian shelf seas of Laptev, East Siberian, and Chukchi seas on the way to Bering Strait in Beaufort Sea.
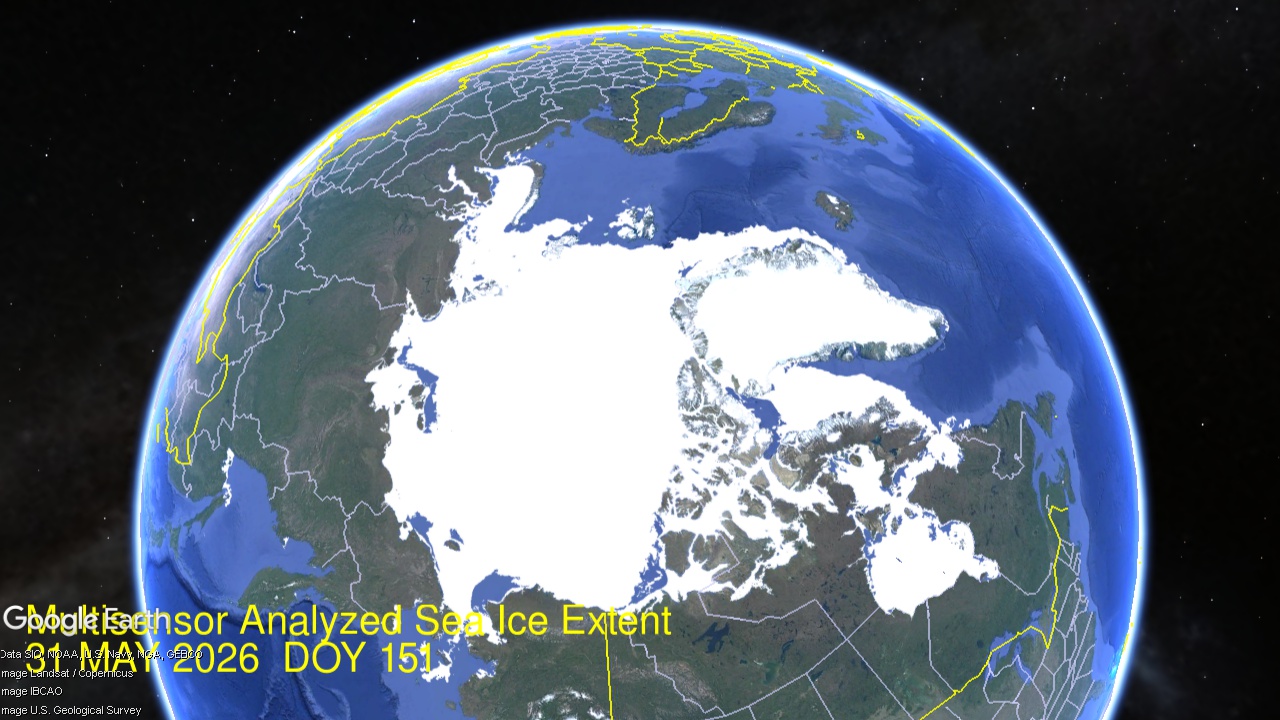
As the image from yesterday shows, despite some melting on the margins, the Arctic Ocean core is solid, expecially along the Eurasian NSR seen on the left vertical side.
The chart below shows the 20-year May averages for Arctic ice extents, along with 2026, 2025 and 2006 as well as SII v.4.
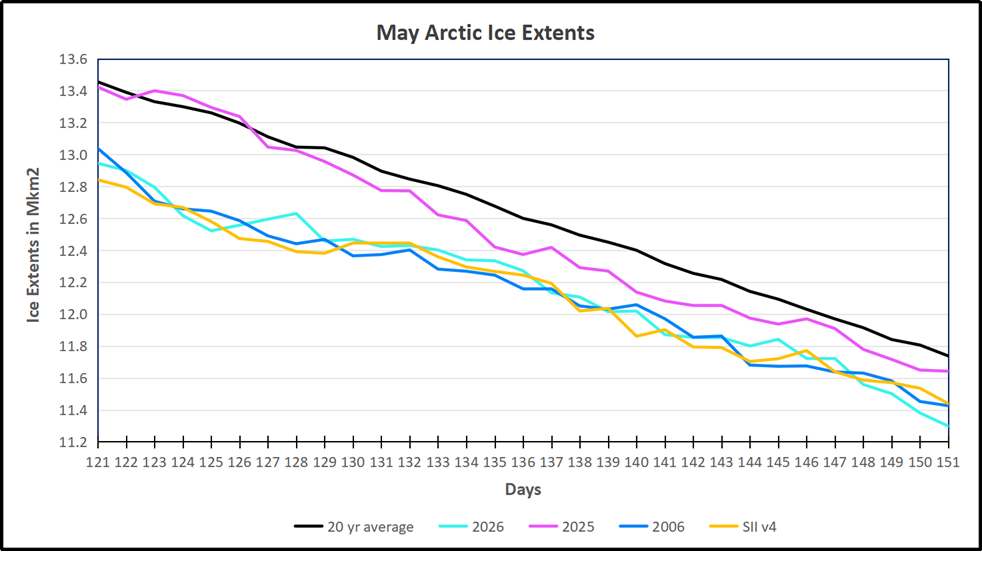
Remarkably the deficit to average opened up on May 5 (day 125) to 739k km2, but since then the gap was cut to 1/3, reaching 250k km2 on day 145, before ending 439k at month end . SII tracked close to MASIE, but ended May 150k higher and matching 2006.
The table below shows the distibution of ice extents on day 151 across regions of the Arctic ocean.
| Region | 2026151 | Day 151 Ave. | 2026-Ave. | 2006151 | 2026-2006 |
| (0) Northern_Hemisphere | 11297960 | 11734791 | -436830 | 11425616 | -127655 |
| (1) Beaufort_Sea | 1015077 | 1013073 | 2004 | 1063879 | -48801 |
| (2) Chukchi_Sea | 880665 | 876472 | 4192 | 907609 | -26945 |
| (3) East_Siberian_Sea | 1038006 | 1066371 | -28365 | 1073889 | -35883 |
| (4) Laptev_Sea | 838754 | 826149 | 12605 | 856108 | -17354 |
| (5) Kara_Sea | 873688 | 826976 | 46712 | 848172 | 25516 |
| (6) Barents_Sea | 141624 | 314200 | -172576 | 180906 | -39281 |
| (7) Greenland_Sea | 516827 | 588635 | -71808 | 522040 | -5213 |
| (8) Baffin_Bay_Gulf_of_St._Lawrence | 692121 | 902041 | -209920 | 721606 | -29485 |
| (9) Canadian_Archipelago | 830939 | 814415 | 16524 | 800561 | 30378 |
| (10) Hudson_Bay | 1139854 | 1080088 | 59765 | 989550 | 150304 |
| (11) Central_Arctic | 3197949 | 3220706 | -22757 | 3188696 | 9253 |
| (12) Bering_Sea | 84979 | 113623 | -28645 | 179378 | -94399 |
| (13) Baltic_Sea | 0 | 5749 | -5749 | 720 | -720 |
| (14) Sea_of_Okhotsk | 46029 | 172136 | -126107 | 89739 | -43710 |
The table shows that most regions are close to or above the 20-year average. The majority of the 4% overall deficit is from Baffin Bay, Barents, Okhotsk and Greenland seas. All of those regions will be nearly ice-free end of summer.


Illustration by Eleanor Lutz shows Earth’s seasonal climate changes. If played in full screen, the four corners present views from top, bottom and sides. It is a visual representation of scientific datasets measuring ice and snow extents.

