It may be easy to dismiss this as a case of fanaticism: Sure, American progressives may perhaps not have been truly sincere when they proclaimed their faith in the upcoming apocalypse and the gospel of Greta Thunberg, but maybe her fellow Swedes — and other Europeans — are true believers?
While “sincere” environment activists may be a more common breed in Europe, that does not explain the actions of policymakers and civil servants — technocrats who know for a fact that the “climate transition” was sold to voters by giving disproportionate publicity to worst-case scenarios, rather than the more likely, less catastrophic, and less headline-grabbing scenarios outlined by the likes of the Intergovernmental Panel on Climate Change.
Instead, one must first understand that the EU is a slow-moving beast. The legislative process is complicated and sluggish, with 27 countries and an often-equal number of different viewpoints all struggling to be heard. The rules of the union mean that a third of the countries are able to veto most legislation, and in some cases, unanimity is required. Passing the European Green Deal in the first place required truly draconian efforts of political willpower and coordination, and reversing or altering the deal would hardly be any easier.
Making matters worse, the EU has driven past every conceivable off-ramp, events that would have allowed it to change course while saving face. Mere months after the European Green Deal was unveiled, the Covid-19 pandemic went on to turn the world upside down. Mass unemployment and government borrowing followed. At this point, the EU could have cited the pandemic as an excuse as to why climate goals had to be postponed, and some money earmarked for green projects instead used towards health-care or furlough programs.
The next “off-ramp” was the Russian invasion of Ukraine in February 2022. With Europe suddenly needing to provide aid to Ukraine and rearm itself, policymakers could have made the case that the original timeline of the Green Deal was no longer feasible. Shortly thereafter, inflation would hit double digits in many EU member states, once again providing an excellent “excuse” to cancel a Green Deal that was negotiated in the bygone Zero Interest-Rate Policy (ZIRP) era, and whose ambitious goals assumed that this era would never end.
Now, policymakers are truly stuck with a project that virtually ensures the EU won’t see much of the global, energy-intensive AI boom, as prohibitive electricity prices cause data centers and tech firms to choose other locations. As slow and complicated as the legislative process in the EU is, that alone cannot explain why none of the off-ramps were taken.
It is also, as it so often is in politics, about power. Environmentalism is a convenient ideology for those who wish to transfer power to the state, as it provides justification for the state’s expansion. In Europe, however, environmentalism is chiefly not used to transfer power from the voters to the state, but from the states to the European Union. For a supranational organization whose founding treaty infamously states that it is to strive to be an “ever-closer union,” hardly any excuse for centralization is ever passed by.
It may be easy to dismiss this as a case of fanaticism: Sure, American progressives may perhaps not have been truly sincere when they proclaimed their faith in the upcoming apocalypse and the gospel of Greta Thunberg, but maybe her fellow Swedes — and other Europeans — are true believers?
While “sincere” environment activists may be a more common breed in Europe, that does not explain the actions of policymakers and civil servants — technocrats who know for a fact that the “climate transition” was sold to voters by giving disproportionate publicity to worst-case scenarios, rather than the more likely, less catastrophic, and less headline-grabbing scenarios outlined by the likes of the Intergovernmental Panel on Climate Change.
Instead, one must first understand that the EU is a slow-moving beast. The legislative process is complicated and sluggish, with 27 countries and an often-equal number of different viewpoints all struggling to be heard. The rules of the union mean that a third of the countries are able to veto most legislation, and in some cases, unanimity is required. Passing the European Green Deal in the first place required truly draconian efforts of political willpower and coordination, and reversing or altering the deal would hardly be any easier.
Making matters worse, the EU has driven past every conceivable off-ramp, events that would have allowed it to change course while saving face. Mere months after the European Green Deal was unveiled, the Covid-19 pandemic went on to turn the world upside down. Mass unemployment and government borrowing followed. At this point, the EU could have cited the pandemic as an excuse as to why climate goals had to be postponed, and some money earmarked for green projects instead used towards health-care or furlough programs.
The next “off-ramp” was the Russian invasion of Ukraine in February 2022. With Europe suddenly needing to provide aid to Ukraine and rearm itself, policymakers could have made the case that the original timeline of the Green Deal was no longer feasible. Shortly thereafter, inflation would hit double digits in many EU member states, once again providing an excellent “excuse” to cancel a Green Deal that was negotiated in the bygone Zero Interest-Rate Policy (ZIRP) era, and whose ambitious goals assumed that this era would never end.
Now, policymakers are truly stuck with a project that virtually ensures the EU won’t see much of the global, energy-intensive AI boom, as prohibitive electricity prices cause data centers and tech firms to choose other locations. As slow and complicated as the legislative process in the EU is, that alone cannot explain why none of the off-ramps were taken.
The video player is currently playing an ad.
It is also, as it so often is in politics, about power. Environmentalism is a convenient ideology for those who wish to transfer power to the state, as it provides justification for the state’s expansion. In Europe, however, environmentalism is chiefly not used to transfer power from the voters to the state, but from the states to the European Union. For a supranational organization whose founding treaty infamously states that it is to strive to be an “ever-closer union,” hardly any excuse for centralization is ever passed by.
It may be easy to dismiss this as a case of fanaticism: Sure, American progressives may perhaps not have been truly sincere when they proclaimed their faith in the upcoming apocalypse and the gospel of Greta Thunberg, but maybe her fellow Swedes — and other Europeans — are true believers?
While “sincere” environment activists may be a more common breed in Europe, that does not explain the actions of policymakers and civil servants — technocrats who know for a fact that the “climate transition” was sold to voters by giving disproportionate publicity to worst-case scenarios, rather than the more likely, less catastrophic, and less headline-grabbing scenarios outlined by the likes of the Intergovernmental Panel on Climate Change.
It may be easy to dismiss this as a case of fanaticism: Sure, American progressives may perhaps not have been truly sincere when they proclaimed their faith in the upcoming apocalypse and the gospel of Greta Thunberg, but maybe her fellow Swedes — and other Europeans — are true believers?


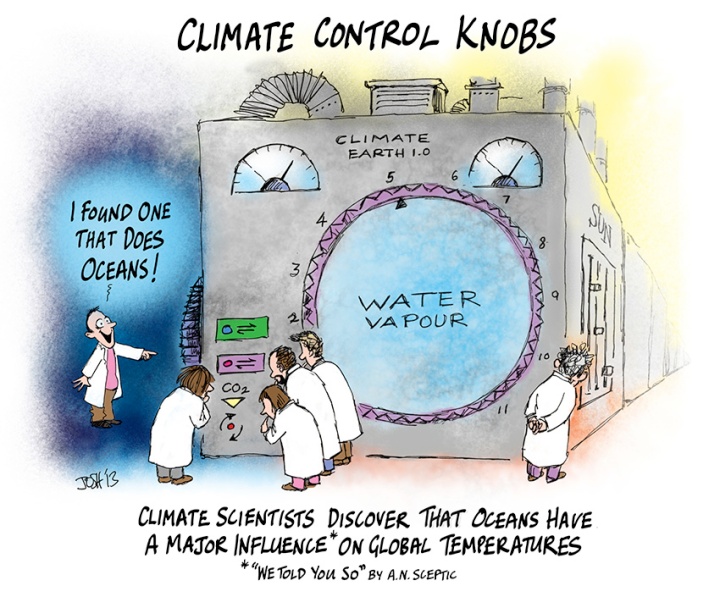
 The best context for understanding decadal temperature changes comes from the world’s sea surface temperatures (SST), for several reasons:


See Also