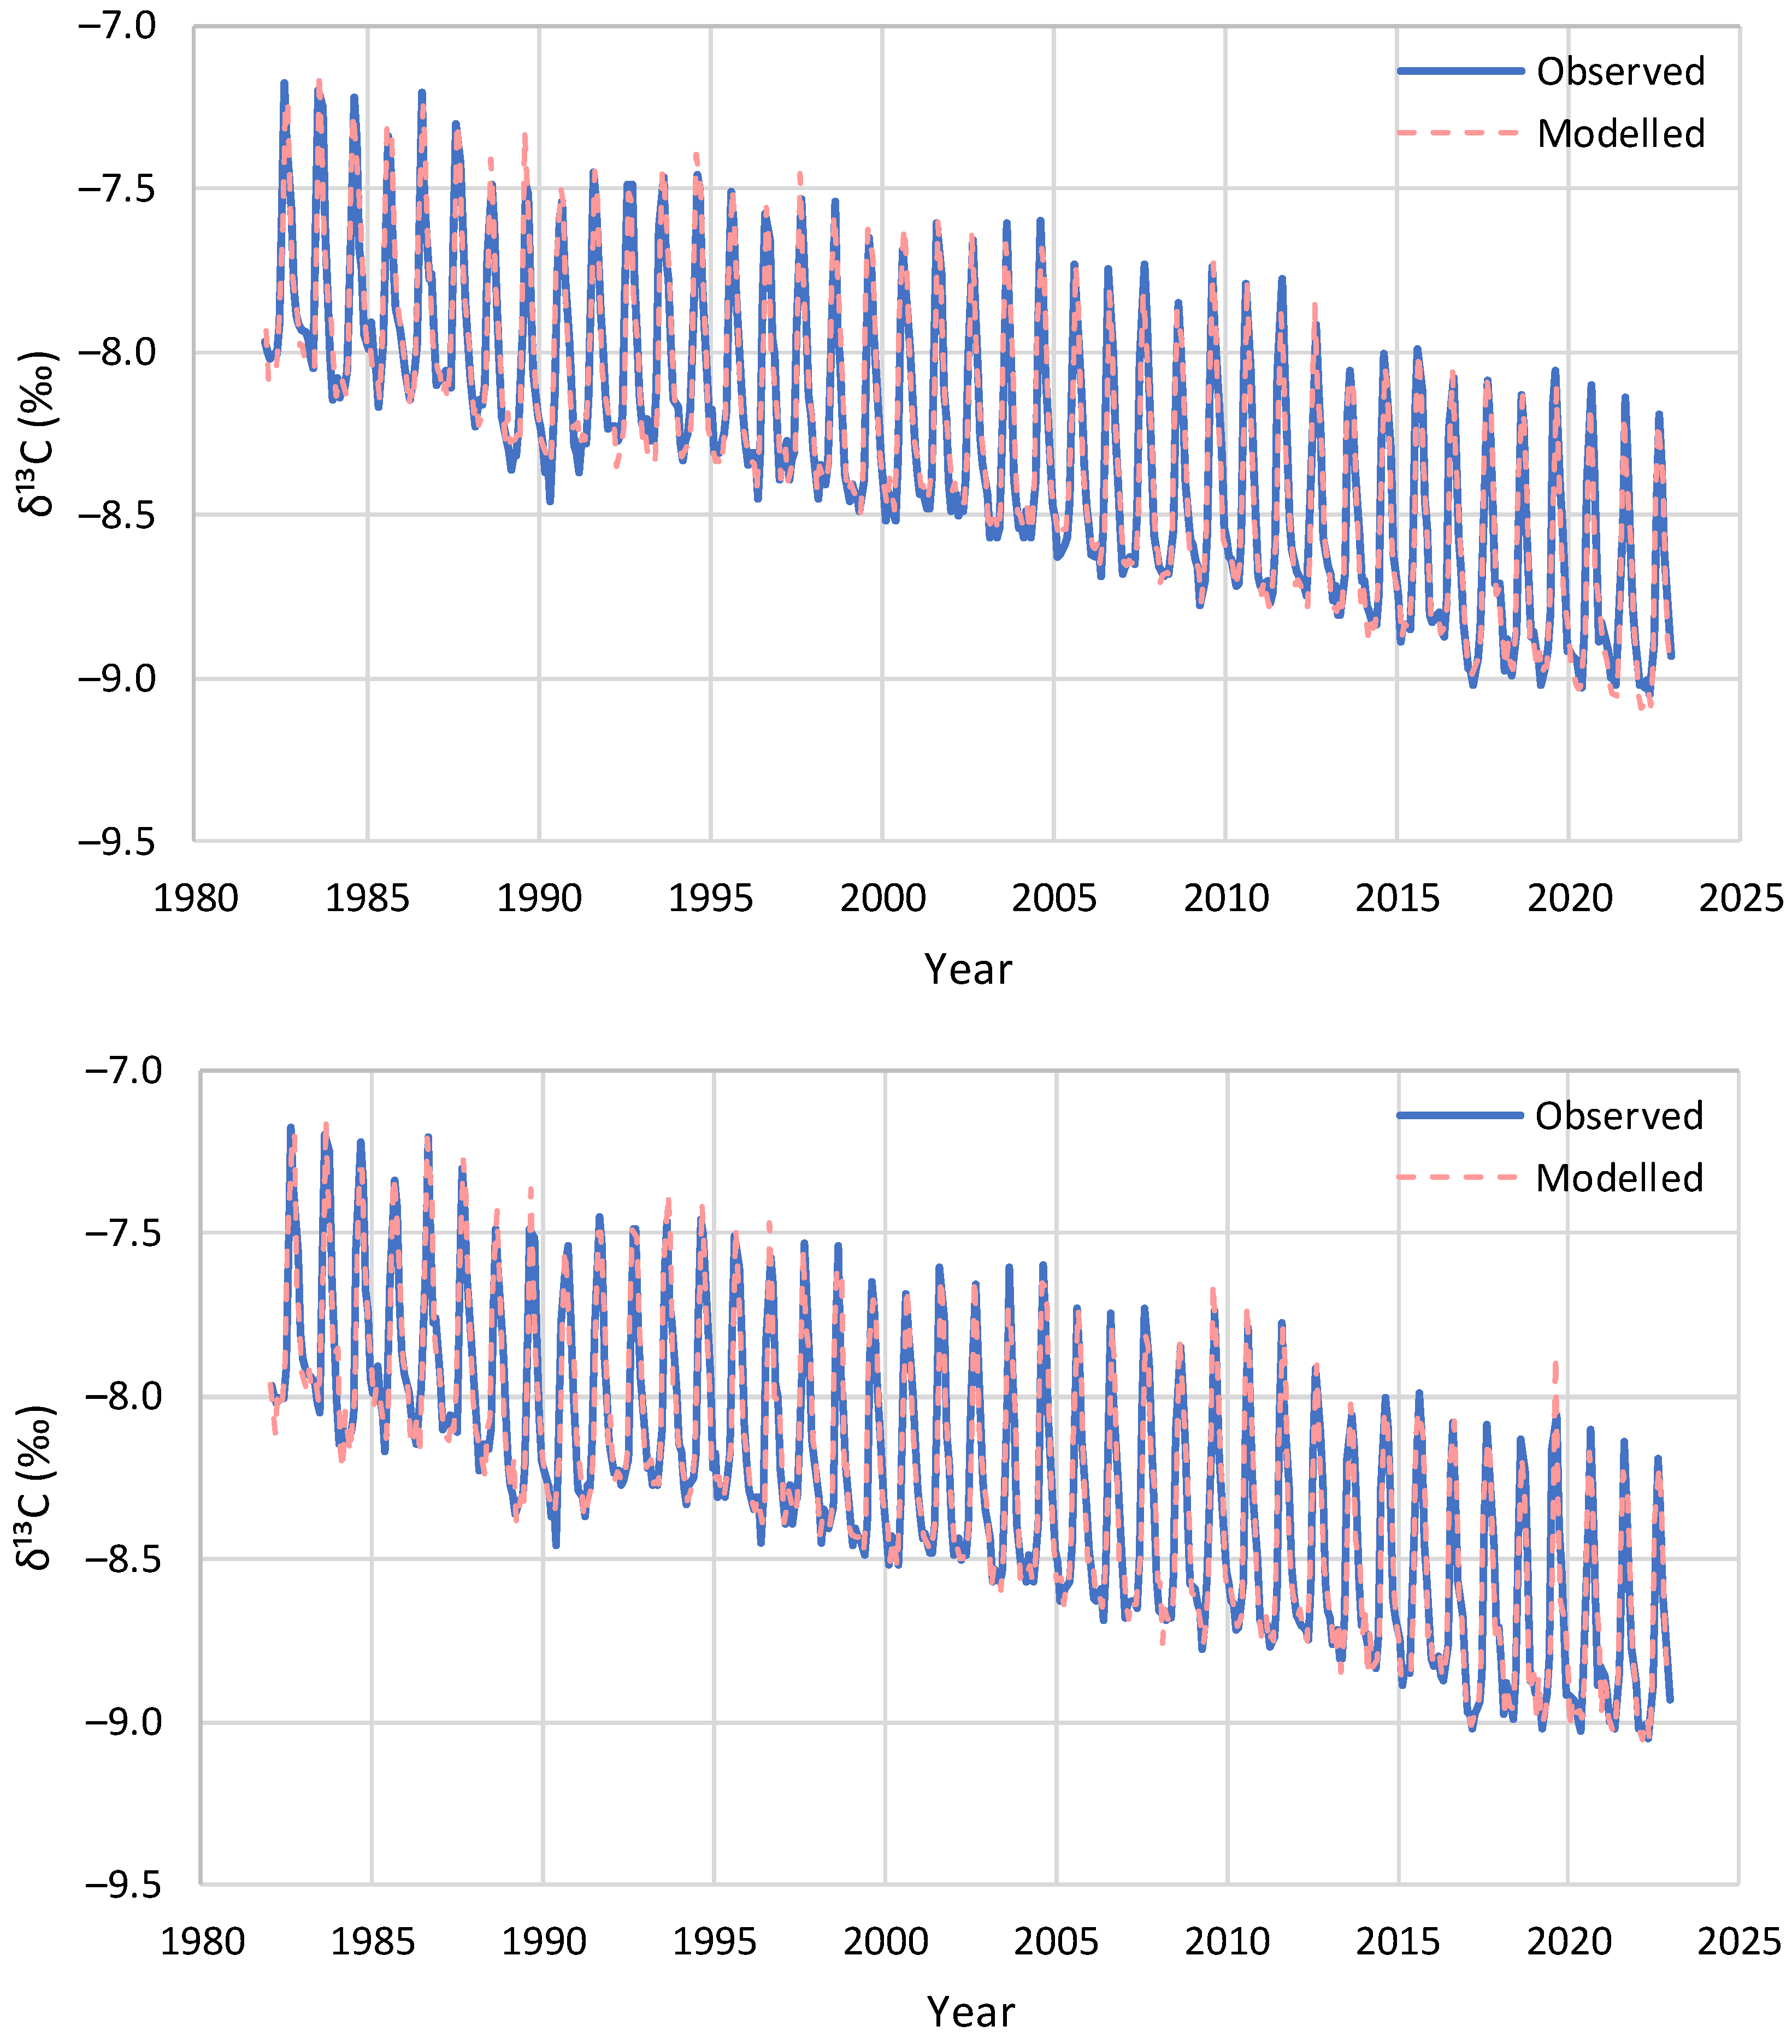
Figure 16. Model reproduction of the monthly observations of evolution of δ13C at Barrow: (upper) without update of initial conditions and (lower) with update of initial conditions in each step by the δ13C observations.
While numerous studies support the title conclusion, the most recent and thorough analysis comes in the paper Net Isotopic Signature of Atmospheric CO2 Sources and Sinks: No Change since the Little Ice Age by Demetris Koutsoyiannis. Excerpts in italics with my bolds and added images. H/T notrickszone
Abstract
Recent studies have provided evidence, based on analyses of instrumental measurements of the last seven decades, for a unidirectional, potentially causal link between temperature as the cause and carbon dioxide concentration ([CO2]) as the effect. In the most recent study, this finding was supported by analysing the carbon cycle and showing that the natural [CO2] changes due to temperature rise are far larger (by a factor > 3) than human emissions, while the latter are no larger than 4% of the total. Here, we provide additional support for these findings by examining the signatures of the stable carbon isotopes, 12 and 13. Examining isotopic data in four important observation sites, we show that the standard metric δ13C is consistent with an input isotopic signature that is stable over the entire period of observations (>40 years), i.e., not affected by increases in human CO2 emissions. In addition, proxy data covering the period after 1500 AD also show stable behaviour.
These findings confirm the major role of the biosphere in the carbon cycle
and a non-discernible signature of humans.
Introduction
The decrease [in the specific 14C activity of wood at time of growth during the past 50 years] can be attributed to the introduction of a certain amount of C14-free CO2 into the atmosphere by artificial coal and oil combustion and to the rate of isotopic exchange between atmospheric CO2 and the bicarbonate dissolved in the oceans.

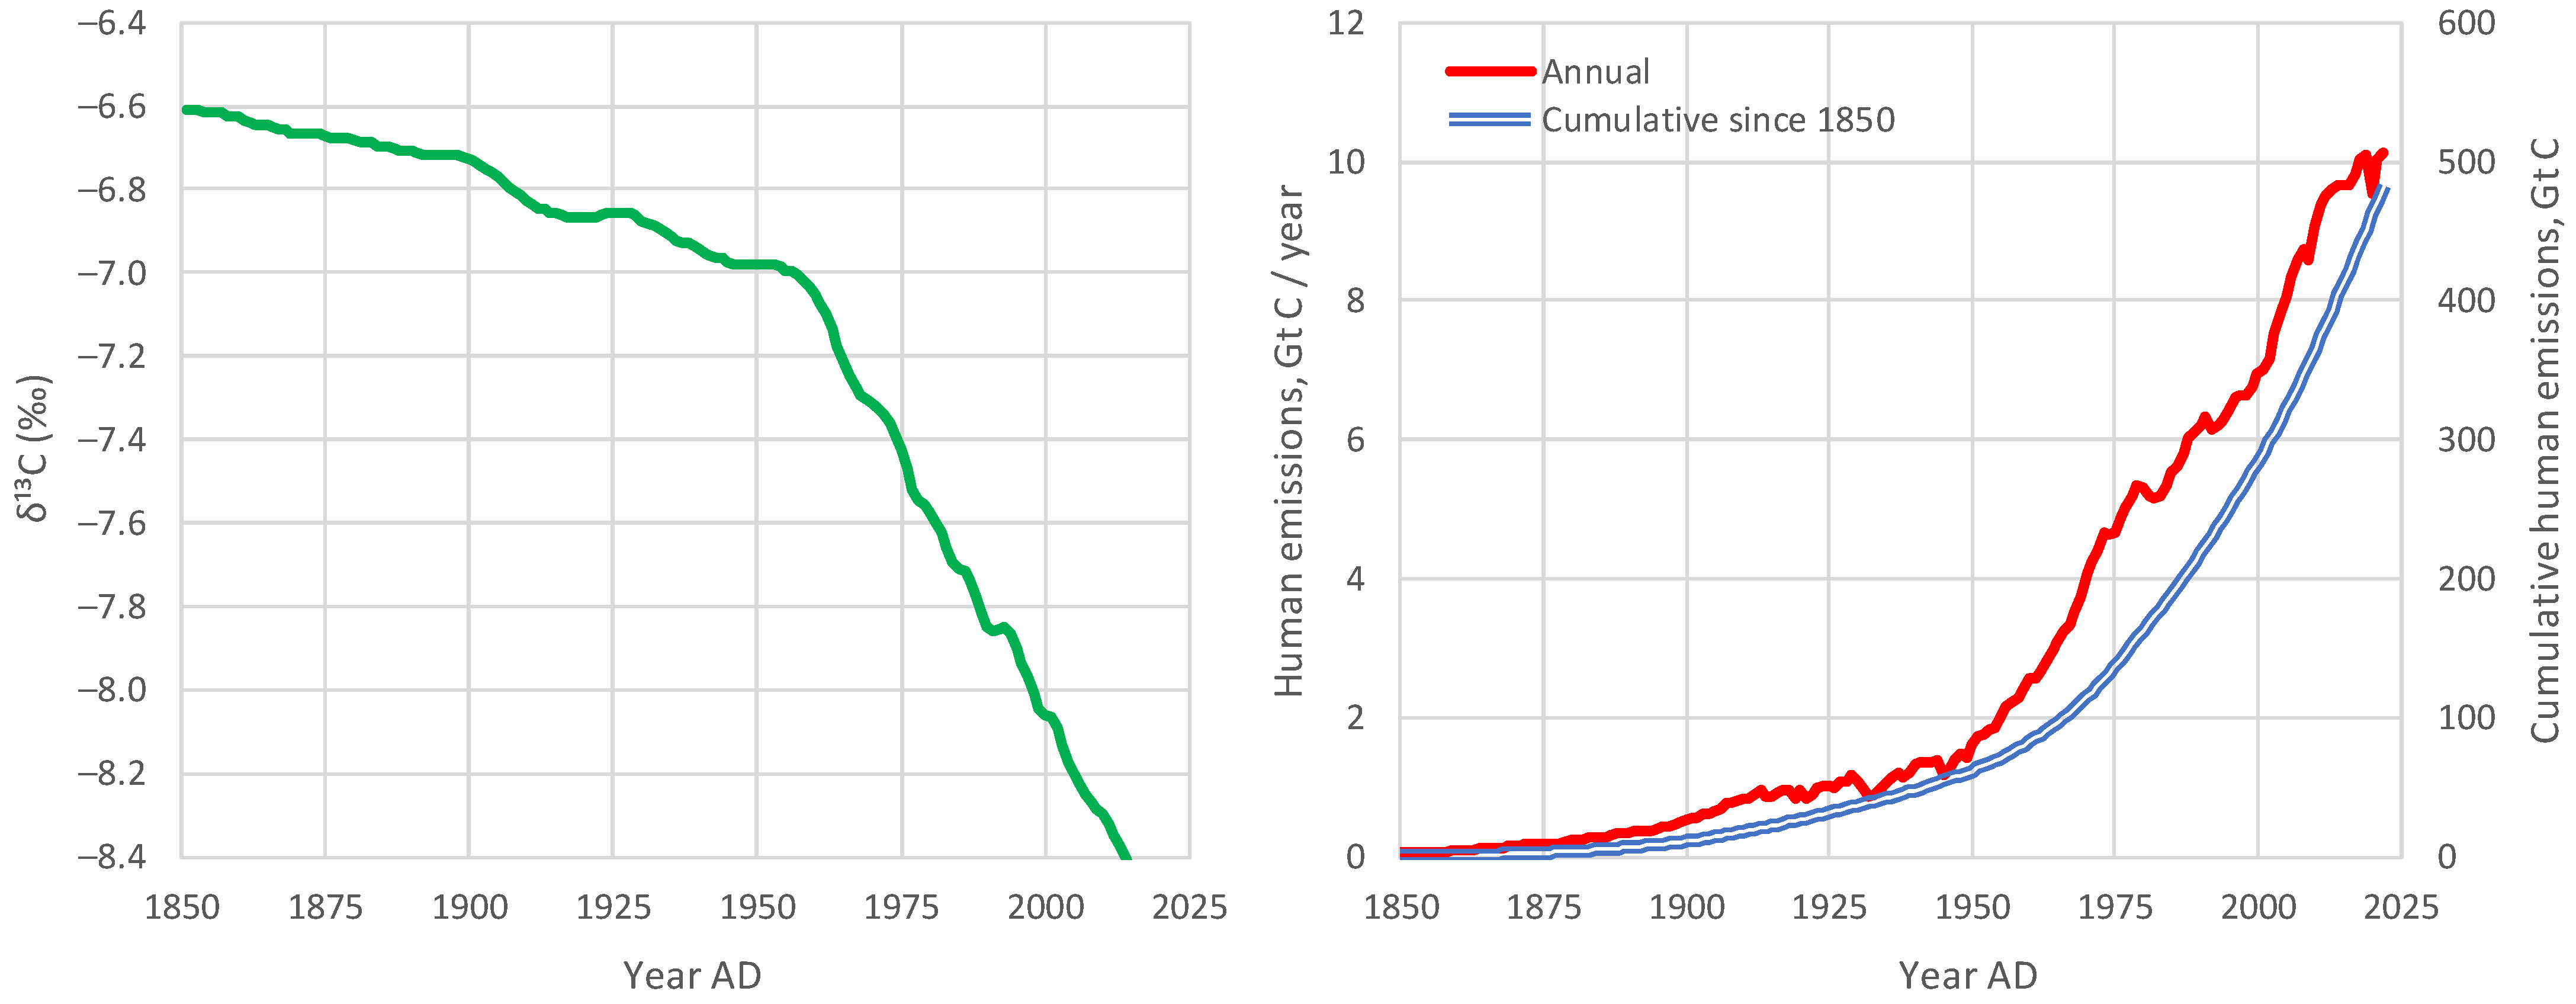
Figure 2. (left) Compiled data set of annual mean, global mean values for δ13C in atmospheric CO2, from Graven et al. [12], reconstructed after digitisation of Figure 3 of Graven et al. [8]; and (right) evolution of global human carbon emissions [13,14], after conversion from CO2 to C (dividing by 3.67).
For example, Andres et al. [15,16] stated:
The carbon isotopic (δ13C, PDB) signature of fossil fuel emissions has decreased during the last century, reflecting the changing mix of fossil fuels produced.
Also, in their recent review paper, Graven et al. [8] noted:
Since the Industrial Revolution, the carbon isotopic composition of atmospheric CO2 has undergone dramatic changes as a result of human activities and the response of the natural carbon cycle to them. The relative amount of atmospheric 14C and 13C in CO2 has decreased because of the addition of 14C- and 13C-depleted fossil carbon.
These generally accepted hypotheses, however, may reflect a dogmatic approach, or a postmodern ideological effect, i.e., to blame everything on human actions. Hence, the null hypothesis that all observed changes are (mostly) natural has not seriously been investigated. However, there are good reasons for this investigation. It is a fact that the biosphere has become more productive and expanded [5,17,18,19], resulting in natural amplification of the carbon cycle due to increased temperature. This fact may have been a primary factor for the decrease in the isotopic signature δ13C in atmospheric CO2. Note that the emissions of the biosphere are much larger than fossil fuel emissions (where the latter are only 4% of the total) [5] and, as seen in Figure 1, the biosphere’s isotopic signature δ13C is much lower than the atmospheric (see also Section 6).

Figure 1. Typical ranges of isotopic signatures δ13C for each of the pools interacting with atmospheric CO2, and related exchange processes.
In addition to the biosphere’s action, other natural factors also affect the input isotopic signature in the atmospheric CO2. These include volcano eruptions, among which, in the recent period, the Pinatubo eruption in 1991 is regarded as the most important, as well as the interannual variability related to El Niño—Southern Oscillation (ENSO) [8].
To investigate the null hypothesis and answer the two research questions posed above, we use modern instrumental and proxy data, as described in Section 2. We develop a theoretical framework in Section 3, which we apply to the data in a diagnostic mode in Section 4, and in a modelling mode in Section 5. The findings of these applications are further discussed in Section 6 and the conclusions are drawn in Section 7.
Discussion
With only two parameters, δ13CU and δ13CD, which represent the input isotopic signatures for the seasonal increasing and decreasing phases of [CO2], respectively, we are able to effectively model the isotopic signature δ13C of the atmosphere for the entire observation period. Of these parameters, δ13CD, reflecting the fractionation by photosynthesis, can be assumed as the same for the entire globe, while δ13CU varies, with smaller (more negative) values as we go north and higher (less negative) values as we go south. This spatial variation of δ13CU reflects the differences of the strength of seasonality in [CO2] and δ13C, which is at a maximum toward the North Pole and at a minimum at the South Pole.
The strong seasonality at high latitudes north is probably related to the processes in boreal vegetation, the dominance of snow and ice in winter, and the absence of photosynthesis during the 6-month night (note that Barrow, at a latitude of 71.3° N, is more north than the Artic Circle at 66.6° N). As we go south, some of these features cease to occur, and seasonality becomes less prominent, as photosynthesis occurs throughout the entire year, albeit with varying intensities. The minimal seasonality in the South Pole is probably related to the absence of vegetation due to the minimal appearance of land beyond a latitude of 43° S (with the exception of the frozen continent of Antarctica and a relatively small wedge of land in South America). All these suggest the dominance of terrestrial biosphere processes in driving [CO2] and δ13C.
Considering the fact that, as seen in Figure 2 (above), the human carbon emissions per year have doubled in the observed time period, if these were a key factor, this would somehow be reflected in a trend in the seasonality. Therefore, no sign is discerned that would necessitate an attribution to the influence of fossil fuel emissions. In contrast, continuity suggests that the key processes in CO2 emissions are related to biosphere processes such as respiration and photosynthesis.
.
Despite differences in seasonality, the over-annual input isotopic signature δ13CI remains almost the same globally, as seen in Table 4, which summarizes the results of all analyses, diagnostic and modelling, suggesting similar values, irrespective of the method used. This is not difficult to explain as, in the long run, CO2 is well mixed in the atmosphere; thus regional differences in seasonal δ13CI tend to disappear.
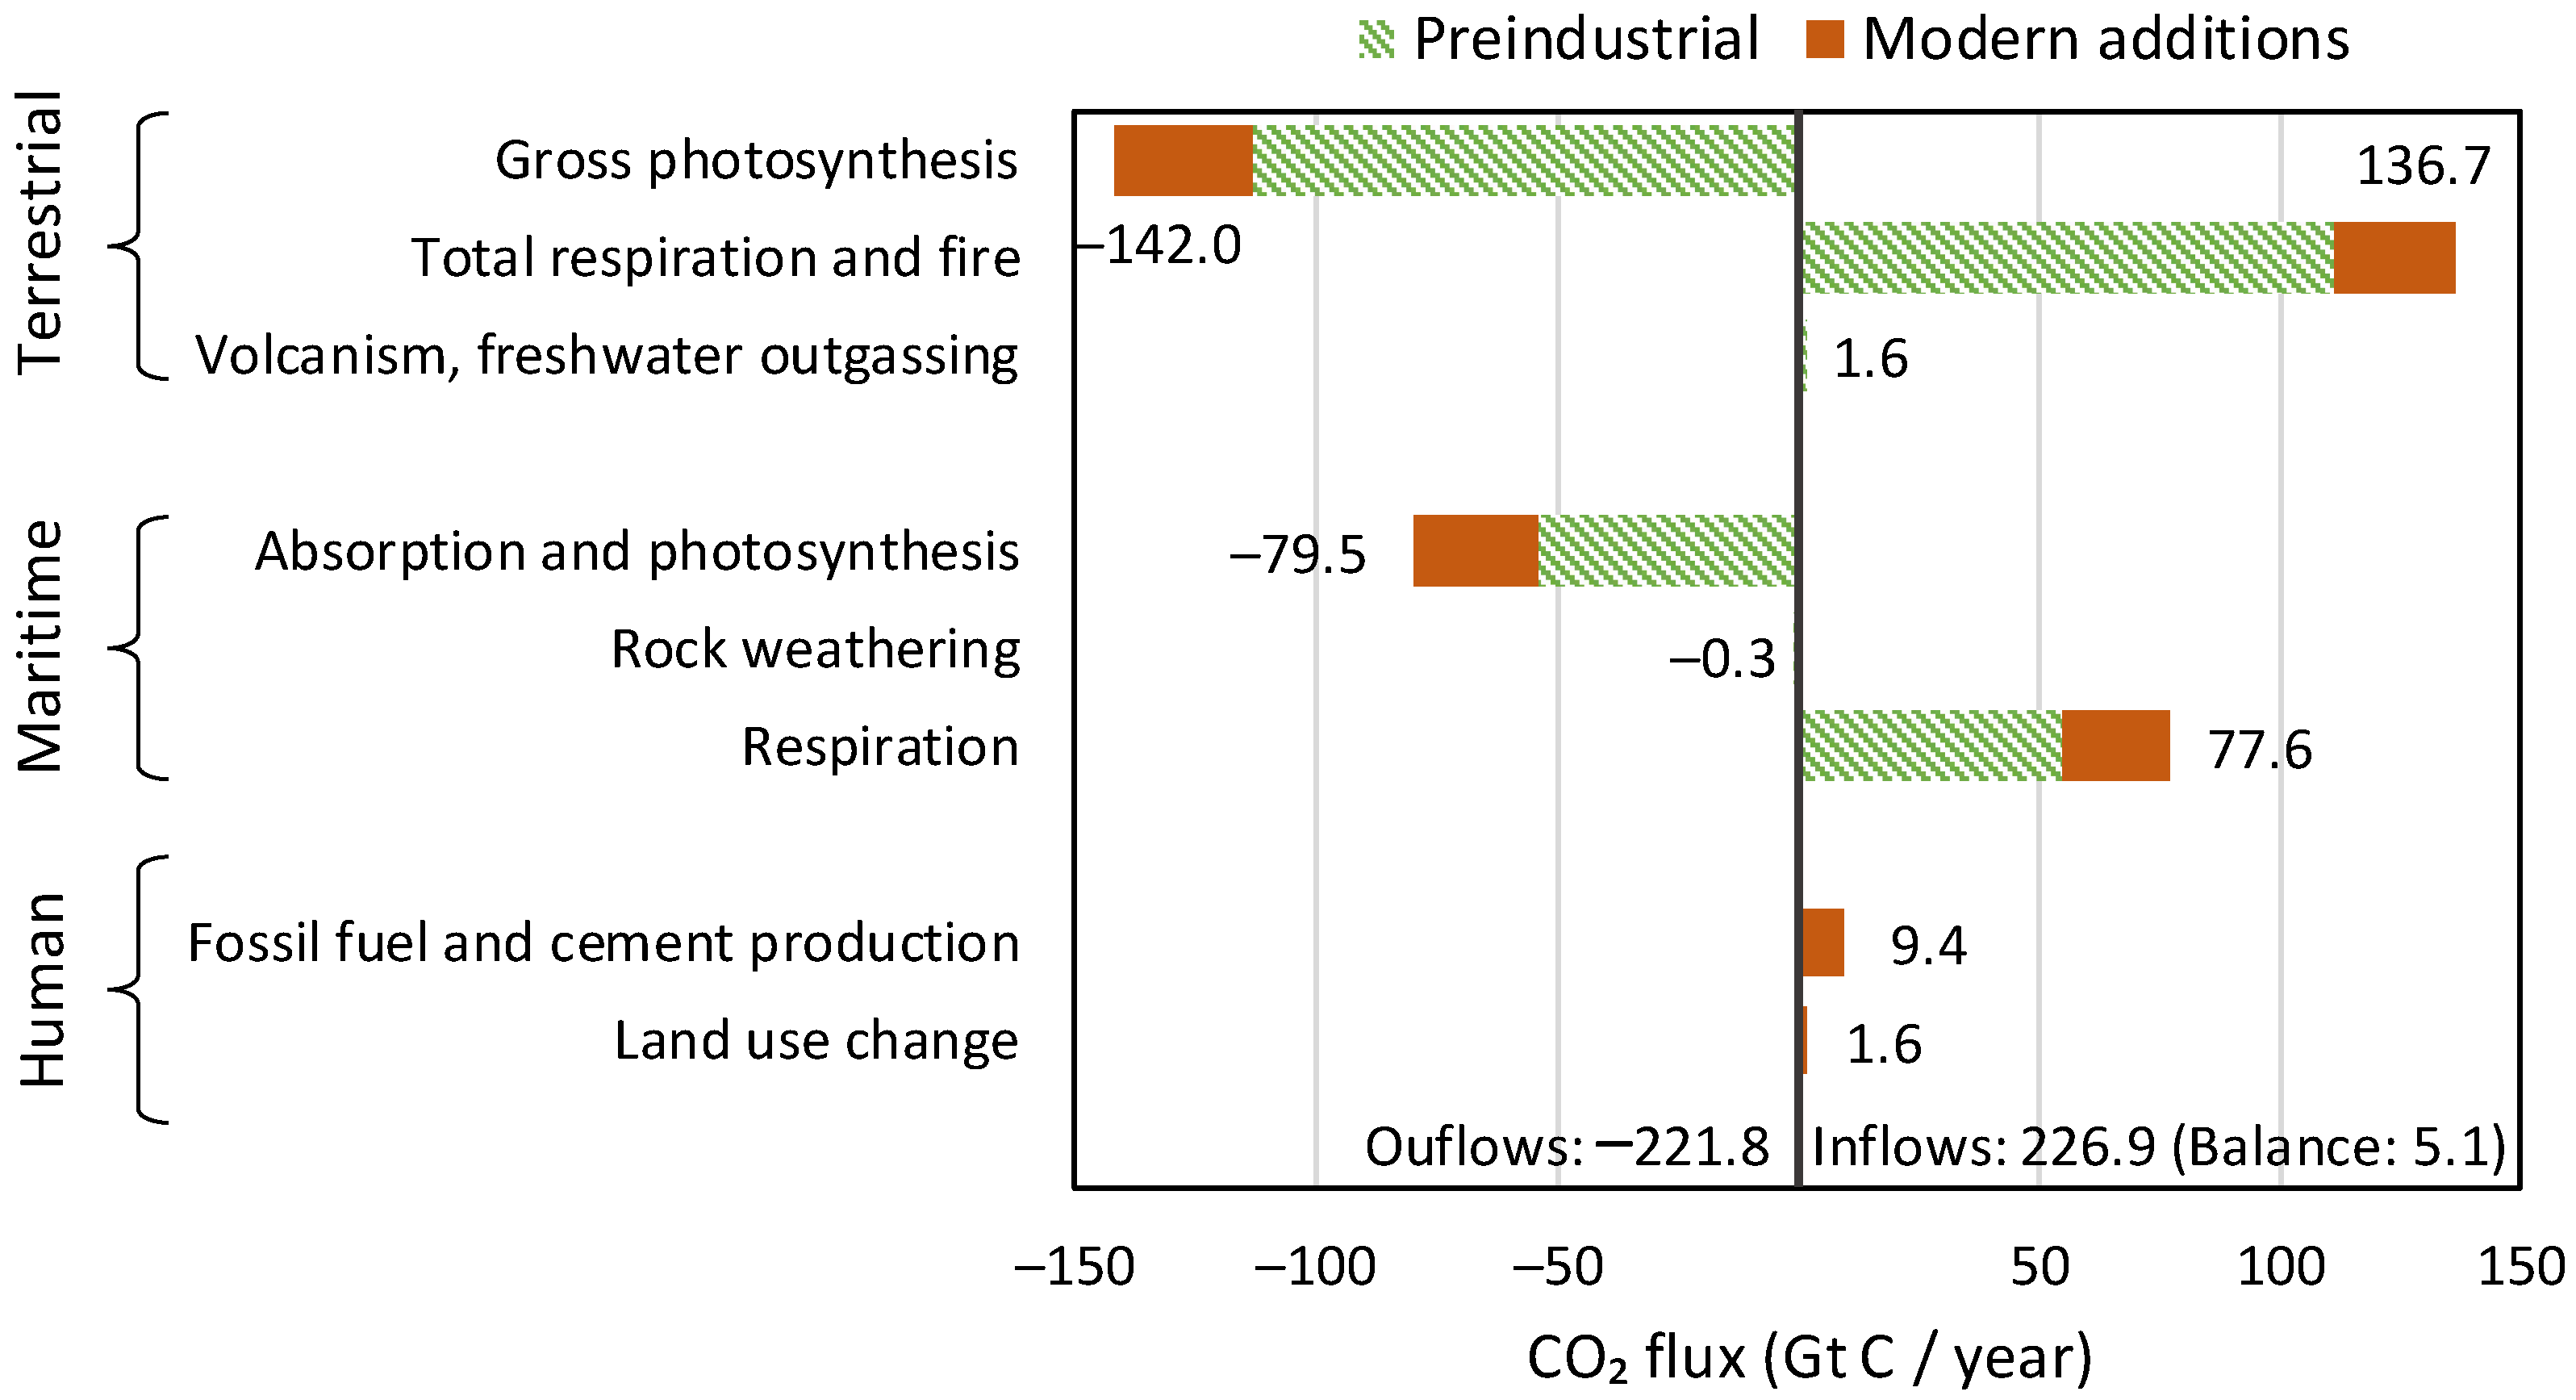
In both the diagnostic and the modelling phases of this paper, the inclusion of human emissions proved unnecessary. This may contrast with common opinion, which blames all changes on humans, but is absolutely reasonable, as humans are responsible for only 4% of carbon emissions. In addition, the vast majority of changes in the atmosphere since 1750 are due to natural processes, respiration and photosynthesis, as articulated in the recent study by Koutsoyiannis et al. [5] and schematically depicted in Figure 22, reproduced from that study.

Figure 22. Annual carbon balance in the Earth’s atmosphere, in Gt C/year, based on the IPCC estimates (Figure 5.12 of [30]). The balance of 5.1 Gt C/year is the annual accumulation of carbon (in the form of CO2) in the atmosphere (reproduced from [5].).
Conclusions
♦ Proxy data since the Little Ice Age suggest that the modern period of instrumental data does not differ, in terms of the net isotopic signature of atmospheric CO2 sources and sinks, from earlier centuries.
-
- In the 16th century, Earth entered a cool climatic period, known as the Little Ice Age, which ended at the beginning of the 19th century;
- Immediately after, a warming period began, which has lasted until now. The causes of the warming must be analogous to those that resulted in the Medieval Warm Period around 1000 AD, the Roman Climate Optimum around the first centuries BC and AD, the Minoan Climate Optimum at around 1500 BC, and other warming periods throughout the Holocene
- As a result of the recent warming, and as explained in [5], the biosphere has expanded and become more productive, leading to increased CO2 concentration in the atmosphere and greening of the Earth [17,18,19,32];
- As a result of the increased CO2 concentration, the isotopic signature δ13C in the atmosphere has decreased;
- The greenhouse effect on the Earth remained stable in the last century, as it is dominated by the water vapour in the atmosphere [31];
- Human CO2 emissions have played a minor role in the recent climatic evolution, which is hardly discernible in observational data and unnecessary to invoke in modelling the observed behaviours, including the change in the isotopic signature δ13C in the atmosphere.
in the carbon cycle (and through this in climate)
and a non-discernible signature of humans.
3 comments