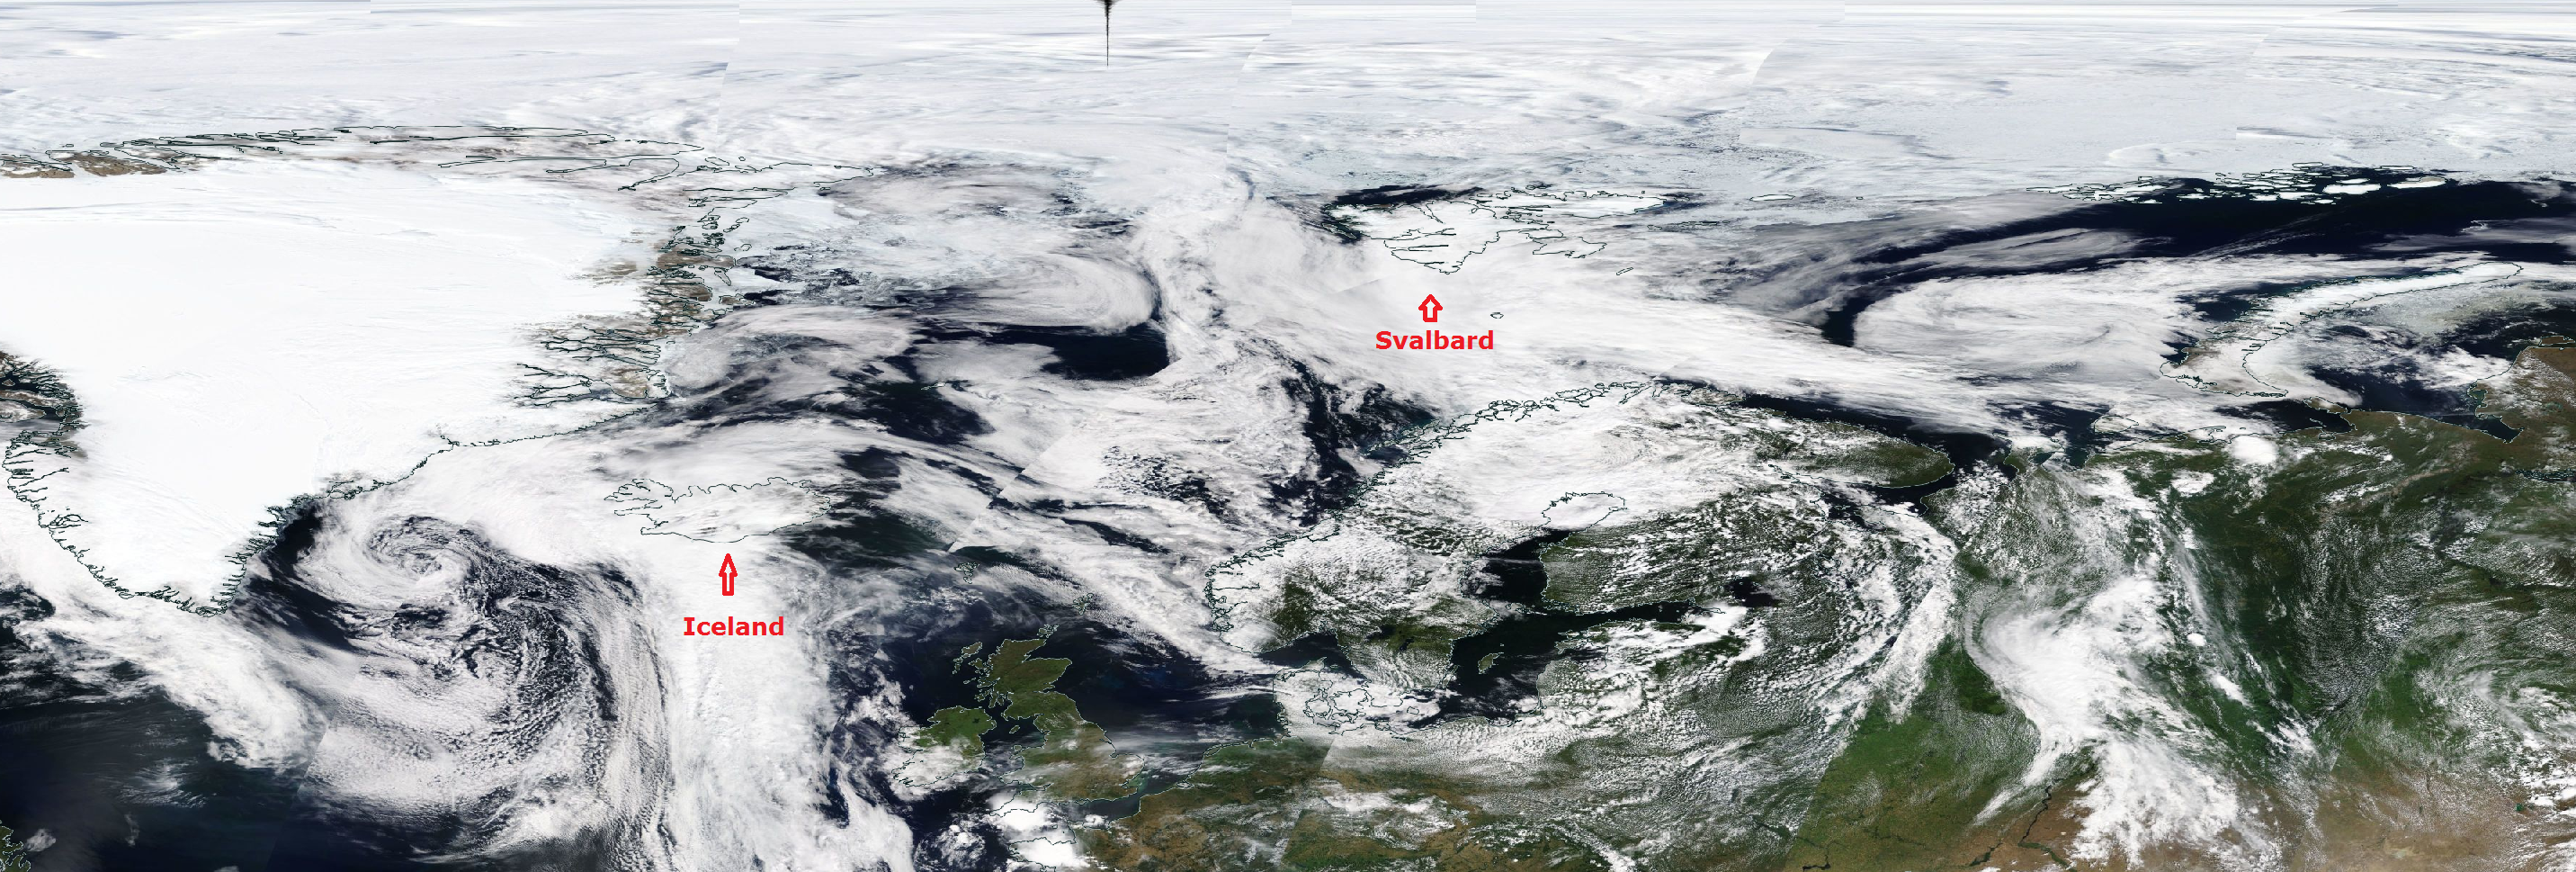
Source: NASA Worldview July 18, 2017. Click on image to enlarge.
July is showing again the resilience of Arctic ice this year. The graph below shows 2017 extents for the first 19 days of July compared to the average for the previous 11 years, to 2016, to 2007 and the SII (Sea Ice Index) estimates for 2017.
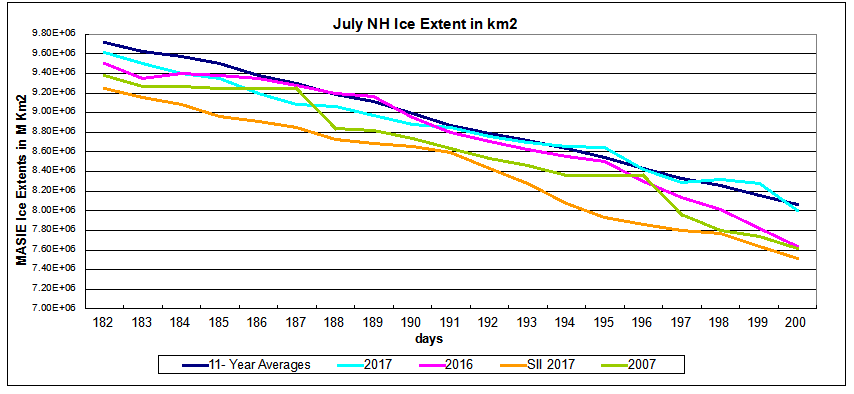
The graph shows 2017 holding to the decadal average and just yesterday dropping below 8M km2, one day ahead of average. Meanwhile the other extents are much lower than 2017: 2016 is down 357k km2, 2007 is 379k km2 down, and SII shows 2017 480k km2 less than MASIE day 200.
As we shall see, this year’s extents are in surplus on the Atlantic side, offset by deficits on the Pacific side and in Hudson Bay. The image shows the evolution of Arctic ice from 2007 to this year for day 200.
Click on image to enlarge.
The Table compares 2017 day 200 ice extents with the decadal average and 2007
| Region | 2017200 | Day 200 Average |
2017-Ave. | 2007200 | 2017-2007 |
| (0) Northern_Hemisphere | 7997823 | 8064957 | -67133 | 7618029 | 379795 |
| (1) Beaufort_Sea | 806596 | 819503 | -12906 | 797272 | 9324 |
| (2) Chukchi_Sea | 514591 | 619294 | -104704 | 488952 | 25638 |
| (3) East_Siberian_Sea | 744800 | 937942 | -193142 | 707353 | 37447 |
| (4) Laptev_Sea | 666317 | 584009 | 82308 | 455463 | 210854 |
| (5) Kara_Sea | 321934 | 310630 | 11304 | 377648 | -55714 |
| (6) Barents_Sea | 74053 | 45893 | 28160 | 55933 | 18120 |
| (7) Greenland_Sea | 478308 | 388587 | 89721 | 375816 | 102492 |
| (8) Baffin_Bay_Gulf_of_St._Lawrence | 371429 | 238537 | 132893 | 278443 | 92986 |
| (9) Canadian_Archipelago | 624373 | 685089 | -60717 | 686749 | -62376 |
| (10) Hudson_Bay | 172045 | 258697 | -86652 | 170690 | 1355 |
| (11) Central_Arctic | 3222235 | 3173093 | 49143 | 3221912 | 323 |
2007 overall ice extent on day 200 was lower by 380k km2, 2017 showing surpluses everywhere except Kara and CAA (Canadian Arctic Archipelago). Compared to the decadal average, the 2017 larger deficits are in the Pacific ( Chukchi and East Siberian) and in Canada (Hudson Bay and CAA). These are offset by above average extents elsewhere, especially in Laptev, Greenland, Baffin and Central Arctic. Barents is still surplus to average, but has now fallen behind 2014 as the highest in the last decade.
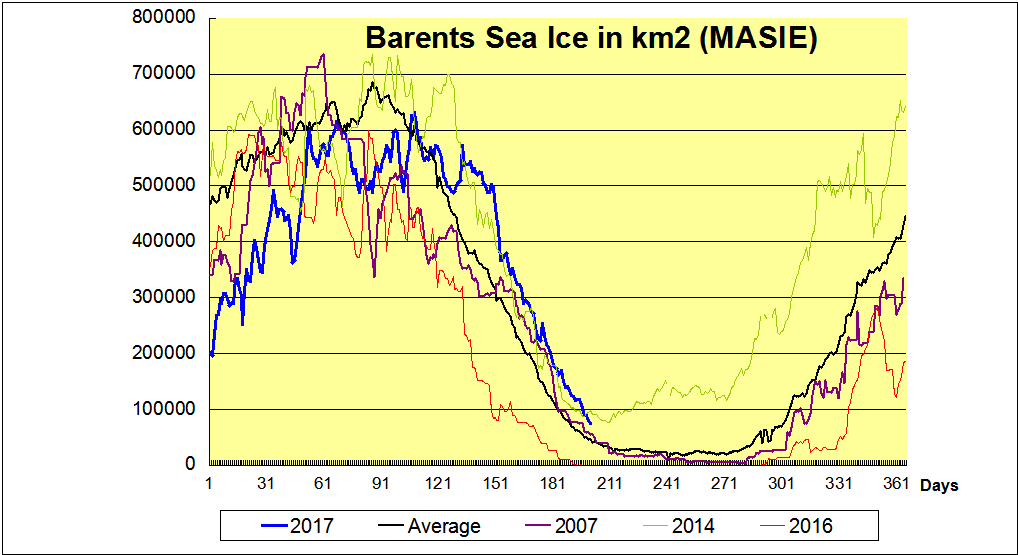
The black line is average for the last 11 years. 2007 in purple appears close to an average year. 2014 had the highest annual extent in Barents Sea, due to higher and later maximums, holding onto ice during the summer, and recovering quickly. In contrast, 2016 was the lowest annual extent, melting out early and recovering later. 2017 in blue started out way behind, but grew rapidly to reach average, and then persisted longer to exceed even 2014 before falling behind just recently.
For more on why Barents Sea matters see Barents Icicles


Reblogged this on Climate Collections.
LikeLike
Reblogged this on WeatherAction News.
LikeLike