Update July 4 below
When you see a graph like that below, it is obvious that an unusually strong El Nino just happened in our climate system. It resulted in higher global temperatures the last two years and so far in 2016. But that event is over now, and naturally we wonder what to expect in the months and years ahead.

For example some comments from a recent thread at WUWT (here) were intriguing:
It will be interesting to see what comes next. The major difference between the 1998 el nino and this one is that in 1998 the sun was increasing in solar activity, while this one solar activity is decreasing. (rishrac)

Nino3,4 and UAH LT dC Anomalies, and UAH LT Scaled *3 and Lagged 4 Months h/t Allan MacRae
And richard takes the long view of the situation:
While we all stare at the short-term ups and downs of the global temperatures, pay a little thought to the fact that the Earth’s orbit around the Sun causes snow in the winter and warmth during the summer, so it may be important?
Perihelion presently occurs around January 3, (Northern hemisphere winter, Southern summer) while aphelion is around July 4. Therefore, the southern hemisphere receives more solar radiation and is therefore warmer in summer and colder in winter (aphelion). The Northern hemisphere has cooler summers and milder winter (solar radiation-wise).
Also the northern hemispheres autumn and winter are slightly shorter than spring and summer, because the Earth is moving faster around the Sun in winter slower in summer.
This alone could account for “Global Warming” attributed to CO2, (which no doubt plays some part in it).
Over the next 10,000 years, northern hemisphere winters will become gradually longer and summers will become shorter, due to the change in the Earth’s Orbital Eccentricity.
Couple this with changes in the Earth’s tilt, which varies from 22.1 degrees to 24.5 degrees, (currently at 23.4 degrees). More tilt means more solar radiation gets to the poles (global warming) and less tilt means less radiation gets to the poles (global cooling). The last maximum tilt occurred in 8700 BC (Holocene maximum) and the next minimum tilt will happen in 11,800 AD (the advance of the ice sheets), precisely at the time of longer northern winters and shorter summers.

Orbital Climate Factors: E for eccentricity, T for tilt, and P for precession
Predicting the Future is Tough
Chiefio (E.M. Smith) has a good post (here) reminding us that statistical projections do not help us much in this case. Temperature series produced by our climate system have special qualities. The patterns are auto-correlated, meaning that tomorrow’s weather will be similar to today’s; the occurrence is not totally independent, like the flip of coin. IOW there is momentum in the climate characteristics, which can and do fluctuate over seasons, decades, centuries and more. Our attempts to use linear regressions to forecast are thwarted by temperature time series that do not follow a normal gaussian distribution, and are semi-chaotic and non-stationary.
Four Possibilities Forward From Today
From past experience, the next few years could logically follow one of four temperature scenarios:
1. The Plateau since 1998 continues.
2. The Warming prior to 1998 resumes.
3. A new Plateau begins with 2016 at a higher (step up) level.
4. A Cooling begins comparable to the years after 1940.
All of these have analogues in our recent climate observations. If this now finished El Nino triggers a regime change comparable to the 1998 event, then a step-up plateau can result. If warmists are right, and there is a release of pent-up heat in the system, then a warming trend would resume.
If this El Nino is not strong enough to shift the regime, then the Plateau could continue at the same level. Finally, it could be that several factors align to reverse the warming since the 1970’s, and bring a return to cooler 1950’s weather.
Those who see a quasi-60 year cycle in weather patterns note that it is about time for the PDO in the Pacific and the AMO in the Atlantic to be in cooler phases, along with a quiet sun, which went spotless last week. There are also those attending to orbital climate patterns, which gave us the Modern Warming Period and will eventually take it away.

Changes in climate due to earth’s orbit around the sun
Update July 4
In the thread below is a chart from J Martin displaying the effects of the changing tilt of earth’s axis. As shown, the long term pattern is toward cooling.

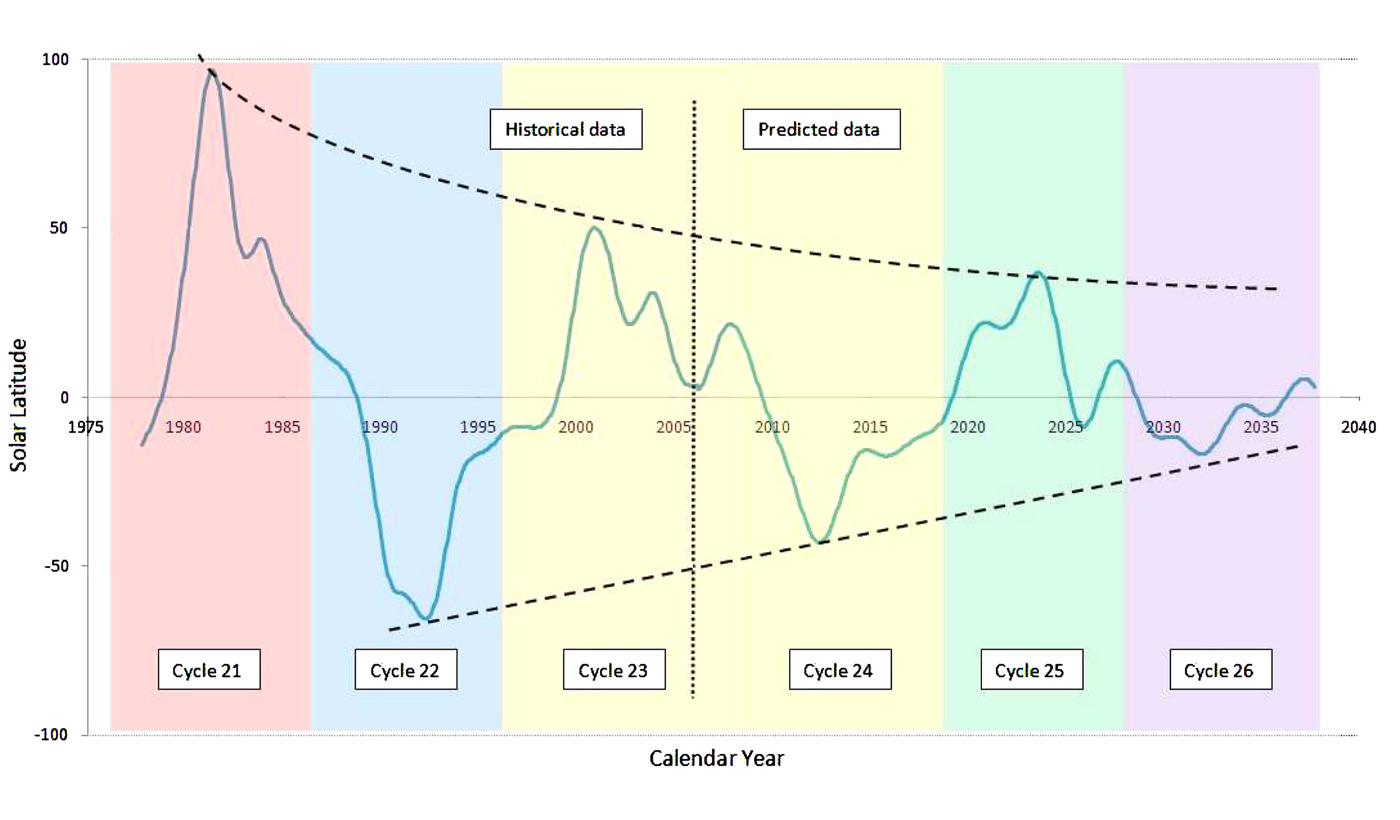
In addition, ren provides interesting links to studies showing SA (Sunspot numbers) correlating to Middle Ages Warm period and LIA, and a 2012 study forecasting the next 2 cycles.
Figure 1. Bottom plot: the summary component of the two PCs (solid curve) and the decaying component (dashed curves) for the “historical” data (cycles 21–23) and predicted data (cycles 24–26). The cycle lengths (about 11 yr) are marked with different colors.

Again, to the extent that SSNs are a proxy for changes in heat content within the earth’s climate system, the graph is also indicating future cooling.
For quantification of climate effects from Solar Activity, see:
Quantifying Natural Climate Change

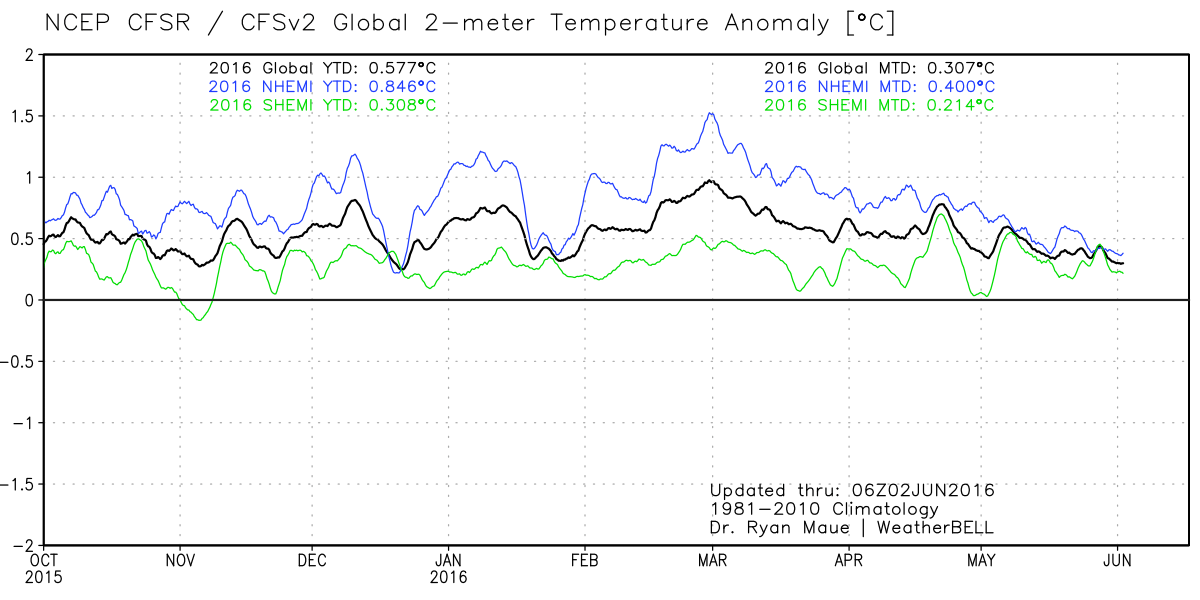


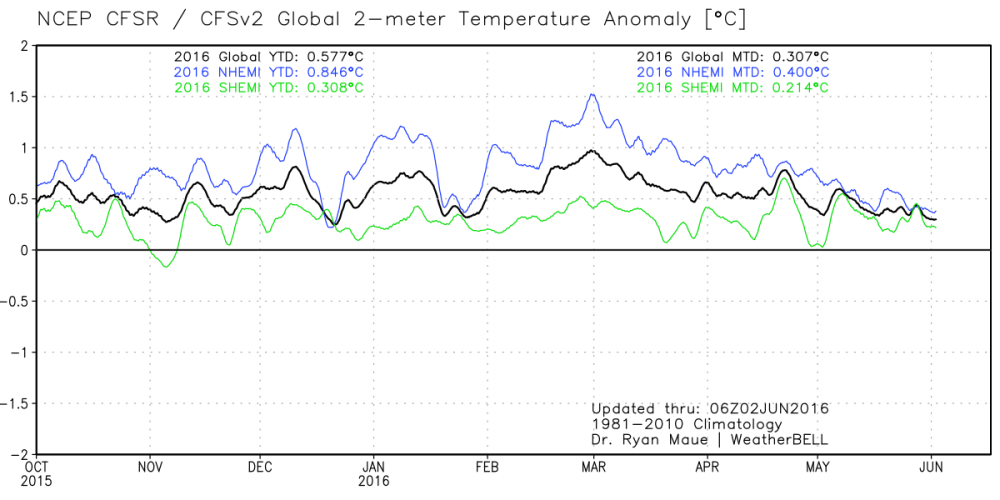 Here is a great view of how the 2015-16 El Nino caused higher surface temperatures last year and this, displayed in 2-meter temp anomalies (weather station height). The satellites’ data show the uptick began in earnest October 2015 and returned to neutral in May 2016. SSTs are now firmly in neutral.