“Freedom’s Just Another Word for Nothing Left to Lose.” (Kris Kristofferson)
In May, Arctic ice extent declined as usual with the notable exception of Bering Sea, now almost ice free. Bering still has some ice to lose, but at 23k km2 it is only 5% of the ice there March 17 at annual Bering maximum, just two months ago. It is unusual since the Bering ice is only 10% of the 11 year average for this date. Nearby Chukchi Sea is showing open water, somewhat ahead of schedule. Okhotsk also in the Pacific is melting and now below average for this date.
Elsewhere things are mostly typical. Russian and Canadian basins are frozen with high extents and Barents is now matching average.
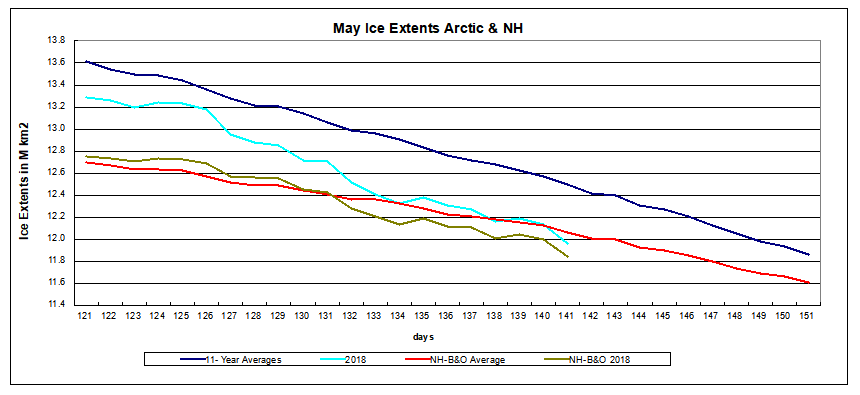
The graph below shows how the Arctic extent has faired in May compared to the 11 year average with and without the Pacific basins of Bering and Okhotsk. 2018 (brown line lacks B&O) is tracking the orange line with some divergence lately.
The graph below shows May 2018 compared to average and some years of interest.
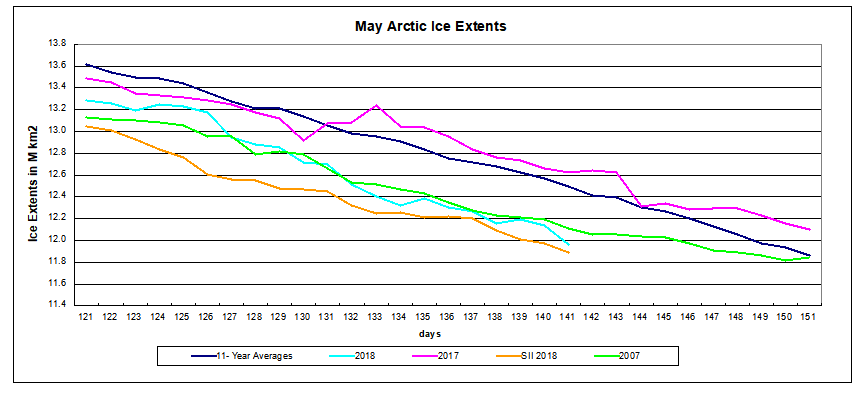
Note that 2017 tracks above the 11-year average. 2018 is tracking 2007, which will match average by end of May. The table below shows ice extents by regions comparing 2018 with 11-year average (2007 to 2017 inclusive) and 2007.
| Region | 2018141 | Day 141 Average |
2018-Ave. | 2007141 | 2018-2007 |
| (0) Northern_Hemisphere | 11963940 | 12493152 | -529212 | 12114407 | -150467 |
| (1) Beaufort_Sea | 1046328 | 1025787 | 20541 | 1063324 | -16996 |
| (2) Chukchi_Sea | 790287 | 916151 | -125864 | 936237 | -145949 |
| (3) East_Siberian_Sea | 1076816 | 1074527 | 2289 | 1067808 | 9008 |
| (4) Laptev_Sea | 893794 | 866784 | 27009 | 793551 | 100243 |
| (5) Kara_Sea | 934453 | 881645 | 52808 | 885543 | 48909 |
| (6) Barents_Sea | 401369 | 396306 | 5063 | 327568 | 73801 |
| (7) Greenland_Sea | 441882 | 606737 | -164856 | 576791 | -134909 |
| (8) Baffin_Bay_Gulf_of_St._Lawrence | 1125388 | 1062146 | 63242 | 968062 | 157325 |
| (9) Canadian_Archipelago | 839235 | 833381 | 5854 | 837658 | 1577 |
| (10) Hudson_Bay | 1153411 | 1158944 | -5533 | 1097706 | 55705 |
| (11) Central_Arctic | 3132441 | 3231803 | -99361 | 3235644 | -103203 |
| (12) Bering_Sea | 23001 | 268930 | -245929 | 213547 | -190547 |
| (13) Baltic_Sea | 788 | 2344 | -1556 | 2146 | -1358 |
| (14) Sea_of_Okhotsk | 103188 | 165353 | -62165 | 106753 | -3565 |
As indicated Bering supplies almost half of the deficit to average, along with Chukchi and Okhotsk deficits. Lack of ice in Greenland Sea may signify a reduced flow of drift ice out of the Arctic through Fram Strait.

Current ice chart from AARI St. Petersburg Russia. Old sea ice is in brown.
