Climate Models Flagged for Running Out of Bounds
Roger Pielke Jr. explains that climate models projections are unreliable because they are based on scenarios no longer bounded by reality. His article is The Unstoppable Momentum of Outdated Science. Excerpts in italics with my bolds.
Much of climate research is focused on implausible scenarios of the future, but implementing a course correction will be difficult.
In 2020, climate research finds itself in a similar situation to that of breast cancer research in 2007. Evidence indicates the scenarios of the future to 2100 that are at the focus of much of climate research have already diverged from the real world and thus offer a poor basis for projecting policy-relevant variables like economic growth and carbon dioxide emissions. A course-correction is needed.
In a new paper of ours just out in Environmental Research Letters we perform the most rigorous evaluation to date of how key variables in climate scenarios compare with data from the real world (specifically, we look at population, economic growth, energy intensity of economic growth and carbon intensity of energy consumption). We also look at how these variables might evolve in the near-term to 2040.
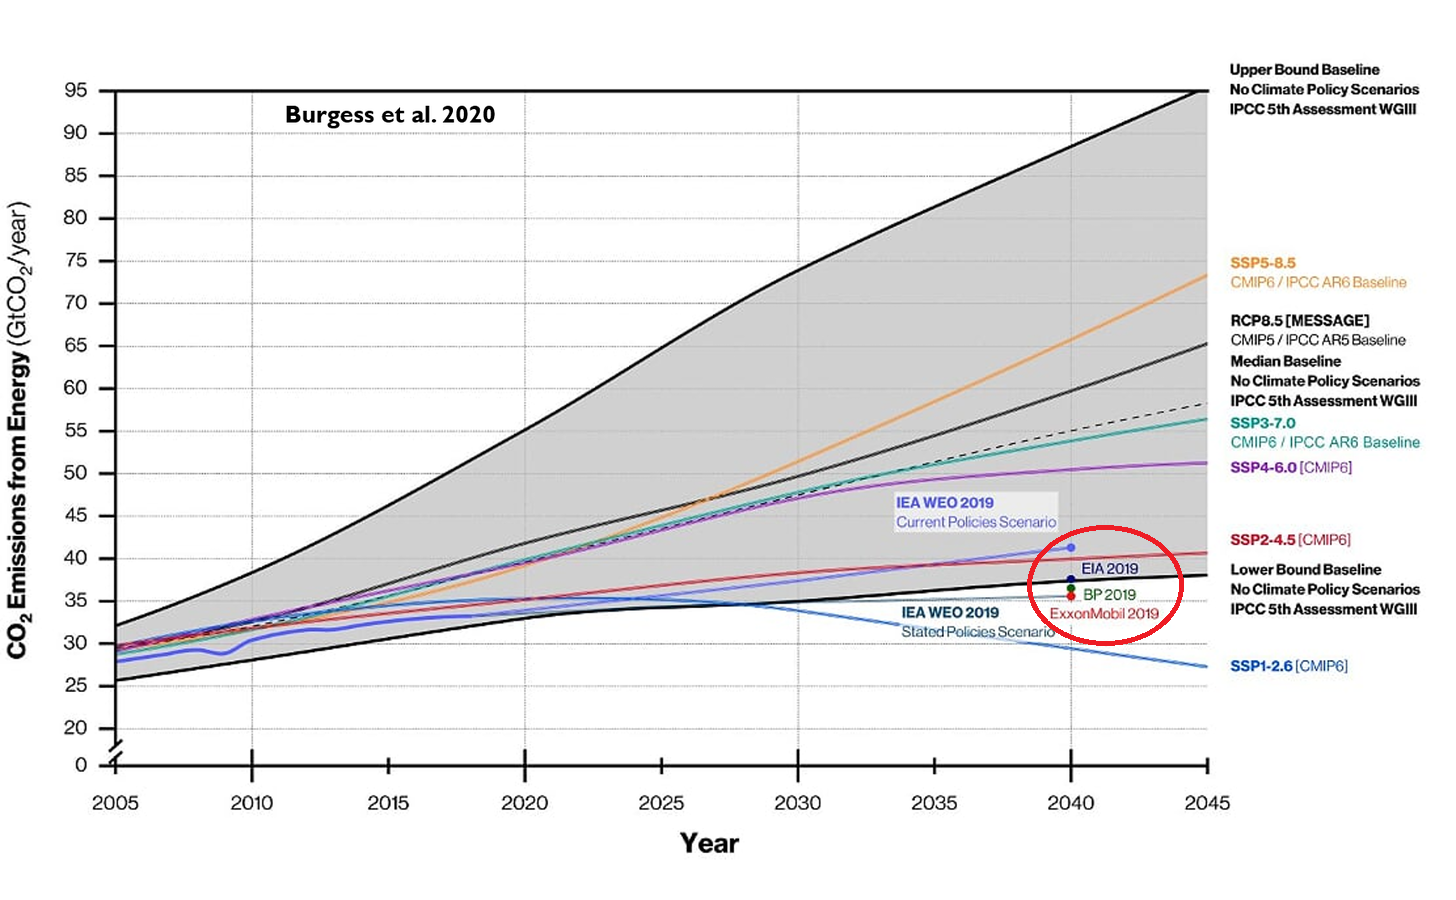
We find that the most commonly-used scenarios in climate research have already diverged significantly from the real world, and that divergence is going to only get larger in coming decades. You can see this visualized in the graph above, which shows carbon dioxide emissions from fossil fuels from 2005, when many scenarios begin, to 2045. The graph shows emissions trajectories projected by the most commonly used climate scenarios (called SSP5-8.5 and RCP8.5, with labels on the right vertical axis), along with other scenario trajectories. Actual emissions to date (dark purple curve) and those of near-term energy outlooks (labeled as EIA, BP and ExxonMobil) all can be found at the very low end of the scenario range, and far below the most commonly used scenarios.
Our paper goes into the technical details, but in short, an important reason for the lower-than-projected carbon dioxide emissions is that economic growth has been slower than expected across the scenarios, and rather than seeing coal use expand dramatically around the world, it has actually declined in many regions.
It is even conceivable, if not likely, that in 2019 the world has passed “peak carbon dioxide emissions.” Crucially, the projections in the figure above are pre-Covid19, which means that actual emissions 2020 to 2045 will be even less than was projected in 2019.
While it is excellent news that the broader community is beginning to realize that scenarios are increasingly outdated, voluminous amounts of research have been and continue to be produced based on the outdated scenarios. For instance, O’Neill and colleagues find that “many studies” use scenarios that are “unlikely.” In fact, in their literature review such “unlikely” scenarios comprise more than 20% of all scenario applications from 2014 to 2019. They also call for “re-examining the assumptions underlying” the high-end emissions scenarios that are favored in physical climate research, impact studies and economic and policy analyses.
Make no mistake. The momentum of outdated science is powerful. Recognizing that a considerable amount of climate science to be outdated is, in the words of the late Steve Rayer, “uncomfortable knowledge” — that knowledge which challenges widely-held preconceptions. According to Rayner, in such a context we should expect to see reactions to uncomfortable knowledge that include:
- denial (that scenarios are off track),
- dismissal (the scenarios are off track, but it doesn’t matter),
- diversion (the scenarios are off track, but saying so advances the agenda of those opposed to action) and,
- displacement (the scenarios are off track but there are perhaps compensating errors elsewhere within scenario assumptions).
Such responses reinforce the momentum of outdated science and make it more difficult to implement a much needed course correction.
Responding to climate change is critically important. So too is upholding the integrity of the science which helps to inform those responses. Identification of a growing divergence between scenarios and the real-world should be seen as an opportunity — to improve both science and policy related to climate — but also to develop new ways for science to be more nimble in getting back on track when research is found to be outdated.
[A previous post is reprinted below since it demonstrates how the scenarios drive forecasting by CMIP6 models, including the example of the best performant model: INMCM5]
Background from Previous Post : Best Climate Model: Mild Warming Forecasted
Links are provided at the end to previous posts describing climate models 4 and 5 from the Institute of Numerical Mathematics in Moscow, Russia. Now we have forecasts for the 21st Century published for INM-CM5 at Izvestiya, Atmospheric and Oceanic Physics volume 56, pages218–228(July 7, 2020). The article is Simulation of Possible Future Climate Changes in the 21st Century in the INM-CM5 Climate Model by E. M. Volodin & A. S. Gritsun. Excerpts are in italics with my bolds, along with a contextual comment.
Abstract
Climate changes in 2015–2100 have been simulated with the use of the INM-CM5 climate model following four scenarios: SSP1-2.6, SSP2-4.5, and SSP5-8.5 (single model runs) and SSP3-7.0 (an ensemble of five model runs). Changes in the global mean temperature and spatial distribution of temperature and precipitation are analyzed. The global warming predicted by the INM-CM5 model in the scenarios considered is smaller than that in other CMIP6 models. It is shown that the temperature in the hottest summer month can rise more quickly than the seasonal mean temperature in Russia. An analysis of a change in Arctic sea ice shows no complete Arctic summer ice melting in the 21st century under any model scenario. Changes in the meridional stream function in atmosphere and ocean are studied.
Overview
The climate is understood as the totality of statistical characteristics of the instantaneous states of the atmosphere, ocean, and other climate system components averaged over a long time period.
Therefore, we restrict ourselves to an analysis of some of the most important climate parameters, such as average temperature and precipitation. A more detailed analysis of individual aspects of climate change, such as changes in extreme weather and climate situations, will be the subject of another work. This study is not aimed at a full comparison with the results of other climate models, where calculations follow the same scenarios, since the results of other models have not yet been published in peer reviewed journals by the time of this writing.
The INM-CM5 climate model [1, 2] is used for the numerical experiments. It differs from the previous version, INMCM4, which was also used for experiments on reproducing climate change in the 21st century [3], in the following:
- an aerosol block has been added to the model, which allows inputting anthropogenic emissions of aerosols and their precursors;
- the concentrations and optical properties of aerosols are calculated, but not specified, like in the previous version;
- the parametrizations of cloud formation and condensation are changed in the atmospheric block;
- the upper boundary in the atmospheric block is raised from 30 to 60 km;
- the horizontal resolution in the ocean block is doubled along each coordinate; and,
- the software related to adaptation to massively parallel computers is improved, which allows the effective use a larger number of compute cores.
The model resolution in the atmospheric and aerosol blocks is 2° × 1.5° in longitude and latitude and 73 levels and, in the ocean, 0.5° × 0.25° and 40 levels. The calculations were performed at supercomputers of the Joint Supercomputer Center, Russian Academy of Sciences, and Moscow State University, with the use of 360 to 720 cores. The model calculated 6–10 years per 24 h in the above configuration.
Four scenarios were used to model the future climate: SSP1-2.6, SSP2-4.5, SSP3-7.0, and SSP5-8.5. The scenarios are described in [4]. The figure after the abbreviation SSP (Shared Socioeconomic Pathway) is the number of the mankind development path (see the values in [4]). The number after the dash means the radiation forcing (W m–2) in 2100 compared to the preindustrial level. Thus, the SSP1-2.6 scenario is the most moderate and assumes rapid actions which sharply limit and then almost completely stop anthropogenic emissions. Within this scenario, greenhouse gas concentrations are maximal in the middle of the 21st century and then slightly decrease by the end of the century. The SSP5-8.5 scenario is the warmest and implies the fastest climate change. The scenarios are recommended for use in the project on comparing CMIP6 (Coupled Model Intercomparison Project, Phase 6, [5]) climate models. Each scenario includes the time series of:
- carbon dioxide, methane, nitrous oxide, and ozone concentrations;
- emissions of anthropogenic aerosols and their precursors;
- the concentration of volcanic sulfate aerosol; and
- the solar constant.
One model experiment was carried out for each of the above scenarios. It began at the beginning of 2015 and ended at the end of 2100. The initial state was taken from the so-called historical experiment with the same model, where climate changes were simulated for 1850–2014, and all impacts on the climate system were set according to observations. The results of the ensemble of historical experiments with the model under consideration are given in [6, 7]. For the SSP3-7.0 scenario, five model runs was performed differing in the initial data taken from different historical experiments. The ensemble of numerical experiments is required to increase the statistical confidence of conclusions about climate changes.
[My Contextual Comment inserted Prior to Consideration of Results]
Firstly, the INM-CM5 historical experiment can be read in detail by following a linked post (see Resources at the end), but this graphic summarizes the model hindcasting of past temperatures (GMT) compared to HadCrutv4.
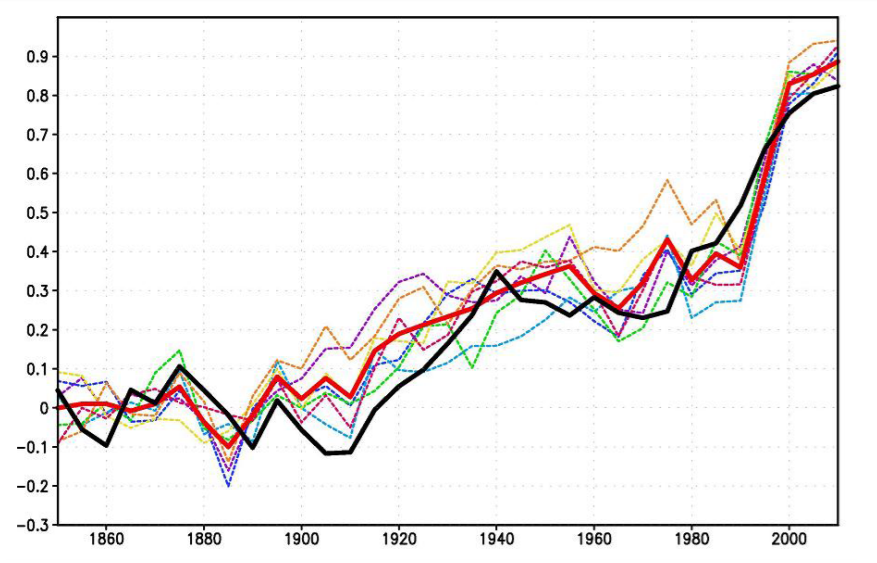
Figure 1. The 5-year mean GMST (K) anomaly with respect to 1850–1899 for HadCRUTv4 (thick solid black); model mean (thick solid red). Dashed thin lines represent data from individual model runs: 1 – purple, 2 – dark blue, 3 – blue, 4 – green, 5 – yellow, 6 – orange, 7 – magenta. In this and the next figures numbers on the time axis indicate the first year of the 5-year mean.
Secondly, the scenarios are important to understand since they stipulate data inputs the model must accept as conditions for producing forecasts according to a particular scenario (set of assumptions). The document with complete details referenced as [4] is The Scenario Model Intercomparison Project (ScenarioMIP) for CMIP6.
All the details are written there but one diagram suggests the implications for the results described below.
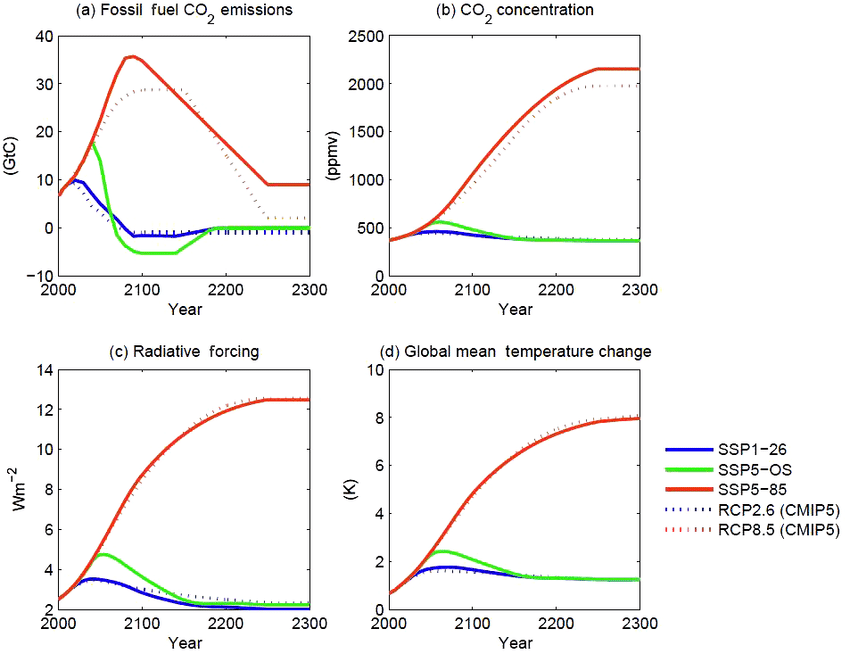
Figure 5. CO2 emissions (a) and concentrations (b), anthropogenic radiative forcing (c), and global mean temperature change (d) for the three long-term extensions. As in Fig. 3, concentration, forcing, and temperature outcomes are calculated with a simple climate model (MAGICC version 6.8.01 BETA; Meinshausen et al., 2011a, b). Outcomes for the CMIP5 versions of the long-term extensions of RCP2.6 and RCP8.5 (Meinshausen et al., 2011c), as calculated with the same model, are shown for comparison.
As shown, the SSP1-26 is virtually the same scenario as the former RCP2.6, while SSP5-85 is virtually the same as RCP8.5, the wildly improbable scenario (impossible according to some analysts). Note that FF CO2 emissions are assumed to quadruple in the next 80 years, with atmospheric CO2 rising from 400 to 1000 ppm ( +150%). Bear these suppositions in mind when considering the INMCM5 forecasts below.
Results [Continuing From Volodin and Gritsun]
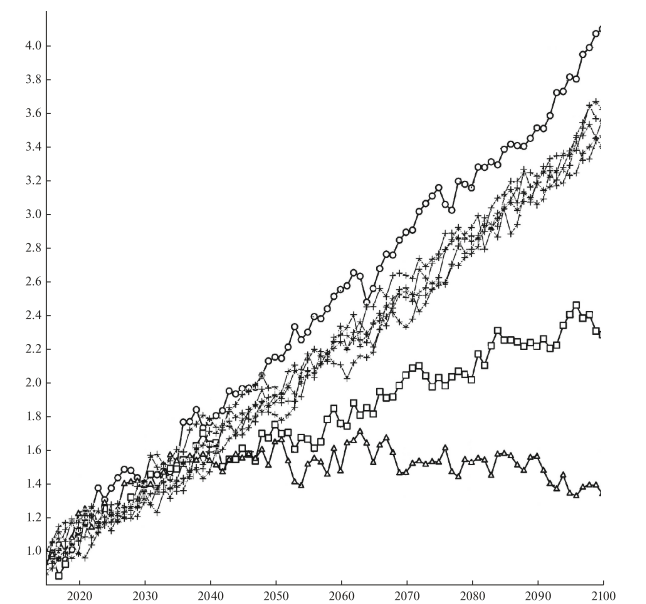
Fig. 1. Changes in the global average surface temperature (K) with respect to the pre-industrial level in experiments according to the SSP1-2.6 (triangles), SSP2-4.5 (squares), SSP3-7.0 (crosses), and SSP5-8.5 (circles) scenarios.
Let us describe some simulation results of climate change in the 21st century. Figure 1 shows the change in the globally averaged surface air temperature with respect to the data of the corresponding historical experiment for 1850–1899. In the warmest SSP5-8.5 scenario (circles), the temperature rises by more than 4° by the end of the 21st century. In the SSP3-7.0 scenario (crosses), different members of the ensemble show warming by 3.4°–3.6°. In the SSP2-4.5 scenario (squares), the temperature increases by about 2.4°. According to the SSP1-2.6 scenario (triangles) , the maximal warming by ~1.7° occurs in the middle of the 21st century, and the temperature exceeds the preindustrial temperature by 1.4° by the end of the century.
[My comment: Note that the vertical scale starts with +1.0C as was seen in the historical experiment. Thus an anomaly of 1.4C by 2100 is an increase of only 0.4C, while the SSP2-4.5 result adds 1.4C to the present].
The results for other CMIP6 models have not yet been published in peer-reviewed journals. However, according to the preliminary analysis (see, e.g. https://cmip6workshop19.sciencesconf.org/ data/Session1_PosterSlides.pdf, p.29), the INM-CM5 model shows the lowest temperature increase among the CMIP6 models considered for all the scenarios due to the minimal equilibrium sensitivity to the CO2 concentration doubling, which is ~2.1° for the current model version, like for the previous version, despite new condensation and cloud formation blocks. [For more on CMIP6 comparisons see post Climate Models: Good, Bad and Ugly]
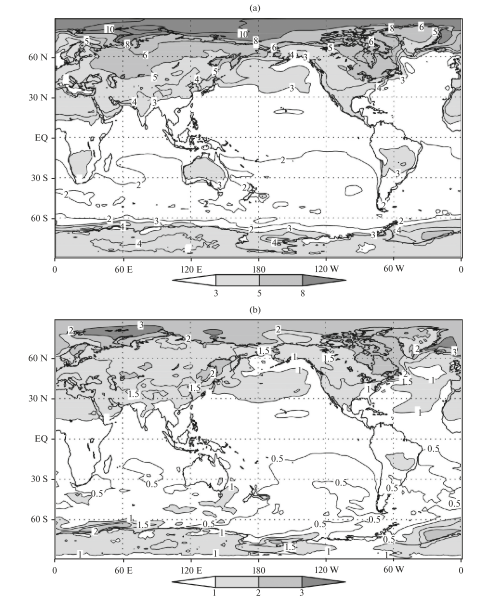
Fig. 2. Differences between the annual average surface air temperatures (K) in 2071–2100 and 1981–2010 for the (a) SSP5-8.5 and (b) SSP1-2.6 scenarios.
The changes in the surface air temperature are similar for all scenarios; therefore, we analyze the difference between temperatures in 2071–2100 and 1981–2010 under the SSP5-8.5 and SSP1-2.6 scenarios (Fig. 2). The warming is maximal in the Arctic; it reaches 10° and 3°, respectively. Other features mainly correspond to CMIP5 data [8], including the INMCM4 model, which participates in the comparison. The warming on the continents of the Northern Hemisphere is about 2 times higher than the mean, and the warming in the Southern Hemisphere is noticeably less than in the Northern Hemisphere. The land surface is getting warmer than the ocean surface in all the scenarios except SSP1-2.6, because the greenhouse effect is expected to weaken in the second half of the 21st century in this scenario, and the higher heat capacity of the ocean prevents it from cooling as quickly as the land.
The changes in precipitation in December–February and June–August for the SSP3-7.0 scenario averaged over five members of the ensemble are shown in Fig. 4. All members of the ensemble show an increase in precipitation in the winter in a significant part of middle and high latitudes. In summer, the border between the increase and decrease in precipitation in Eurasia passes mainly around or to the north of 60°. In southern and central Europe, all members of the ensemble show a decrease in precipitation. Precipitation also increases in the region of the summer Asian monsoon, over the equatorial Pacific, due to a decrease in the upwelling and an increase in ocean surface temperature (OST). The distribution of changes in precipitation mainly corresponds to that given in [6, Fig. 12.22] for all CMIP5 models.
The change in the Arctic sea ice area in September, when the ocean ice cover is minimal over the year, is of interest. Figure 5 shows the sea ice area in September 2015–2019 to be 4–6 million km2 in all experiments, which corresponds to the estimate from observations in [11]. The Arctic sea ice does not completely melt in any of the experiments and under any scenario. However, according to [8, Figs. 12.28 and 12.31], many models participating in CMIP6, where the Arctic ice area is similar to that observed at the beginning of the 21st century, show the complete absence of ice by the end of the 21st century, especially under the RCP8.5 scenario, which is similar to SSP5-8.5.
The reason for these differences is the lower equilibrium sensitivity of the INM-CM5 model.
Note that the scatter of data between experiments under different scenarios in the first half of the 21st century is approximately the same as between different members of the ensemble under the SSP3-7.0 scenario and becomes larger only after 2070. The sea ice area values are sorted in accordance with the radiative forcing of the scenarios only after 2090. This indicates the large contribution of natural climate variability into the Arctic ice area. In the SSP1-2.6 experiment, the Arctic ice area at the end of the 21st century approximately corresponds to its area at the beginning of the experiment.
Climate changes can be also traced in the ocean circulation. Figure 6 shows the change in the 5-year averaged intensity of the Atlantic meridional circulation, defined as the maximum of the meridional streamfunction at 32° N. All experiments show a decrease in the intensity of meridional circulation in the 21st century and natural fluctuations against this decrease. The decrease is about 4.5–5 Sv for the SSP5-8.5 scenario, which is close to values obtained in the CMIP5 models [8, Fig. 12.35] under the RCP8.5 scenario. Under milder scenarios, the weakening of the meridional circulation is less pronounced. The reason for this weakening of the meridional circulation in the Atlantic, as far as we know, is not yet fully understood.
Conclusion
Numerical experiments have been carried out to reproduce climate changes in the 21st century according to four scenarios of the CMIP6 program [4, 5], including an ensemble of five experiments under the SSP3-7.0 scenario. The changes in the global mean surface temperature are analyzed. It is shown that the global warming predicted by the INM-CM5 model is the lowest among the currently published CMIP6 model data. The geographical distribution of changes in the temperature and precipitation is considered. According to the model, the temperature in the warmest summer month will increase faster than the summer average temperature in Russia.
None of the experiments show the complete melting of the Arctic ice cover by the end of the 21st century. Some changes in the ocean dynamics, including the flow velocity and the meridional stream function, are analyzed. The changes in the Hadley and Ferrel circulation in the atmosphere are considered.

Resources:
Climate Models: Good, Bad and Ugly
