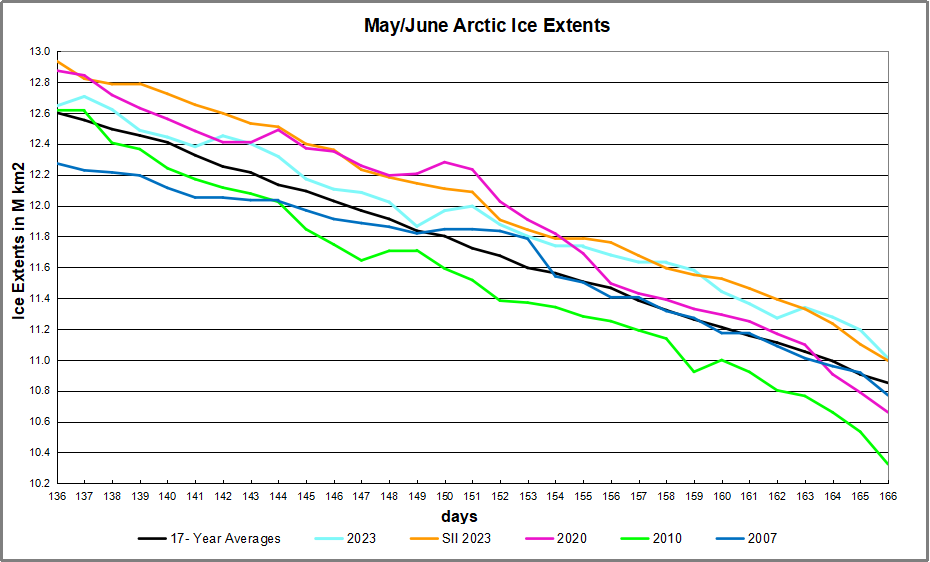
The graph for the last four weeks shows that 2023 Arctic ice continues to exceed the 17 year average from mid April to mid May. SII (Sea Ice Index) tracked MASIE with higher extents most of this period, while ending nearly the same. Meanwhile, other years, especially 2010 and 2020 were losing ice much more rapidly than average.
Why is this important? All the claims of global climate emergency depend on dangerously higher temperatures, lower sea ice, and rising sea levels. The lack of additional warming is documented in a post Satellite Temps Hit Bottom: February 2023.
The lack of acceleration in sea levels along coastlines has been discussed also. See USCS Warnings of Coastal Floodings
Also, a longer term perspective is informative:

The table below shows the distribution of Sea Ice across the Arctic Regions, on average, this year and 2010.
| Region | 2023166 | Day 166 Average | 2023-Ave. | 2010166 | 2023-2010 |
| (0) Northern_Hemisphere | 11010785 | 10850760 | 160025 | 10534077 | 476708 |
| (1) Beaufort_Sea | 1004738 | 970162 | 34577 | 933194 | 71545 |
| (2) Chukchi_Sea | 866965 | 797144 | 69820 | 839873 | 27092 |
| (3) East_Siberian_Sea | 1045863 | 1050728 | -4865 | 1068901 | -23038 |
| (4) Laptev_Sea | 806824 | 768140 | 38684 | 772185 | 34639 |
| (5) Kara_Sea | 638316 | 715045 | -76730 | 717539 | -79224 |
| (6) Barents_Sea | 114873 | 199057 | -84184 | 138264 | -23391 |
| (7) Greenland_Sea | 811202 | 565292 | 245910 | 524612 | 286589 |
| (8) Baffin_Bay_Gulf_of_St._Lawrence | 849180 | 711581 | 137599 | 667457 | 181723 |
| (9) Canadian_Archipelago | 792429 | 798400 | -5971 | 766642 | 25787 |
| (10) Hudson_Bay | 802506 | 984719 | -182214 | 826781 | -24275 |
| (11) Central_Arctic | 3239185 | 3220413 | 18772 | 3206453 | 32732 |
| (12) Bering_Sea | 9490 | 35600 | -26110 | 21317 | -11827 |
| (13) Baltic_Sea | 0 | 243 | -243 | 0 | 0 |
| (14) Sea_of_Okhotsk | 28074 | 95869 | -67795 | 49697 | -21623 |
Overall, the extent is above average by 160k km2, or 1.5%. The main deficits are in Barents, Kara, Hudson Bay and Okhotsk, more than offset by surpluses especially in Baffin Bay, Greenland and Chukchi seas. Note that Arctic extent will now go below 11 Wadhams heading toward its August minimum. 2010 was nearly 1/2 Wadham below average on day 166.


the problem you could be 100 percent right it wont matter unless the believers hear it on the nws 24/7 that there is no climate emergency then they wont believe anyone else. why? I have no clue.
LikeLike
Reblogged this on Climate Collections.
LikeLike