The previous June Arctic ice update showed that shallow basins on the Pacific side lost their ice rapidly. The animation above shows in the last 15 days how Hudson Bay (bottom right) is nearly all open water. And Baffin Bay (center right) is down to 22% of its March max. The images also show CAA (Canadian Arctic Archipelago–center bottom) is still blocking the Northwest Passage, despite open water in Baffin Bay and in Beaufort Sea to the west. Also the Russian shelf seas (left) are starting to open. This is all normal melting of Arctic drift ice, presently at 56% (8.4 M km2) of last March maximum, heading toward the September minimum.
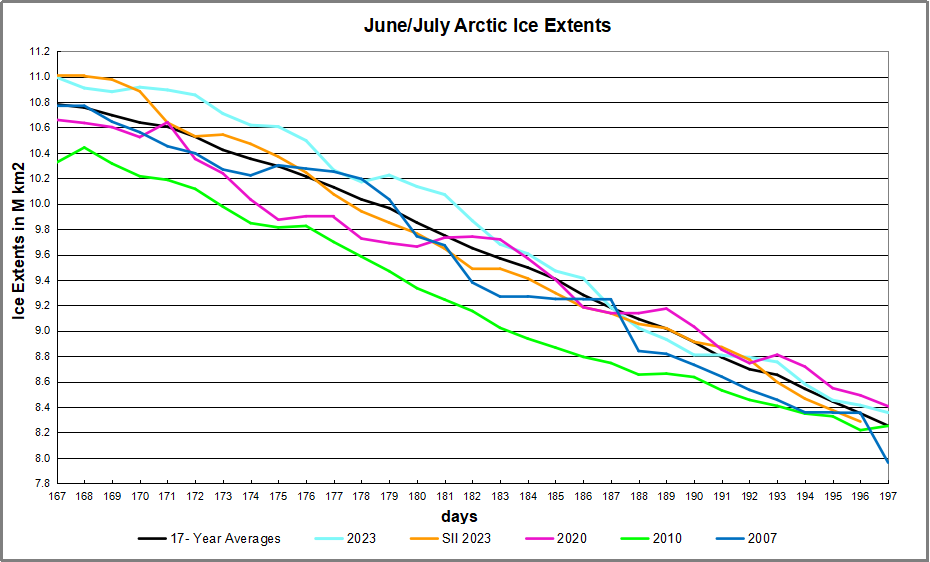
The graph for the last 30 days shows the normal melt is ~2.5M km2 down to 8.3 M km2. 2023 was above average for 3 weeks, and matching average the last week. SII tracked the MASIE average throughout, as did 2007 in June, but dropped lower toward the end.

The table for day 197 shows how the ice extent is distributed across the Arctic regions, incomparison to 17 year average and 2007.
| Region | 2023197 | Day 197 Average | 2023-Ave. | 2007197 | 2023-2007 |
| (0) Northern_Hemisphere | 8356350 | 8252843 | 103507 | 7963047 | 393303 |
| (1) Beaufort_Sea | 843873 | 864156 | -20283 | 825810 | 18063 |
| (2) Chukchi_Sea | 736044 | 627024 | 109019 | 550547 | 185496 |
| (3) East_Siberian_Sea | 891273 | 909597 | -18324 | 729250 | 162022 |
| (4) Laptev_Sea | 632760 | 547279 | 85481 | 525724 | 107036 |
| (5) Kara_Sea | 313437 | 331825 | -18389 | 401874 | -88438 |
| (6) Barents_Sea | 64976 | 54022 | 10954 | 60637 | 4339 |
| (7) Greenland_Sea | 433035 | 394327 | 38708 | 434750 | -1715 |
| (8) Baffin_Bay_Gulf_of_St._Lawrence | 397917 | 292326 | 105591 | 314783 | 83134 |
| (9) Canadian_Archipelago | 649440 | 710624 | -61184 | 711889 | -62449 |
| (10) Hudson_Bay | 165147 | 348600 | -183452 | 183962 | -18814 |
| (11) Central_Arctic | 3227307 | 3169018 | 58289 | 3222022 | 5284 |
The table shows that Hudson Bay is the anomaly, melting out early, but will soon be matched by the average there. CAA is also in slight deficit to average, while surpluses appear in Chukchi, Laptev, Baffin Bay and Central Arctic. 2007 was nearly 400k km2 lower than yesterday.


Reblogged this on Climatism and commented:
“ Fifteen years ago I wrote this article making fun of expert forecasts predicting the imminent demise of Arctic sea ice. Since then there has been no change in average Arctic sea ice extent.
#ClimateScam
https://twitter.com/tonyclimate/status/1680599848301793286?s=46 “
LikeLike