
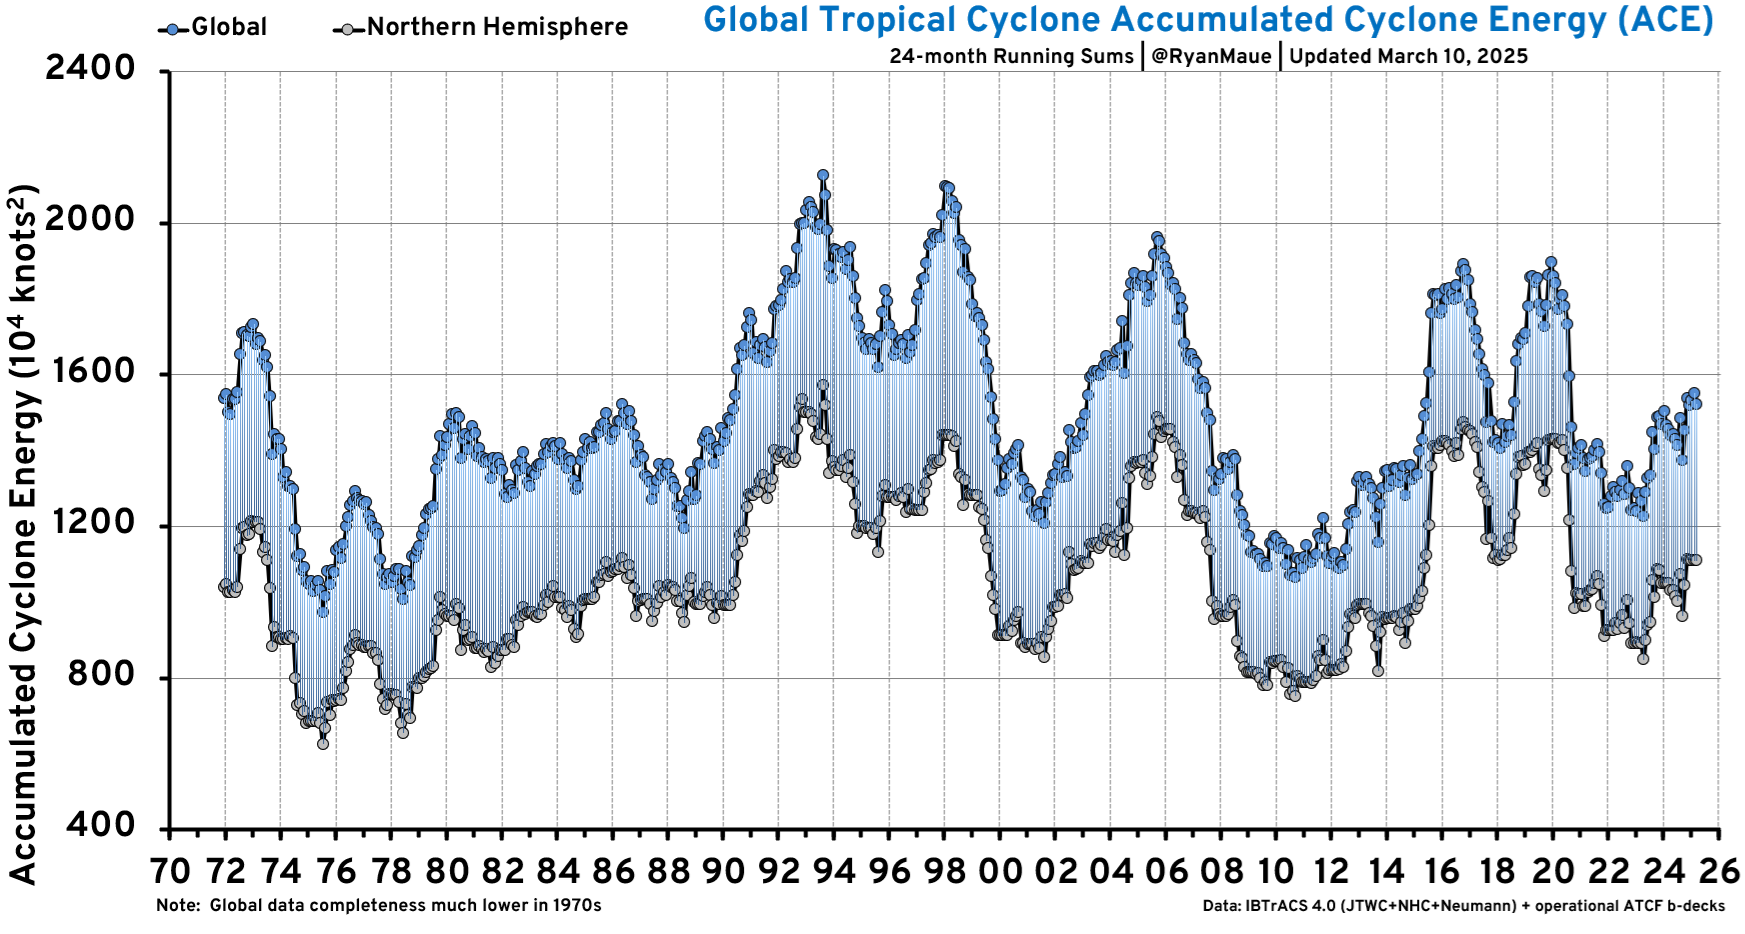
Figure: Last 50-years+ of Global and Northern Hemisphere Accumulated Cyclone Energy: 24 month running sums. Note that the year indicated represents the value of ACE through the previous 24-months for the Northern Hemisphere (bottom line/gray boxes) and the entire global (top line/blue boxes). The area in between represents the Southern Hemisphere total ACE.


Reblogged this on Climate Collections.
LikeLike