
The animation above shows the Arctic sea ice extent on day 212 (end of July) from 2007 to yesterday 2023. Unsurprisingly the distribution varies, most notably there being less open water 2023 along the Russian shelf seas on the left side. OTOH, Hudson Bay in most years still has some ice, but this year not. Overall, Arctic ice this year is in surplus to the 17-year average and to 2007.

The graph above shows the July monthly average ice extent for the last 17 years for both MASIE and SII datasets. Most years SII is slightly lower with the MASIE average at 8.279M km2 and SII at 8.033 (not shown). Note that 2007 was near the lowest in the period and 2023 among the highest.
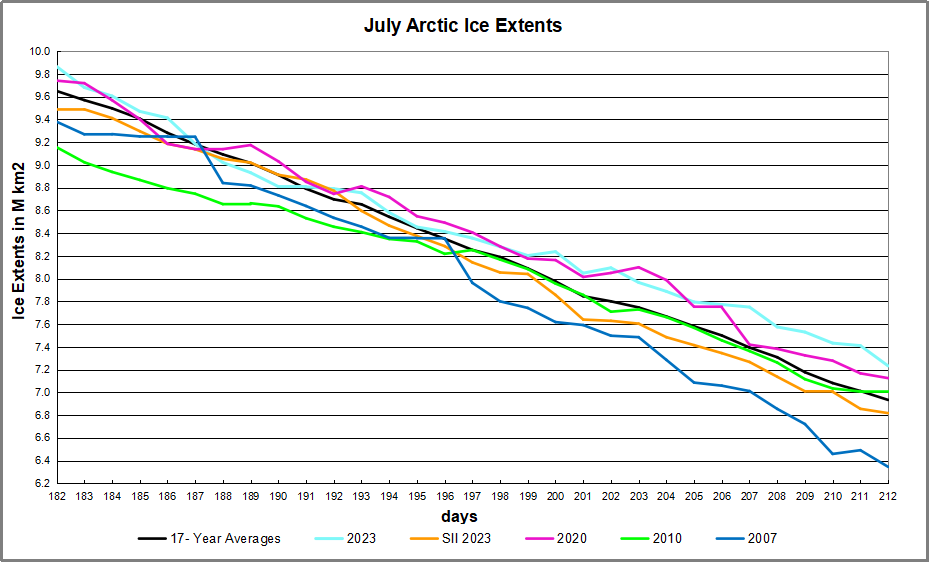
The graph for the last 30 days shows the normal melt is 2.7M km2 down to 6.9M km2. 2023 was tracking average for 2 weeks, and well above average after that. SII tracked the MASIE average throughout, and sllghtly lower the second half. 2007 was average mid-July, but dropped much lower toward the end.

The table for day 212 shows how the ice extent is distributed across the Arctic regions, in comparison to 17 year average and 2007. 2023 was ~300k km2 above average, or 4% of total extent.
| Region | 2023212 | Day 212 Average | 2023-Ave. | 2007212 | 2023-2007 |
| (0) Northern_Hemisphere | 7232358 | 6936889 | 295469 | 6344860 | 887498 |
| (1) Beaufort_Sea | 723443 | 799968 | -76525 | 760576 | -37133 |
| (2) Chukchi_Sea | 659025 | 540756 | 118269 | 382350 | 276675 |
| (3) East_Siberian_Sea | 675190 | 756025 | -80835 | 445385 | 229805 |
| (4) Laptev_Sea | 474071 | 371485 | 102587 | 314382 | 159689 |
| (5) Kara_Sea | 265568 | 161953 | 103615 | 239232 | 26336 |
| (6) Barents_Sea | 54417 | 29804 | 24612 | 23703 | 30714 |
| (7) Greenland_Sea | 328529 | 296824 | 31705 | 324737 | 3792 |
| (8) Baffin_Bay_Gulf_of_St._Lawrence | 243516 | 144525 | 98991 | 94179 | 149337 |
| (9) Canadian_Archipelago | 514780 | 555079 | -40299 | 510063 | 4717 |
| (10) Hudson_Bay | 79485 | 143888 | -64403 | 93655 | -14170 |
| (11) Central_Arctic | 3213192 | 3134907 | 78285 | 3154837 | 58355 |
The table shows earlier than average melting in Beaufort and East Siberian seas and Hudson Bay. Surpluses are everywhere else, especially in Chukchi, Laptev and Kara Seas, as well as Baffin Bay and Central Arctic. 2007 was nearly a full Wadham less than 2023 yesterday.
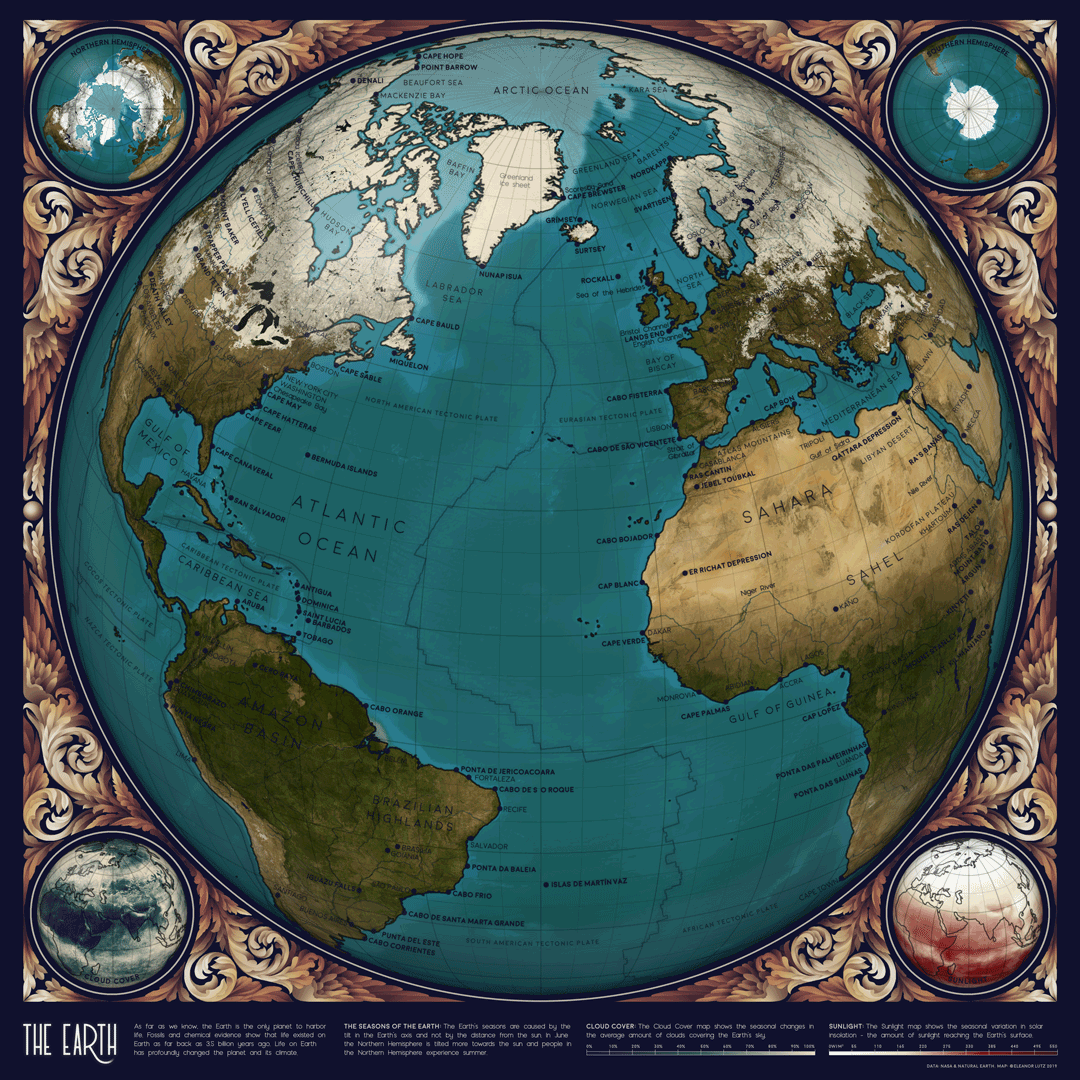
Illustration by Eleanor Lutz shows Earth’s seasonal climate changes. If played in full screen, the four corners present views from top, bottom and sides. It is a visual representation of scientific datasets measuring Arctic ice extents and snow cover.

One comment