The post below updates the UAH record of air temperatures over land and ocean. Each month and year exposed again the growing disconnect between the real world and the Zero Carbon zealots. It is as though the anti-hydrocarbon band wagon hopes to drown out the data contradicting their justification for the Great Energy Transition. Yes, there is warming from an El Nino buildup coincidental with North Atlantic warming, but no basis to blame it on CO2.
As an overview consider how recent rapid cooling completely overcame the warming from the last 3 El Ninos (1998, 2010 and 2016). The UAH record shows that the effects of the last one were gone as of April 2021, again in November 2021, and in February and June 2022 At year end 2022 and continuing into 2023 global temp anomaly matched or went lower than average since 1995, an ENSO neutral year. (UAH baseline is now 1991-2020).

For reference I added an overlay of CO2 annual concentrations as measured at Mauna Loa. While temperatures fluctuated up and down ending flat, CO2 went up steadily by ~60 ppm, a 15% increase.
Furthermore, going back to previous warmings prior to the satellite record shows that the entire rise of 0.8C since 1947 is due to oceanic, not human activity.

The animation is an update of a previous analysis from Dr. Murry Salby. These graphs use Hadcrut4 and include the 2016 El Nino warming event. The exhibit shows since 1947 GMT warmed by 0.8 C, from 13.9 to 14.7, as estimated by Hadcrut4. This resulted from three natural warming events involving ocean cycles. The most recent rise 2013-16 lifted temperatures by 0.2C. Previously the 1997-98 El Nino produced a plateau increase of 0.4C. Before that, a rise from 1977-81 added 0.2C to start the warming since 1947.
Importantly, the theory of human-caused global warming asserts that increasing CO2 in the atmosphere changes the baseline and causes systemic warming in our climate. On the contrary, all of the warming since 1947 was episodic, coming from three brief events associated with oceanic cycles.
Update August 3, 2021
Chris Schoeneveld has produced a similar graph to the animation above, with a temperature series combining HadCRUT4 and UAH6. H/T WUWT


See Also Worst Threat: Greenhouse Gas or Quiet Sun?
July 2023 Update El Nino plus North Atlantic Spikes Hit Summer Highs

With apologies to Paul Revere, this post is on the lookout for cooler weather with an eye on both the Land and the Sea. While you will hear a lot about 2020-21 temperatures matching 2016 as the highest ever, that spin ignores how fast the cooling set in. The UAH data analyzed below shows that warming from the last El Nino had fully dissipated with chilly temperatures in all regions. After a warming blip in 2022, land and ocean temps dropped again with 2023 starting below the mean since 1995. Now in July EL Nino appears in a major Tropical ocean air spike in concert with North Atlantic high temps.
UAH has updated their tlt (temperatures in lower troposphere) dataset for July 2023. Posts on their reading of ocean air temps this month preceded updated records from HadSST4. I last posted on SSTs using HadSST4 North Atlantic Warming June 2023. This month also has a separate graph of land air temps because the comparisons and contrasts are interesting as we contemplate possible cooling in coming months and years. Sometimes air temps over land diverge from ocean air changes. For example in May 2023, ocean temps in all regions moved upward, while Tropical and NH land air temps dropped sharply.
In July, as shown later on, Global ocean air jumpted upward led by rising temps in all regions, led by Tropics and NH. Land air temps augmented this warming also with spikes in all regions. Thus the land + ocean Global UAH temperature is now nearly matching the 2016 peak.
Note: UAH has shifted their baseline from 1981-2010 to 1991-2020 beginning with January 2021. In the charts below, the trends and fluctuations remain the same but the anomaly values change with the baseline reference shift.

Presently sea surface temperatures (SST) are the best available indicator of heat content gained or lost from earth’s climate system. Enthalpy is the thermodynamic term for total heat content in a system, and humidity differences in air parcels affect enthalpy. Measuring water temperature directly avoids distorted impressions from air measurements. In addition, ocean covers 71% of the planet surface and thus dominates surface temperature estimates. Eventually we will likely have reliable means of recording water temperatures at depth.
Recently, Dr. Ole Humlum reported from his research that air temperatures lag 2-3 months behind changes in SST. Thus the cooling oceans now portend cooling land air temperatures to follow. He also observed that changes in CO2 atmospheric concentrations lag behind SST by 11-12 months. This latter point is addressed in a previous post Who to Blame for Rising CO2?
After a change in priorities, updates are now exclusive to HadSST4. For comparison we can also look at lower troposphere temperatures (TLT) from UAHv6 which are now posted for July. The temperature record is derived from microwave sounding units (MSU) on board satellites like the one pictured above. Recently there was a change in UAH processing of satellite drift corrections, including dropping one platform which can no longer be corrected. The graphs below are taken from the revised and current dataset.
The UAH dataset includes temperature results for air above the oceans, and thus should be most comparable to the SSTs. There is the additional feature that ocean air temps avoid Urban Heat Islands (UHI). The graph below shows monthly anomalies for ocean air temps since January 2015.

Note 2020 was warmed mainly by a spike in February in all regions, and secondarily by an October spike in NH alone. In 2021, SH and the Tropics both pulled the Global anomaly down to a new low in April. Then SH and Tropics upward spikes, along with NH warming brought Global temps to a peak in October. That warmth was gone as November 2021 ocean temps plummeted everywhere. After an upward bump 01/2022 temps reversed and plunged downward in June. After an upward spike in July, ocean air everywhere cooled in August and also in September.
After sharp cooling everywhere in January 2023, all regions were into negative territory. Note the Tropics matched the lowest, but since have spiked sharply upward +1.25C, with the largest increases in May, June and July 2023. NH also warmed 0.6C in the last 3 months, while SH ocean air rose 0.5C since February. Global Ocean air July 2023 is second only to 2016, which had Feb./March peaks followed by cooling. The strength of the El Nino will determine the latter half of this year.
Land Air Temperatures Tracking Downward in Seesaw Pattern
We sometimes overlook that in climate temperature records, while the oceans are measured directly with SSTs, land temps are measured only indirectly. The land temperature records at surface stations sample air temps at 2 meters above ground. UAH gives tlt anomalies for air over land separately from ocean air temps. The graph updated for June is below.
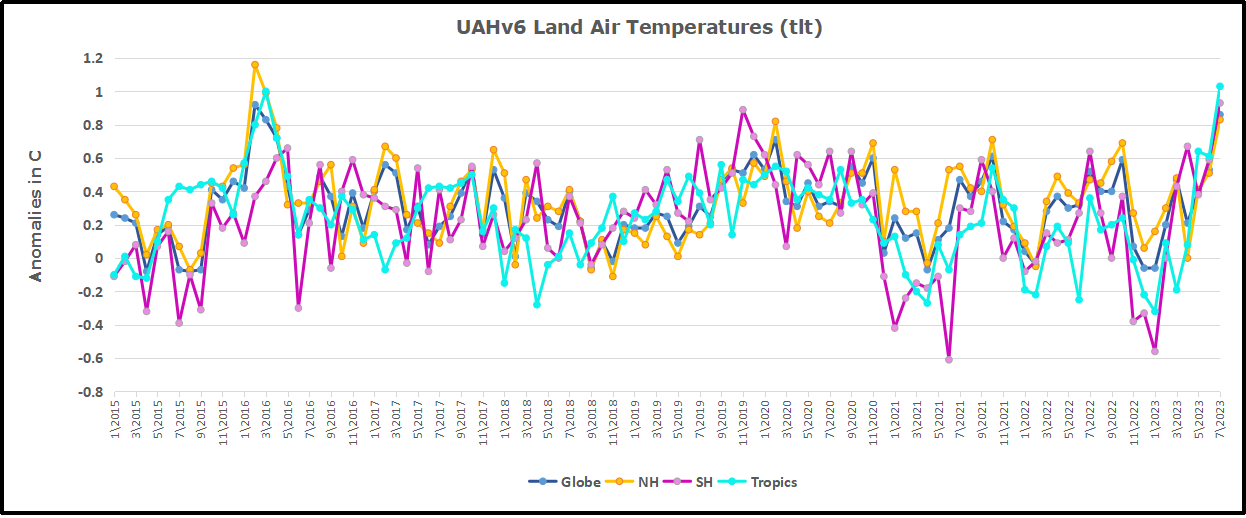
Here we have fresh evidence of the greater volatility of the Land temperatures, along with extraordinary departures by SH land. Land temps are dominated by NH with a 2021 spike in January, then dropping before rising in the summer to peak in October 2021. As with the ocean air temps, all that was erased in November with a sharp cooling everywhere. After a summer 2022 NH spike, land temps dropped everywhere, and in January, further cooling in SH and Tropics offset by an uptick in NH.
Remarkably, in 2023, SH land air anomaly shot up 1.5C, from -0.56C in January to +0.93 in July. Tropical land temps are up 1.25 since January and NH Land air temps rose 0.7. The consolidated rise resembles the upward spikes starting in September 2015.
The Bigger Picture UAH Global Since 1980
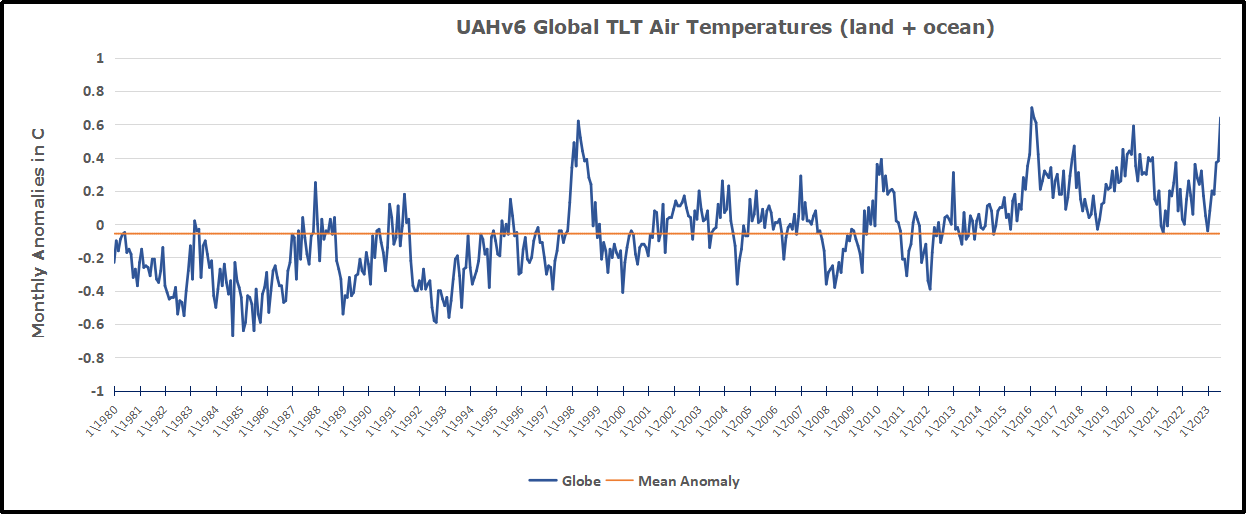
The chart shows monthly Global anomalies starting 01/1980 to present. The average monthly anomaly is -0.06, for this period of more than four decades. The graph shows the 1998 El Nino after which the mean resumed, and again after the smaller 2010 event. The 2016 El Nino matched 1998 peak and in addition NH after effects lasted longer, followed by the NH warming 2019-20. An upward bump in 2021 was reversed with temps having returned close to the mean as of 2/2022. March and April brought warmer Global temps, later reversed.
With the sharp drops in Nov., Dec. and January 2023 temps, there was no increase over 1980. Now in 2023 the buildup to the July peak resembles closely the sharp July peak of the El Nino 1998 event. It is second only to the March peak in 2016. Where it goes from here, up or down, remains to be seen.
TLTs include mixing above the oceans and probably some influence from nearby more volatile land temps. Clearly NH and Global land temps have been dropping in a seesaw pattern, nearly 1C lower than the 2016 peak. Since the ocean has 1000 times the heat capacity as the atmosphere, that cooling is a significant driving force. TLT measures started the recent cooling later than SSTs from HadSST3, but are now showing the same pattern. Despite the three El Ninos, their warming has not persisted prior to 2023, and without them it would probably have cooled since 1995. Of course, the future has not yet been written.

Ron
Hunga Tonga anyone? A large lump of the Pacific ocean plus a lot of surprised fish in the stratosphere, where its not normally supposed to be, may have had an effect, even NASA said so. Just sayin’
https://climatechangedispatch.com/nasa-tonga-eruption-enough-to-temporarily-raise-earths-global-temperature/
LikeLike
Brian, I posted on that factor, though there is the question of why the ocean warming now a year and a half later. Eschenbach has a skeptical post on Hunga Tonga at WUWT.
I suggested there may also be some thermal action on the North Atlantic volcanic ridge as a warming factor.
LikeLike
Yes it is a bit late. I simply believed NASA, which is usually an error, but is it this time? Is the water still up in the Statosphere, or has the sky fallen?
nB The submarine volcano contribution is much larger than the geological consensus keep repeating and IPCC say is zero, it certainly is not, I suggest the available dat woulconservativelt put it at 140km^3 pa, which is c. 5.,5×10^20 Joules pa heat entering the ocean ON AVERAGE. Less now, most observed at peak 100Ka events, most as plume and blob at the surface, convective adiabatic pluming to the sea/air interface and its hugely variable within the 100Ka eccentricity cycle, by a factor of perhaps 10 or more, the other Milankovitch cycles also feature peak eruption rates at at peak gravitational stress effects, well seen in the stratification of the Pacific rim seen in bore holes. As I have worked on, but not finished here in pre pub. I need to separate the book from the core data and just publish the data as a paper, updating the quantity and variability of ocean heating by magma.
http://dx.doi.org/10.2139/ssrn.3259379
Any such activity needs to be needs to be massive to add much heat to the surface, and levels of planetary twerking of the viscous planet are not that significant at present.
In haste…..
PS Willis is good at graphical presentation to validate the claims of charlatans with data, not so much the complex physical science of cause and effect at scale that has been measured. Doesn’t like things that disagree with his preconceptions.
LikeLike
Brian, Judah Cohen made a reasonable statement at his AER blog:
“I feel like I have been highlighting all summer long this strange atmospheric feature that suggests stratosphere-troposphere coupling where warm/positive polar cap geopotential height anomalies (PCHs) seems to be propagating down from the stratosphere to the surface and forcing a negative AO. This coupling persists (see Figure 11) and once again is supporting a negative AO/NAO and Greenland blocking well into August. In Figure i, I post the NAO the observed and predicted NAO index from NOAA’s Climate Prediction Center and the NAO has been almost continuously negative since the start of summer. It is my experience that is very rare and showing my bias here but would love to see that repeated in winter!
High latitude blocking seems to be a more common summer feature of late, but it does seem to me that the high latitude blocking is stronger this summer than other recent summers. Of course, there is still plenty of summer left but looking ahead to the transition to fall, if the strong high latitude blocking continues well into the fall months this could have important implications on the developing polar vortex, but I digress and/or get ahead of myself.
From social media and the news certainly seems that there have been many superlatives in the weather from record high sea surface temperatures, record high land temperatures, heavy rainfalls, the lethargic growth of Antarctic sea ice and extensive Greenland ice melt. I just came across this nice story from the The Weather Channel on some of the record heat in the US this summer. Why has the globe seemed to turn the heat dial to 11 this summer, is an interesting question and I certainly don’t have the answer. At least some intuitive contributors are the developing El Niño and the Hunga Tonga volcanic eruption at the beginning of 2022. Unlike other explosive volcanoes it was sulfur poor but water vapor rich since it was an underwater volcano as discussed in this EOS article.
But despite the seemingly exceptional weather this summer across the Northern Hemisphere (NH), I think the overall pattern of surface temperature anomalies is consistent with recent summers and with summer forecasts from this past spring (the summer forecast was included in the 22 May 2023 blog post).
https://www.aer.com/science-research/climate-weather/arctic-oscillation/
LikeLike
One more pertinent information. In an exchange wtih Ulric Lyons I posted this:
“No significant ENSO-driven atmospheric anomalies can be observed over the North Atlantic when ENSO and the AMO are out of phase (AMO−/El Niño and AMO+/La Niña). Further analysis indicates that the sea surface temperature anomaly (SSTA) in the tropical North Atlantic (TNA) plays an essential role in this modulating effect. Because of broadly analogous TNA SSTA responses to both ENSO and the AMO during late winter, a warm SSTA in the TNA is evident when El Niño occurs during a positive AMO phase, resulting in a significantly weakened NAO, and vice versa when La Niña occurs during a negative AMO phase. In contrast, neither the TNA SSTA nor the NAO shows a prominent change under out-of-phase combinations of ENSO and AMO. ”
https://journals.ametsoc.org/view/journals/clim/32/1/jcli-d-18-0365.1.xml
LikeLike