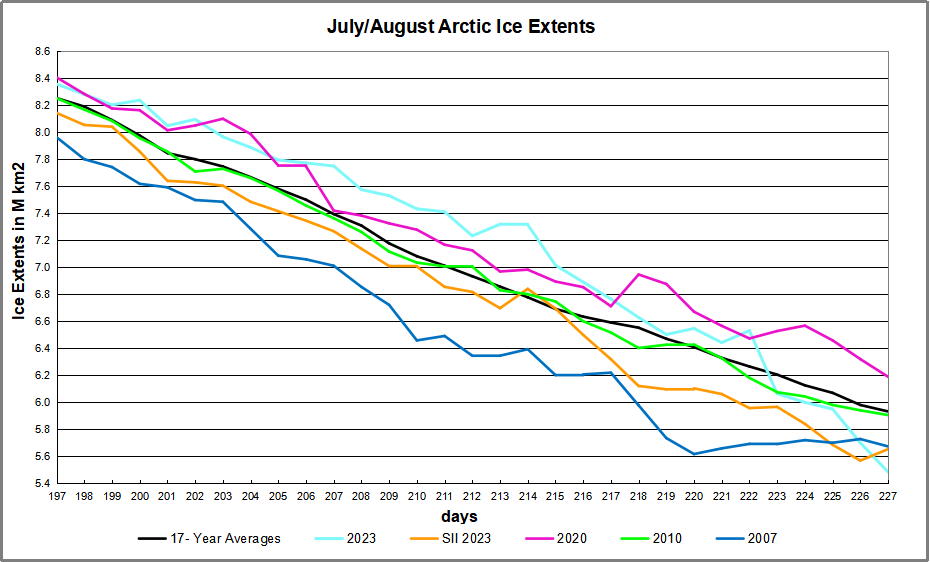
An incredible turn of events in Arctic Ice extent reporting in the last five days. As the chart above shows, it is not unusual in August to have sharp downturns in ice extents. However, the 2023 drop is unprecedented and looks suspiciously like an adjustment to bring MASIE in line with SII. Note that for 25 days, MASIE showed much more ice than SII, ranging as much as +622k km2 on August 1 and +572k km2 on day 222. Moreover, those two days were in surplus to MASIE 17 year average: +460k km2, and + 265k km2 respectively.
Then on day 223 MASIE dropped 466k km2, unprecendented for a single day. And further declines resulted a five day total loss exceeding 1 Wadham, 1.05M km2. In just five days, a surplus of +265k turned into a deficit of -448k. And MASIE is now 170k lower than SII.
I have asked for an explanation and am awaiting a reply from NSIDC.

The table for day 227 shows a distribution of ice extent across the Arctic regions, in comparison to 17 year average and 2007. 2023 was 448k km2 below average, or 8% of total extent.
| Region | 2023227 | Day 227 Average | 2023-Ave. | 2007227 | 2023-2007 |
| (0) Northern_Hemisphere | 5483921 | 5932184 | -448263 | 5673110 | -189189 |
| (1) Beaufort_Sea | 508614 | 724117 | -215503 | 770413 | -261799 |
| (2) Chukchi_Sea | 477947 | 429182 | 48765 | 260048 | 217899 |
| (3) East_Siberian_Sea | 336549 | 569134 | -232585 | 172718 | 163831 |
| (4) Laptev_Sea | 327171 | 238108 | 89064 | 292592 | 34579 |
| (5) Kara_Sea | 149411 | 95286 | 54126 | 201115 | -51703 |
| (6) Barents_Sea | 10737 | 24019 | -13282 | 17324 | -6587 |
| (7) Greenland_Sea | 221710 | 229025 | -7315 | 316155 | -94445 |
| (8) Baffin_Bay_Gulf_of_St._Lawrence | 50784 | 58004 | -7220 | 86165 | -35380 |
| (9) Canadian_Archipelago | 289715 | 418748 | -129033 | 375984 | -86268 |
| (10) Hudson_Bay | 44528 | 67445 | -22917 | 91653 | -47125 |
| (11) Central_Arctic | 3066518 | 3077985 | -11466 | 3087687 | -21168 |
The table shows the bulk of the deficit appears in Beaufort and East Siberian seas and CAA, with smaller surpluses in Chukchi, Laptev and Kara seas.
Illustration by Eleanor Lutz shows Earth’s seasonal climate changes. If played in full screen, the four corners present views from top, bottom and sides. It is a visual representation of scientific datasets measuring Arctic ice extents and snow cover.
