Barrier Reef Great Again

Last night I watched an extraordinary netflix documentary which took us on a journey discovering the rich variety of reef life, including microscopic creatures not shown in videos before. It was highly educational and thoroughly delightful . . . until suddenly it wasn’t.  Spoiler Alert:  Puff returns as an adult to the reef where he was born after leaving it to mature in a mangrove marsh.  Alas, he finds the coral dead and blackened, and the narrator warns us:  Warming oceans kiiled the reef and we must change the way we live for the sake of Puff and the other reef creatures.  There may have been more to the fire and brimstone ending, but I was so turned off that I turned it off.

Why must nature documentaries resort to doomsday guilt trips to destroy any good feelings about our world?  Chris Morrison provides the antidote in his Daily Sceptic article Coral at the Great Barrier Reef Holds on to Recent Record Gains, Defying All Doomsday Predictions.  Excerpts in italics with my bolds.

Coral at the Great Barrier Reef (GBR) faces another year of exile from the climate scare headlines with news that the record levels reported in 2021-22 have been sustained in the latest annual period to May 2023. A small drop in the three main areas of the reef was well within margin of error territory, with the Australian Institute of Marine Science (AIMS) reporting that regional average hard coral cover in 2022-2023 was similar to last year at 35.7%. Most reefs underwent little change during the year.

Coral at the reef has been bouncing back sharply for a number of years, with a record 36-year high reported in 2022. But the news of this spectacular recovery has been largely ignored in most media since it had previously been a go-to poster scare story for collectivist Net Zero promoters. But connecting the fate of tropical corals to global warming was always a difficult ask since they grow in waters between 24-32°C. Short boosts in local temperatures can cause temporary bleaching, but it is scientifically impossible to pin it on human-caused climate change, although pseudoscientific ‘attribution’ computer models try very hard.

In the latest year, there was a short local temperature rise,
but little bleaching was reported during the 2023 summer.

No cyclones hit the reef and crown-of thorns starfish attacks were limited. Nevertheless, natural stresses will always affect the eco-system and AIMS states that these paused the growth of hard coral on some of the reefs.

Like most state-funded scientific bodies, The Australian Institute of Marine Science (AIMS) is fully signed up to climate extremism and delivering politically correct messages to promote the Net Zero solution. Despite reporting what is now a substantial multi-year recovery, it notes that the future is predicted to bring more frequent, intense and enduring marine heatwaves, alongside the persistent threat of crown-of thorns starfish outbreaks and tropical cyclones. More frequent mass coral bleaching is a sign that the GBR is experiencing the consequences of climate change, it claims. However, in a different part of its latest report, AIMS accepts that the recent substantial recovery occurred despite two mass coral bleaching events in 2020 and 2022.

There is an acceptance that this underlines that “widespread coral bleaching
does not necessarily lead to extensive coral mortality”.

But pockets of extremist catastrophism remain in the mainstream media, notably in the Guardian, fighting to keep the coral destruction story going. A year ago, the newspaper reported that the GBR still had “some capacity” for recovery, but the window was closing fast as the climate continued to warm. Of course the Guardian has form as long as your arm on this score. Back in 1999, George Monbiot told its readers that the “imminent total destruction of the world’s coral reefs is not a scare story but a fact”.

Coral reefs have been around in one form or another for hundreds of millions of years. Current global temperatures are towards the lower end of the paleoclimatic record. One might wonder how corals manage to survive temperatures up to 10°C higher in the past?

Back in the real world, we can see how the recent solid recovery
was sustained across the three main areas of the GBR.

The recovery in the northern GBR actually started around 2017. Last year the coral declined slightly from 36.5% to 35.7%, and was easily within the margin of error calculated by the AIMS. Typhoon Tiffany passed through at the end of the previous reporting season, and could have been responsible for some loss.

In the centre of the reef, the strong recovery of hard coral cover to 32.6% last year eased slightly, but again, as the AIMS noted, it was within the margin of error.

The southern end of the GBR has generally had higher coral cover than elsewhere, but has shown greater variability over the observed record. Last year’s cover was 33.8%, compared with 33.9% the year before. Some coral was reported to have been lost due to starfish predations.

The GBR is the largest reef system on Earth and runs for
over 1,400 miles down the eastern side of Australia.

It is also the most surveyed reef in the world and the results of scientific endeavour are widely distributed. While this work is often politicised, it is clear that recent evidence shows that temporary spikes in temperature, which occur naturally in the oceans, can cause bleaching. However, this bleaching process can rapidly go into reverse when local conditions stabilise. These findings have been confirmed elsewhere, notably in the remote Palmyra Atoll, 1,200 kms south of Hawaii. A 10-year survey recently observed sudden changes in temperature up to 3°C on two occasions, leading to substantial damage to the coral. A 2015-16 spike led to 90% of the coral bleaching, but the researchers found that within a year only 10% of the coral had died. Within two years, the corals had returned to pre-bleached levels.

The researchers concluded that the coral structures
“show evidence of long-term stability”
– but don’t expect to see that on the front page.

Palmyra Atoll, 1,200 kms south of Hawaii.

UAH: El Nino Rescues Global Warming July 2023

The post below updates the UAH record of air temperatures over land and ocean. Each month and year exposed again the growing disconnect between the real world and the Zero Carbon zealots.  It is as though the anti-hydrocarbon band wagon hopes to drown out the data contradicting their justification for the Great Energy Transition.  Yes, there is warming from an El Nino buildup coincidental with North Atlantic warming, but no basis to blame it on CO2.  

As an overview consider how recent rapid cooling  completely overcame the warming from the last 3 El Ninos (1998, 2010 and 2016).  The UAH record shows that the effects of the last one were gone as of April 2021, again in November 2021, and in February and June 2022  At year end 2022 and continuing into 2023 global temp anomaly matched or went lower than average since 1995, an ENSO neutral year. (UAH baseline is now 1991-2020).

For reference I added an overlay of CO2 annual concentrations as measured at Mauna Loa.  While temperatures fluctuated up and down ending flat, CO2 went up steadily by ~60 ppm, a 15% increase.

Furthermore, going back to previous warmings prior to the satellite record shows that the entire rise of 0.8C since 1947 is due to oceanic, not human activity.

gmt-warming-events

The animation is an update of a previous analysis from Dr. Murry Salby.  These graphs use Hadcrut4 and include the 2016 El Nino warming event.  The exhibit shows since 1947 GMT warmed by 0.8 C, from 13.9 to 14.7, as estimated by Hadcrut4.  This resulted from three natural warming events involving ocean cycles. The most recent rise 2013-16 lifted temperatures by 0.2C.  Previously the 1997-98 El Nino produced a plateau increase of 0.4C.  Before that, a rise from 1977-81 added 0.2C to start the warming since 1947.

Importantly, the theory of human-caused global warming asserts that increasing CO2 in the atmosphere changes the baseline and causes systemic warming in our climate.  On the contrary, all of the warming since 1947 was episodic, coming from three brief events associated with oceanic cycles. 

Update August 3, 2021

Chris Schoeneveld has produced a similar graph to the animation above, with a temperature series combining HadCRUT4 and UAH6. H/T WUWT

image-8


mc_wh_gas_web20210423124932

See Also Worst Threat: Greenhouse Gas or Quiet Sun?

July 2023 Update El Nino plus North Atlantic Spikes Hit Summer Highs

banner-blog

With apologies to Paul Revere, this post is on the lookout for cooler weather with an eye on both the Land and the Sea.  While you will hear a lot about 2020-21 temperatures matching 2016 as the highest ever, that spin ignores how fast the cooling set in.  The UAH data analyzed below shows that warming from the last El Nino had fully dissipated with chilly temperatures in all regions. After a warming blip in 2022, land and ocean temps dropped again with 2023 starting below the mean since 1995.  Now in July EL Nino appears in a major Tropical ocean air spike in concert with North Atlantic high temps.

UAH has updated their tlt (temperatures in lower troposphere) dataset for July 2023. Posts on their reading of ocean air temps this month preceded updated records from HadSST4.  I last posted on SSTs using HadSST4 North Atlantic Warming June 2023. This month also has a separate graph of land air temps because the comparisons and contrasts are interesting as we contemplate possible cooling in coming months and years. Sometimes air temps over land diverge from ocean air changes.  For example in May 2023, ocean temps in all regions moved upward, while Tropical and NH land air temps dropped sharply. 

In July, as shown later on, Global ocean air jumpted upward led by rising temps in all regions, led by Tropics and NH.  Land air temps augmented this warming also with spikes in all regions.  Thus the land + ocean Global UAH temperature is now nearly matching the 2016 peak.

Note:  UAH has shifted their baseline from 1981-2010 to 1991-2020 beginning with January 2021.  In the charts below, the trends and fluctuations remain the same but the anomaly values change with the baseline reference shift.

Presently sea surface temperatures (SST) are the best available indicator of heat content gained or lost from earth’s climate system.  Enthalpy is the thermodynamic term for total heat content in a system, and humidity differences in air parcels affect enthalpy.  Measuring water temperature directly avoids distorted impressions from air measurements.  In addition, ocean covers 71% of the planet surface and thus dominates surface temperature estimates.  Eventually we will likely have reliable means of recording water temperatures at depth.

Recently, Dr. Ole Humlum reported from his research that air temperatures lag 2-3 months behind changes in SST.  Thus the cooling oceans now portend cooling land air temperatures to follow.  He also observed that changes in CO2 atmospheric concentrations lag behind SST by 11-12 months.  This latter point is addressed in a previous post Who to Blame for Rising CO2?

After a change in priorities, updates are now exclusive to HadSST4.  For comparison we can also look at lower troposphere temperatures (TLT) from UAHv6 which are now posted for July.  The temperature record is derived from microwave sounding units (MSU) on board satellites like the one pictured above. Recently there was a change in UAH processing of satellite drift corrections, including dropping one platform which can no longer be corrected. The graphs below are taken from the revised and current dataset.

The UAH dataset includes temperature results for air above the oceans, and thus should be most comparable to the SSTs. There is the additional feature that ocean air temps avoid Urban Heat Islands (UHI).  The graph below shows monthly anomalies for ocean air temps since January 2015.

Note 2020 was warmed mainly by a spike in February in all regions, and secondarily by an October spike in NH alone. In 2021, SH and the Tropics both pulled the Global anomaly down to a new low in April. Then SH and Tropics upward spikes, along with NH warming brought Global temps to a peak in October.  That warmth was gone as November 2021 ocean temps plummeted everywhere. After an upward bump 01/2022 temps reversed and plunged downward in June.  After an upward spike in July, ocean air everywhere cooled in August and also in September.   

After sharp cooling everywhere in January 2023, all regions were into negative territory. Note the Tropics matched the lowest, but since  have spiked sharply upward +1.25C, with the largest increases in May, June and July 2023.  NH also warmed 0.6C in the last 3 months, while SH ocean air rose 0.5C since February. Global Ocean air July 2023 is second only to 2016, which had Feb./March peaks followed by cooling.  The strength of the El Nino will determine the latter half of this year.

Land Air Temperatures Tracking Downward in Seesaw Pattern

We sometimes overlook that in climate temperature records, while the oceans are measured directly with SSTs, land temps are measured only indirectly.  The land temperature records at surface stations sample air temps at 2 meters above ground.  UAH gives tlt anomalies for air over land separately from ocean air temps.  The graph updated for June is below.

Here we have fresh evidence of the greater volatility of the Land temperatures, along with extraordinary departures by SH land.  Land temps are dominated by NH with a 2021 spike in January,  then dropping before rising in the summer to peak in October 2021. As with the ocean air temps, all that was erased in November with a sharp cooling everywhere.  After a summer 2022 NH spike, land temps dropped everywhere, and in January, further cooling in SH and Tropics offset by an uptick in NH. 

Remarkably, in 2023, SH land air anomaly shot up 1.5C, from  -0.56C in January to +0.93 in July.  Tropical land temps are up 1.25 since January and NH Land air temps rose 0.7.   The consolidated rise resembles the upward spikes starting in September 2015.

The Bigger Picture UAH Global Since 1980

The chart shows monthly Global anomalies starting 01/1980 to present.  The average monthly anomaly is -0.06, for this period of more than four decades.  The graph shows the 1998 El Nino after which the mean resumed, and again after the smaller 2010 event. The 2016 El Nino matched 1998 peak and in addition NH after effects lasted longer, followed by the NH warming 2019-20.   An upward bump in 2021 was reversed with temps having returned close to the mean as of 2/2022.  March and April brought warmer Global temps, later reversed.

With the sharp drops in Nov., Dec. and January 2023 temps, there was no increase over 1980. Now in 2023 the buildup to the July peak resembles closely the sharp July peak of the El Nino 1998 event. It is second only to the March peak in 2016.  Where it goes from here, up or down, remains to be seen.

TLTs include mixing above the oceans and probably some influence from nearby more volatile land temps.  Clearly NH and Global land temps have been dropping in a seesaw pattern, nearly 1C lower than the 2016 peak.  Since the ocean has 1000 times the heat capacity as the atmosphere, that cooling is a significant driving force.  TLT measures started the recent cooling later than SSTs from HadSST3, but are now showing the same pattern. Despite the three El Ninos, their warming has not persisted prior to 2023, and without them it would probably have cooled since 1995.  Of course, the future has not yet been written.


UN’s Guterres: Head in Oven, Feet in Freezer

The image is based on a criticism of statisticians:  “If my head is in the oven and my feet are in the freezer, my temperature may be on average normal.”  UN Chief Guterres presumes to speak for the planet when he claims we are experiencing “Global Boiling.”  Apparently, his feet are too numb to register any of the many cold temperatures in places around the world, so he is a victim fearing a runaway average warming.  Let’s inform him and others similarly misled about the facts on the ground they are missing.

Australia

Why Is It So Cold Right Now? A Weather Expert Explains

Temperatures plummeted across southeast Australia this week, with Weatherzone reporting Canberra’s low of -7.2ºC was “its lowest temperature since 2018 and the lowest for June since 1986.”

Sydney experienced its coldest June morning today since 2010, with a temperature of 5.2ºC. In Victoria, temperatures of -7.2ºC were recorded.

Australia just had one of its coolest and wettest summers of the last decade. 

Snow settled on the Stirling Range in WA on Thursday morning after a frigid polar air mass travelled from Antarctica to Australia.

A long fetch of southerly winds has been blowing across the Southern Ocean during the past week, carrying polar air from the ice sheets of Antarctica into unusually low latitudes.

On Thursday morning, this Antarctic air mass reached the Stirling Range in WA and caused snow to settle on Bluff Knoll.

United Kingdom

Met Office explains why the weather is so miserable this May

‘High-pressure systems have been generally located over southern continental Europe and also to the far east of Europe’, they told Metro.co.uk.

The spokesperson continued: ‘As these high-pressure systems interacted through the season, the UK is positioned between them, leading to periods of cool, cloudy, and wet conditions for the UK.  ‘These have generally either swept in from the Atlantic or slipped between the high-pressure systems to reach the UK.

‘Warmer-than-average sea temperatures also provided the necessary fuel for clouds to develop, which has been quite persistent in spring.’

Met Office meteorologist Clare Nasir said: ‘Showers over the next few days could be heavy with the risk of thunder and hail.’   She added that the risk of thunder and hail persist through Wednesday and Thursday.

Where has the UK summer gone

Summer 2023 so far has been one of contrasts – after the warmest June on record we had an exceptionally wet July.  Northern Ireland and much of north-west England had their wettest July on record. Looking ahead there is no immediate end to the distinctly un-summery conditions. So what is going on?

Any spring warmth was hard to come by. After a cool April, very warm weather was distinctly lacking in May. Nowhere reached 24°C until the month was nearly over, on the 27th.

However, that theme changed dramatically in June. Temperatures soared to 32.2°C, with a heatwave being declared in many places and becoming the warmest June on record which, according to the Met Office, bears the “fingerprint of climate change”.

It was all change again in early July with low pressure setting in, and staying put. While much of Europe sweltered in a blistering heatwave the UK sat under cool, wet weather which looks set to stay for the first part of August too.

India

Is January 2023 going to be the coldest year in the 21st century?

There may be no relief from the ongoing spell of cold wave with minimum temperatures hovering below normal limits at most places, reports suggested. If a weather expert is believed, it has been predicted that temperatures in the plains are going to dip as far as -4 degrees Celsius next week.

Large parts of north India are still reeling under numbing cold with the mercury remaining below freezing point at most places in Jammu and Kashmir, while dense fog in the early hours of the morning hit road and rail traffic movement. Cold wave conditions abated in Delhi due to a fresh western disturbance affecting northwest India, even as a dense layer of fog lowered visibility to just 50 metres.

Northern India braces for coldest weather in years as dense fog, poor air quality linger

A new wave of cold weather is headed into northern India and could drop temperatures to levels not seen there in over three years, according to AccuWeather forecasters.

The cold weather shot will be the latest, and perhaps most significant, of many recent waves of chilly weather that have also led to travel-disrupting dense fog and poor air quality over parts of the Indian subcontinent since late December.

The temperature in New Delhi, the capital city of India and home to more than 18 million people, has the potential to drop as low as 2 degrees Celsius (35 degrees Fahrenheit) on Sunday night and Monday morning. While the record low for this coming Monday of 1.3 degrees Celsius below zero (29.7 degrees Fahrenheit) appears safe, it will be well below the average low of 6 degrees Celsius (42 degrees Fahrenheit) for the date.

Temperatures at this level would be the coldest readings in New Delhi since December 2019,” said Nicholls.

Ahead of the cold wave, the IMD has issued a cold wave warning for Sunday and Monday for the northern Indian states of Punjab, Haryana, Chandigarh, Delhi and Rajasthan. The warning was issued to give residents advance notice of a level of cold that could adversely impact human health and property.

Canada

Spring forecast 2023: The La Nina Winter pattern is forecast to extend as we head into Spring despite the breakdown of the cold ocean anomalies

Spring season 2023 is nearing, with forecasts revealing the jet stream pattern over the North Pacific and the Atlantic to be influenced by the diminishing La Nina. A high-pressure system in the Pacific will define the weather patterns over North America, with a potential Stratospheric warming event playing a role early in the season.

The cold ocean phase in the equatorial Pacific is already in breakdown mode. It is expected to decline rapidly towards early Spring.

But, despite the breakdown of these cold ocean anomalies (La Nina), its influence can still persist in global weather circulation. Long-range weather calculations also see this, extending the La Nina jet stream pattern from Winter into Spring 2023.

Spring sits on the sidelines with Winter’s wild ride to the finish line

USA

Winter Forecast 2024: The Brrr Is Back

The Brrr is Back!
“After a weird and warm winter season last year, this winter should make cold weather fans rejoice—especially those in the Great Lakes, Midwest, and northern New England areas,” shares editor Pete Geiger, adding “the ‘brrr’ is coming back! We expect more snow and low temperatures nationwide.”

East Coast Snow?
Folks living along the I-95 corridor from Washington to Boston, who saw a lack of wintry precipitation last winter, should experience quite the opposite, with lots of rain/sleet and snowstorms to contend with.

Texans Beware!
According to Farmers’ Almanac 2024, Texans should prepare for an unseasonably cold and stormy winter season ahead

Frosts in Florida?
Winter will be wet in the Southeast region however a few frosts are forecast to bring the “brrrs” to Floridians and its snowbirds.

Asia

As Asian countries hit by extreme cold snap, here’s what life is like at -53C

An intense cold spell is gripping east Asia, with temperatures plunging and hazardous conditions reported across China, the Koreas and Japan.

On Monday one of China’s northern-most cities broke its lowest ever recorded temperature, with the mercury hitting -53C at 7am on the first day of the Lunar New Year in Mohe, Heilongjiang province.

Japan and the Korean peninsula have also issued warnings over freezing temperatures and gales that have killed at least one person, while at least 57 people have been reported dead in Afghanistan as the wintry conditions stretch across into central Asia.

Europe

Record-Challenging Cold Sweeps Europe

It’s been cold — ask a European, ask me…

We’ve enjoyed a ‘comfortably cool’ July here in Central Portugal (thus far), it’s been great. Same with my old haunt, the UK. July 2023 there is on course to be colder-than-average–and vs the historically cool 1961-1990 era that the Met Office still insist on using, no less.

Looking ahead, and particularly at central/eastern nations, those summer chills are about to take another step down.

As per the latest GFS run (shown below), ‘pinks’ and ‘purples’ are forecast to engulf the likes of Poland, Slovakia, Hungary, Croatia, Serbia, Albania, Belarus, Ukraine and Romania this week, sending temperatures crashing by as much as 18C below the seasonal norm.

Record summer lows are expected, an unbiased media would report on them (not holding my breath).

Russia

Extreme cold grips Siberia, as temperatures fall to lowest levels since 2002

The coldest air on Earth plunged into Siberia this week, dropping temperatures to as low as 80 degrees Fahrenheit below zero. An expansion of that cold is expected across eastern Asia into early next week and eventually North America, according to AccuWeather forecasters.

The bitter cold not only allowed temperature benchmarks that have not been hit in decades in some parts of Russia, but the extreme weather also created an icy spectacle as firefighters battled a fire in subzero temperatures on Jan. 8 in Ufa, Russia. Massive icicles clung to the home amid the anomalous cold.

The same Arctic blast dropped temperatures in Moscow to their lowest levels in years this past weekend, while even parts of northern India will get a taste of the cold beginning later this weekend.

Antarctica

Antarctica Plunges to -83.2C (-117.8F)–Earth’s Lowest Temperature Since 2017

While the media tricks the dumb and the gullible into believing the world is on fire –with poverty-inducing CO2 reductions their only savior– Antarctica is shivering through an extreme bout of cold, even by South Pole standards.

The Italian-French research station ‘Concordia’ posted a reading of -83.2C (-117.8F) on July 25. This ranks as the fifth coldest daily value in the operational life of the station, bested only by Aug 2010’s -84.7C; July 2010’s -84.6C; and June 2017’s -83.9C and -83.5C.

As discussed recently, Antarctic sea ice’s tough time of it in 2023 isn’t related to temperature, that correlation simply doesn’t exist. The Antarctic continent continues to cool, the data are very clear on that, yet ice is taking a proverbial beating this season.

South America

Fierce frosts have gripped areas of Argentina and Chile

Some of that aforementioned Antarctic cold has been spun northward over Southern Hemisphere land masses.

Fierce frosts have gripped areas of Argentina and Chile of late, as South America’s topsy–turvy ‘meridional jet stream‘-fueled winter drags on. Looking ahead, more of the same is on the cards, too, as we head into August:

Southern Africa

Southern Africa Freezes, Rare Snowfall Hits Johannesburg

Southern Africa is enduring fierce freeze this week as a blast of polar air engulfs the likes of SA, Namibia, Botswana, Zimbabwe, Mozambique, as well as Angola, Zambia and Malawi.

Coastal regions are struggling to climb above 10C (50F), while at higher-elevations and inland, frosts are proving widespread, with reports of rare snowfall coming out of some unusual spots such as Zimbabwe and South Africa, such as Johannesburg.

Several regions of South Africa are enduring a harsh winter this year, according to local media outlets, with this past weekend delivering an intensification. Sub-zero (C) lows struck Johannesburg and surrounding areas over the past few mornings, with daytime highs of just 4C (39.2F) noted–where the July average is closer to 17C (62.6F).

Temperatures also held low enough to keep the snow lying on the ground throughout the morning, bringing joyous scenes to many a school playground — this would have been the first time many children have seen snow (Prof David Viner take note).

Footnote:  Climate is Dynamic: Hot Today, Cold Tomorrow

And the same goes for precipitation:


So Many Global Parts Not Boiling

Australia

Why Is It So Cold Right Now? A Weather Expert Explains

Temperatures plummeted across southeast Australia this week, with Weatherzone reporting Canberra’s low of -7.2ºC was “its lowest temperature since 2018 and the lowest for June since 1986.”

Sydney experienced its coldest June morning today since 2010, with a temperature of 5.2ºC. In Victoria, temperatures of -7.2ºC were recorded.

Australia just had one of its coolest and wettest summers of the last decade. 

Snow settled on the Stirling Range in WA on Thursday morning after a frigid polar air mass travelled from Antarctica to Australia.

A long fetch of southerly winds has been blowing across the Southern Ocean during the past week, carrying polar air from the ice sheets of Antarctica into unusually low latitudes.

On Thursday morning, this Antarctic air mass reached the Stirling Range in WA and caused snow to settle on Bluff Knoll.

United Kingdom

Met Office explains why the weather is so miserable this May

‘High-pressure systems have been generally located over southern continental Europe and also to the far east of Europe’, they told Metro.co.uk.

The spokesperson continued: ‘As these high-pressure systems interacted through the season, the UK is positioned between them, leading to periods of cool, cloudy, and wet conditions for the UK.  ‘These have generally either swept in from the Atlantic or slipped between the high-pressure systems to reach the UK.

‘Warmer-than-average sea temperatures also provided the necessary fuel for clouds to develop, which has been quite persistent in spring.’

Met Office meteorologist Clare Nasir said: ‘Showers over the next few days could be heavy with the risk of thunder and hail.’   She added that the risk of thunder and hail persist through Wednesday and Thursday.

Where has the UK summer gone

Summer 2023 so far has been one of contrasts – after the warmest June on record we had an exceptionally wet July.  Northern Ireland and much of north-west England had their wettest July on record. Looking ahead there is no immediate end to the distinctly un-summery conditions. So what is going on?

Any spring warmth was hard to come by. After a cool April, very warm weather was distinctly lacking in May. Nowhere reached 24°C until the month was nearly over, on the 27th.

However, that theme changed dramatically in June. Temperatures soared to 32.2°C, with a heatwave being declared in many places and becoming the warmest June on record which, according to the Met Office, bears the “fingerprint of climate change”.

It was all change again in early July with low pressure setting in, and staying put. While much of Europe sweltered in a blistering heatwave the UK sat under cool, wet weather which looks set to stay for the first part of August too.

India

Is January 2023 going to be the coldest year in the 21st century?

There may be no relief from the ongoing spell of cold wave with minimum temperatures hovering below normal limits at most places, reports suggested. If a weather expert is believed, it has been predicted that temperatures in the plains are going to dip as far as -4 degrees Celsius next week.

Large parts of north India are still reeling under numbing cold with the mercury remaining below freezing point at most places in Jammu and Kashmir, while dense fog in the early hours of the morning hit road and rail traffic movement. Cold wave conditions abated in Delhi due to a fresh western disturbance affecting northwest India, even as a dense layer of fog lowered visibility to just 50 metres.

Northern India braces for coldest weather in years as dense fog, poor air quality linger

A new wave of cold weather is headed into northern India and could drop temperatures to levels not seen there in over three years, according to AccuWeather forecasters.

The cold weather shot will be the latest, and perhaps most significant, of many recent waves of chilly weather that have also led to travel-disrupting dense fog and poor air quality over parts of the Indian subcontinent since late December.

The temperature in New Delhi, the capital city of India and home to more than 18 million people, has the potential to drop as low as 2 degrees Celsius (35 degrees Fahrenheit) on Sunday night and Monday morning. While the record low for this coming Monday of 1.3 degrees Celsius below zero (29.7 degrees Fahrenheit) appears safe, it will be well below the average low of 6 degrees Celsius (42 degrees Fahrenheit) for the date.

Temperatures at this level would be the coldest readings in New Delhi since December 2019,” said Nicholls.

Ahead of the cold wave, the IMD has issued a cold wave warning for Sunday and Monday for the northern Indian states of Punjab, Haryana, Chandigarh, Delhi and Rajasthan. The warning was issued to give residents advance notice of a level of cold that could adversely impact human health and property.

Canada

Spring forecast 2023: The La Nina Winter pattern is forecast to extend as we head into Spring despite the breakdown of the cold ocean anomalies

Spring season 2023 is nearing, with forecasts revealing the jet stream pattern over the North Pacific and the Atlantic to be influenced by the diminishing La Nina. A high-pressure system in the Pacific will define the weather patterns over North America, with a potential Stratospheric warming event playing a role early in the season.

The cold ocean phase in the equatorial Pacific is already in breakdown mode. It is expected to decline rapidly towards early Spring.

But, despite the breakdown of these cold ocean anomalies (La Nina), its influence can still persist in global weather circulation. Long-range weather calculations also see this, extending the La Nina jet stream pattern from Winter into Spring 2023.

Spring sits on the sidelines with Winter’s wild ride to the finish line

USA

Winter Forecast 2024: The Brrr Is Back

The Brrr is Back!
“After a weird and warm winter season last year, this winter should make cold weather fans rejoice—especially those in the Great Lakes, Midwest, and northern New England areas,” shares editor Pete Geiger, adding “the ‘brrr’ is coming back! We expect more snow and low temperatures nationwide.”

East Coast Snow?
Folks living along the I-95 corridor from Washington to Boston, who saw a lack of wintry precipitation last winter, should experience quite the opposite, with lots of rain/sleet and snowstorms to contend with.

Texans Beware!
According to Farmers’ Almanac 2024, Texans should prepare for an unseasonably cold and stormy winter season ahead

Frosts in Florida?
Winter will be wet in the Southeast region however a few frosts are forecast to bring the “brrrs” to Floridians and its snowbirds.

Asia

As Asian countries hit by extreme cold snap, here’s what life is like at -53C

An intense cold spell is gripping east Asia, with temperatures plunging and hazardous conditions reported across China, the Koreas and Japan.

On Monday one of China’s northern-most cities broke its lowest ever recorded temperature, with the mercury hitting -53C at 7am on the first day of the Lunar New Year in Mohe, Heilongjiang province.

Japan and the Korean peninsula have also issued warnings over freezing temperatures and gales that have killed at least one person, while at least 57 people have been reported dead in Afghanistan as the wintry conditions stretch across into central Asia.

Europe

Record-Challenging Cold Sweeps Europe

It’s been cold — ask a European, ask me…

We’ve enjoyed a ‘comfortably cool’ July here in Central Portugal (thus far), it’s been great. Same with my old haunt, the UK. July 2023 there is on course to be colder-than-average–and vs the historically cool 1961-1990 era that the Met Office still insist on using, no less.

Looking ahead, and particularly at central/eastern nations, those summer chills are about to take another step down.

As per the latest GFS run (shown below), ‘pinks’ and ‘purples’ are forecast to engulf the likes of Poland, Slovakia, Hungary, Croatia, Serbia, Albania, Belarus, Ukraine and Romania this week, sending temperatures crashing by as much as 18C below the seasonal norm.

Record summer lows are expected, an unbiased media would report on them (not holding my breath).

Russia

Extreme cold grips Siberia, as temperatures fall to lowest levels since 2002

The coldest air on Earth plunged into Siberia this week, dropping temperatures to as low as 80 degrees Fahrenheit below zero. An expansion of that cold is expected across eastern Asia into early next week and eventually North America, according to AccuWeather forecasters.

The bitter cold not only allowed temperature benchmarks that have not been hit in decades in some parts of Russia, but the extreme weather also created an icy spectacle as firefighters battled a fire in subzero temperatures on Jan. 8 in Ufa, Russia. Massive icicles clung to the home amid the anomalous cold.

The same Arctic blast dropped temperatures in Moscow to their lowest levels in years this past weekend, while even parts of northern India will get a taste of the cold beginning later this weekend.

Antarctica

Antarctica Plunges to -83.2C (-117.8F)–Earth’s Lowest Temperature Since 2017

While the media tricks the dumb and the gullible into believing the world is on fire –with poverty-inducing CO2 reductions their only savior– Antarctica is shivering through an extreme bout of cold, even by South Pole standards.

The Italian-French research station ‘Concordia’ posted a reading of -83.2C (-117.8F) on July 25. This ranks as the fifth coldest daily value in the operational life of the station, bested only by Aug 2010’s -84.7C; July 2010’s -84.6C; and June 2017’s -83.9C and -83.5C.

As discussed recently, Antarctic sea ice’s tough time of it in 2023 isn’t related to temperature, that correlation simply doesn’t exist. The Antarctic continent continues to cool, the data are very clear on that, yet ice is taking a proverbial beating this season.

South America

Fierce frosts have gripped areas of Argentina and Chile

Some of that aforementioned Antarctic cold has been spun northward over Southern Hemisphere land masses.

Fierce frosts have gripped areas of Argentina and Chile of late, as South America’s topsy–turvy ‘meridional jet stream‘-fueled winter drags on. Looking ahead, more of the same is on the cards, too, as we head into August:

Southern Africa

Southern Africa Freezes, Rare Snowfall Hits Johannesburg

Southern Africa is enduring fierce freeze this week as a blast of polar air engulfs the likes of SA, Namibia, Botswana, Zimbabwe, Mozambique, as well as Angola, Zambia and Malawi.

Coastal regions are struggling to climb above 10C (50F), while at higher-elevations and inland, frosts are proving widespread, with reports of rare snowfall coming out of some unusual spots such as Zimbabwe and South Africa, such as Johannesburg.

Several regions of South Africa are enduring a harsh winter this year, according to local media outlets, with this past weekend delivering an intensification. Sub-zero (C) lows struck Johannesburg and surrounding areas over the past few mornings, with daytime highs of just 4C (39.2F) noted–where the July average is closer to 17C (62.6F).

Temperatures also held low enough to keep the snow lying on the ground throughout the morning, bringing joyous scenes to many a school playground — this would have been the first time many children have seen snow (Prof David Viner take note).


How to Get Free and Fair US Elections

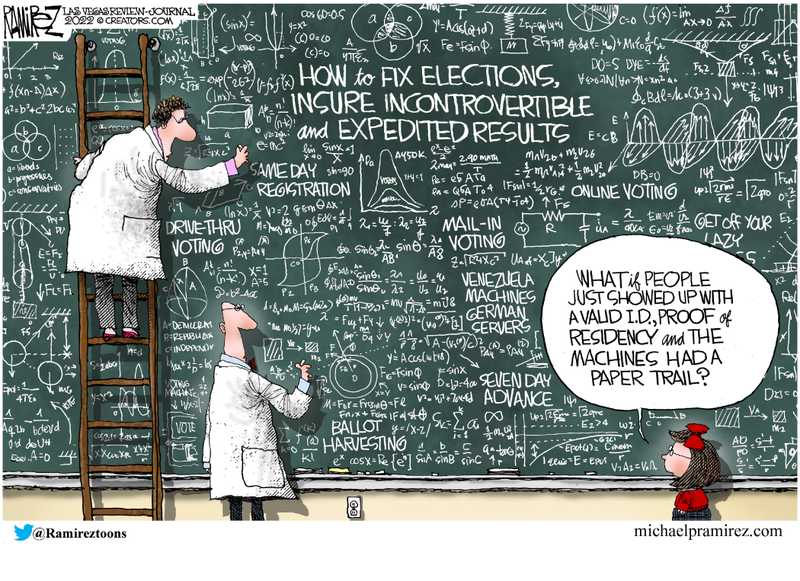
The image above gets it right on the basics:  Eligible voters come to their voting station with valid ID and proof of residency, and paper trail exists to validate machine entry and processing.  But there are some subtleties around the edges requiring management.  For example, voter registration should be in advance of the voting process, and not on election day.  Why? Because there’s no time to check for fake ID or residency. Later on is a post on why there must be an election day deadline, beyond which votes cannot be added to the count.  But first a look at some international standards regarding elections and balloting.

A Practical Guide to Democratic Elections Best Practice from Office for Democratic Institutions and Human Rights (OSCE).  Below is the section on Balloting.

Right:
To Universal Suffrage, To Equal Suffrage, To Secret Ballot, To Fair Elections
Which  Guarantee the Free Expression of the Will of the People

Balloting  Best Practices:

• Voting procedures must be understandable so that voters are able to vote without difficulty

• Voting should take place in a polling station; however, other means of voting are permissible for voters who are physically unable to attend a polling station, but only where there are safeguards in place to prevent fraudulent voting

• Observers and representatives of candidates and political parties must be permitted to observe the delivery of election materials, preparation of the polling place, voting, and counting of ballots

• Members of the military should vote in the place of their permanent residency, or in a polling station near their duty station

• Voting must be in person, by secret ballot

• Voters must present adequate identification information and sign register in order to vote

• Only the voter may mark a ballot, except that a voter who requires assistance for physical reasons may be assisted by another voter who is not a member of the election administration or an observer

• Ballots and voting materials must be securely maintained before, during, and for a sufficient period of time after an election

• The entire counting process must be conducted in a transparent manner in the presence of observers and representatives of candidates, political parties, and the media

• There must be procedures for, in the presence of observers, independent verification of all elements of the counting and tabulation

• All results of voting, tabulations, and protocols must be publicly posted at the polling station and copies given to representatives of observers, and transmitted to higher levels of election commissions in a transparent manner

• Intermediate tabulations and protocols must be publicly posted at intermediate election commissions and copies given to representatives of observers

• All final voting results must be published in media as soon as possible after elections in such a manner that voters are able to check results at their polling places

• Legal measures must be in place to deter electoral fraud in the voting, counting, and tabulation processes

Navarro Report On the 2020 US Presidential Election

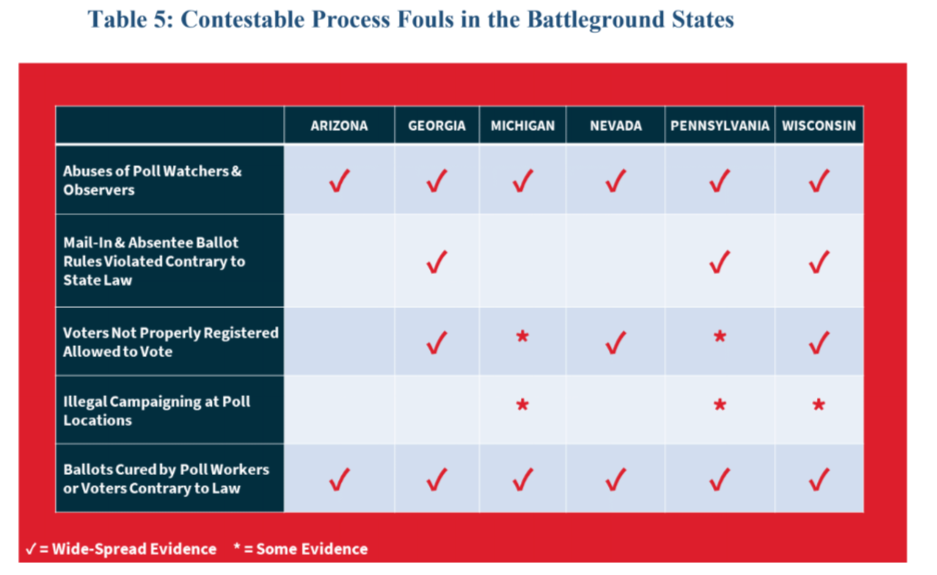
There is extensive evidence that the US 2020 election did not respect the above best practices.  The 2021 Navarro Report (link in red above) provides the details summarized in this table:

The detailed report includes many documented events, including evidence under the heading Outright Voter Fraud:

Fake Ballot Manufacturing and Destruction of Legally Cast Real Ballots

Fake ballot manufacturing involves the fraudulent production of ballots on behalf of a candidate; and one of the most disturbing examples of possible fake ballot manufacturing involves a truck driver who has alleged in a sworn affidavit that he picked up large crates of ballots in New York and delivered them to a polling location in Pennsylvania.  There may be well over 100,000 ballots involved, enough fake ballots alone to have swung the election to Biden in the Keystone State.

Likewise in Pennsylvania, there is both a Declaration and a photo that suggests a poll worker used an unsecured USB flash drive to dump an unusually large cache of votes onto vote tabulation machines. The resultant tabulations did not correlate with the mail-in ballots scanned into the machines.

Arguably the most flagrant example of possible fake ballot manufacturing on behalf of Joe Biden may have occurred at the State Farm Arena in Atlanta, Georgia. The possible perpetrators were caught in flagrante delicto on surveillance video. In one version of this story, poll watchers and observers as well as the media were asked to leave in the middle of the night after a suspicious water leak. Once the room was cleared, several election officials pulled out large boxes of ballots from underneath a draped table. They then proceeded to tabulate a quantity of fake manufactured ballots estimated to be in the range of tens of thousands

Finally, as an example of the possible destruction of legally cast real ballots there is this allegation from a court case filed in the United States District Court for the District of Arizona: Plaintiffs claim that over 75,000 absentee ballots were reported as unreturned when they were actually returned. These absentee ballots were then either lost or destroyed (consistent with allegations of Trump ballot destruction) and/or were replaced with blank ballots filled out by election workers or other third parties.

And so on, and so on.  All of these worst practices were employed with impact because of a fundamental illegality that disqualifies any and all elections when it occurs.  Jonathan Gault explains the problem in his American Thinker article Beware the ‘Long Count’.  Excerpts in italics with my bolds.

Though barely campaigning, unable to speak, and drawing massive crowds, measured in dozens, waving to nobody, on the rare occasions when he was able to muster the energy to leave his basement, Joe Biden remarkably received the most votes of any candidate in US history. However, his historic popularity notwithstanding, his debatable victory nevertheless still required eking out miraculously close races in the hyper-partisan Democrat strongholds of Atlanta, Milwaukee, Philadelphia, Phoenix, and Las Vegas, each of which employed the Long Count.

The Long Count is defined as counting votes well past election day.

Long Counts took place in these cities (and others) because, said the Democrats, “every vote must be counted,” even though, in many jurisdictions, early voting was available for months prior to election day on November 3, 2020.

Even with modern technology, for some reason, 21st-century Americans are unable to count votes, even over a period of two months, so we now also count votes well past election day. Therein lies the rub… However, considering that we are dealing with modern-day Bolsheviks, for whom, in their quest for unbridled power, the end justifies the means, there may still be hope.

There are numerous explanations rationalizing the leftist zeal for mail-in voting. One is most certainly to capture the dead vote. It is common knowledge that, once deceased, even lifelong Republicans flip to Democrat upon entering the grave. Another is to capture the “almost dead” vote. Those in end-of-life care are certainly entitled to vote, but they mustn’t be included if no longer lucid (as, for example, our titular head of state).

Yet another is to “enfranchise the disenfranchised,” postulating that minorities who are able to acquire driver’s licenses, get to work, catch flights, make doctor’s appointments, etc., are somehow incapable of figuring out how to vote. More useful is harvesting as many unclaimed mail-in ballots as possible. These tend to go Democrat because the “bag men” executing the fraud understand that their “elected” representatives will not enforce voter fraud laws against the co-conspirators who keep them in power.

The aforementioned notwithstanding, the real reason for mail-in voting enthusiasm is that it creates chaos, and as the events of the past four years have shown, chaos is the Bolshevik goal, and the perception of chaos is all that is needed.

My goodness! How can all that paper possibly be counted by election day? If “every vote must be counted,” the final tally must extend long after the election has concluded until ballots cease to arrive. Two weeks, six weeks, “whatever it takes.”

This drive for chaos also explains why leftists despise in-person voting. When voting in person, the votes are tallied in real-time, the polls close at the pre-appointed time, and the tallies are certified by representatives from each party and transmitted to “election central” before the end of election day. There is no Long Count. And therefore, the “bogey” cannot be identified.

The bogey is the second part of the key to voter fraud, as it represents
the vote differential between the Republican candidate and the Democrat
at the time the in-person polls close.

Using the Long Count, poll closure merely serves to determine the bogey. Once determined, the counting then continues indefinitely until enough ballots are “received” (really created, retrieved, or recounted) in order to flip the result. This explains what happened in Atlanta, Las Vegas, Milwaukee, Philadelphia, and Phoenix twice (once in 2020, during the Presidential election, and again in 2022, in the Gubernatorial election, carried out both times under the aegis of Arizona “Governor” Katie Hobbs, who, as Arizona attorney general, carried out the fraud on her own behalf after testing it out in the 2020 Presidential election).

Pennsylvania “Governor” and former Attorney General Josh Shapiro did the same after infamously tweeting in 2020 that (and I paraphrase) “there was no way that Trump could win Pennsylvania.” One wonders how the person in charge of conducting the election could know that “fact” before conducting the election. Now you know why Attorneys General have a high success rate when running for Governor.

If the Long Count is the real election integrity issue,
what can be done about it?

In 1997, the Supreme Court unanimously ruled in Foster v. Love that, as one article carefully explains, “Elections Undecided by Midnight are Void & Preempted by Federal Law.” The Court’s clear ruling must be understood to nullify long counts. At the very least, the issue must be litigated, adjudicated, confirmed, and broadly publicized before the 2024 Election to ensure that the Federal Election Commission will void election results in any jurisdiction that engages in counting past election day, ensuring that it doesn’t again occur.

Only in that way can we be certain that our next election will be an honest one. We are onto them (“Fool me once shame on you, fool me twice…” ), and therefore a “shot across the bow” is required to act as a deterrent so that Democrats don’t attempt a reprise of 2020’s and 2022’s behavior in the upcoming election. We now understand very well what is happening.

I believe that President Trump had such a commanding lead at midnight on November 3, 2020, that, had the polls closed, and counting ended at 11:59:59 pm that evening, as per Foster v Love, with no bogeys calculated nor counted toward, he would have won. And if he had won, our society, country, and, indeed, the world would right now be far safer, happier, and better places for all of mankind, and most certainly Americans.

Footnote Regarding Candidates in a Free Election

From OSCE Best Election Practices:

Candidates and Political Parties and Campaigning Best Practices

• All candidates and political parties must be treated equally before the law and on a non-discriminatory basis

• Candidates must be permitted to stand individually or as representatives of political parties

• All candidates and political parties must be provided sufficient access to media in order for voters to become adequately informed of views, programs, and opinions of the electoral contestants

• The formula for allocating media access among candidates and political parties must be fair, understandable, and capable of objective application

• Coverage by state supported or sponsored media must be neutral, unbiased, and on non-discriminatory basis

• No unreasonable limitations may be placed on the right to freedom of speech or expression

• No unreasonable limitations may be placed on the right to freedom of assembly

• No unreasonable limitations may be placed on the right to freedom of association

• All candidates, political parties, supporters, and voters must be treated on a non-discriminatory basis


Left Coast Closes the Dam Lights

The Klamath River flows by the remaining pieces of the Copco 2 Dam after deconstruction in June 2023. Juliet Grable / JPR

Triumphal headlines like this report the Klamath River news With one down, Klamath dam removal proceeds on schedule.  Excerpts in italics with my bolds and added images.

Removing the Copco 2 Dam takes deconstruction crews one step closer
to drawdowns of the remaining three reservoirs next January.

The first of four hydroelectric dams along the Oregon-California border has been removed from the main stem of the Klamath River. All that remains of the dam known as Copco 2 in Siskiyou County, California, is the headworks of a diversion tunnel adjacent to the now free-flowing river.

When complete, the overall project will be the biggest dam removal in U.S. history and will reopen 400 miles of fish habitat that was cut off for more than a century.  Deconstruction activities on Copco 2 will continue until September. Getting this first dam out of the way takes deconstruction crews one step closer to drawdowns of the remaining three reservoirs next January.

From CBS News:    The project, estimated at nearly $450 million, would reshape the Klamath River and empty giant reservoirs, and could revive plummeting salmon populations by reopening habitat that has been blocked for more than a century.  The proposal fits into a trend in the U.S. toward dam demolition as these infrastructure projects age and become less economically viable. More than 1,700 dams have been dismantled nationwide since 2012.

The structures at the center of the debate are the four southernmost dams in a string of six constructed in southern Oregon and far northern California beginning in 1918. They were built for power generation, and none has “fish ladders,” concrete chutes fish can pass through.

Two dams to the north are not targeted for demolition. They have fish passage and are part of a massive irrigation system that straddles the Oregon-California border and provides water to more than 300 square miles (777 square kilometers) of crops.

Those farmers won’t be directly affected but worry the demolition will set a precedent.

Good for the Salmon and Indigenous Fishermen, but what about the Lost Power?

Congressmen LaMalfa and Bentz draw the practical implications of this action in their press release Klamath Dams are Engines of Energy and Economic Reliability   September 29, 2022

A statement highlighting the importance of hydropower energy in the West
and opposing the removal of the four Klamath hydroelectric dams.

Hydropower is the oldest source of renewable energy in the United States and accounts for nearly a third of total U.S. renewable electricity generation. Hydroelectric dams play a critical role in the resiliency of the West’s electrical grid, the preservation of our landscape, flood control, the creation of space for outdoor recreational activities, and many of these dams assist in the delivery of water to farms for agriculture production. Hydropower is a win for the environment, domestic energy production, and economic development in rural areas.

So why is hydropower under attack? Because some outlier environmental groups have claimed that dam removal is necessary for fish health, even though these dams provide stored water for fish in low water years and the needed cold water for fish in hot summers.

Residents in the Klamath Basin in Southern Oregon and Northern California know about this struggle because of the proposed Klamath River dam removal – the largest dam removal project in U.S. history. For decades, PacifiCorp (the owner of the dams), local municipalities, tribes, agriculture producers, and conservationists have gone back and forth arguing the benefits and drawbacks of the four Klamath Dams – Copco #1, Copco #2, Iron Gate, and J.C. Boyle.

Dam removal advocates claim the dams block salmon and steelhead spawning and rearing habitat in the Upper Basin, even though their only science is a questionable Master’s thesis. These advocates have conveniently avoided discussions of other factors that have caused salmon and steelhead populations to decline, such as overfishing, pollution from forest fires, a marginal population in a warm river, and disease.

They irresponsibly ignore the immense amount of sediment behind each dam, and how releasing it will impact water quality and river health, including the years long decimation of the very salmon runs they claim to want to protect. Nor have they considered how dam removal will affect other wildlife species who reside near the river and in the reservoirs, such as Canada Geese, sandpipers, Western Pond Turtles, and crayfish. It is essential that the conversation regarding dam removal consider the big picture, how this action will affect the Basin’s entire ecosystem and the people who live there, rather than base solutions solely on hypothetical scenarios for salmon.

Those who support keeping the dams know the true benefits they bring to the area. The Klamath River Hydroelectric Project generates, annually, enough low-cost, reliable power for 70,000 households. The dams provide good-paying, technical jobs and are the largest single private taxpayer in the county of Siskiyou. The reservoirs created by each dam are critical to the area’s firefighting efforts, ground water recharge, pulse flows for clearing debris, and flood control.

Removing hydroelectric dams from our energy grid will drive up energy costs,
decimate local jobs, and increase dependency on oil and natural gas
– something both California and Oregon have opposed.

The proper and best position on these dams is crystal clear: hydropower provides renewable, cheap energy to our power grid around the clock. It’s unconscionable that so-called environmental advocates are forcing dam removals across the West without the scientific evidence to back up their ideas, and no acknowledgement of the catastrophic consequences that could occur from these actions.

As the Federal Energy Regulatory Commission advances the removal of four dams on the Klamath, and elsewhere across the West, we must continue the fight to protect these engines of energy and economic reliability.”

Summary

The zero carbon juggernaut rumbles on, chewing up pieces of modern society’s energy platform.  Even dams are removed despite their essential baseload power stabilizing the grid, with no carbon emissions. Meanwhile, gas and coal supply infrastructure is constrained and allowed to decay, with no chance wind and solar will make up the difference in reliable affordable power.

Big Wind Decimates Balsa Farmers

Amazon rain forest devastated to mount monstrous virtue signalling prayer wheels elsewhere. Stop the subsidies and the devastation from wind “farms.”

From The Defender Wind Energy’s Dirty Secret: Deforestation of the Amazon and Devastation of Indigenous Communities.  Excerpts in italics with my bolds.  H/T mohandeer

Booming demand for balsa wood, used to make turbine blades for wind energy,
is ravaging Amazon forests and indigenous communities —
in the name of “green power.”

Story at a glance:

  • The rapid expansion of wind energy has led to increasing demand for windmills and balsa wood to build them.
  • The tropical tree is facing exploitation and being cleared from Amazon forests, causing potentially more environmental problems than the windmills it creates can solve.
  • Wind turbine blades can be up to 328 feet (100 meters) long; each blade requires 150 cubic meters of balsa wood, which is several tons.
  • China is a major consumer of balsa wood, purchasing 85% of Ecuador’s exports in 2020.
  • The Open Democracy video, “A Green Paradox,” documents how the rush for balsa wood to create “green” wind energy has destroyed local indigenous communities and decimated ecosystems.

Balsa, a tree that’s native to South America, is a coveted resource. Growing up to 98 feet (30 meters) and ready for harvesting in just three to four years from planting, balsa holds the promise for high profits for those who grow them.

Adding to its value, balsa wood is flexible and light yet very strong, making it an ideal material for manufacturing bridges, skis, boats and wind turbine propellers.

In an ironic tragedy, however, the rapid expansion of wind energy has led to
increasing demand for windmills and balsa wood to build them
.

Now, the tropical tree is facing exploitation and being cleared from Amazon forests, causing potentially more environmental problems than the windmills it creates can solve.  

Logging Amazon rainforests to create massive wind turbine propellers is the opposite of sustainable. Meanwhile, birds and bats — many species of which are already endangered — are suffering. It’s estimated that 600,000 to 949,000 bats, and up to 679,000 birds, are killed annually by wind turbines in the U.S.

But the number of wind turbines has increased significantly since these estimates were calculated, which means many more are probably affected. Areas, where wind farms are built, are also in peril, as the giant structures have a significant socio-economic impact.

As it stands, wind energy is falling into the trap of many “green” initiatives before it,
claiming to offer a solution to save the planet
while instead helping to destroy it.

How Warmists Turn the Public Off

Wildfires raging outside Athens this summer are just one reason environmentalists are raising alarms louder than ever — even as many activists insist their messages lack the proper resonance with voters. AP

Kevin D. Williamson explains at NY Post Why climate change activists have failed to score public support.  Excerpts in italics with my bolds.

We are hearing even more than usual about climate change this summer and that is not surprising — not with dog-days news cycles driven by record-setting heat waves, torrential rains and widespread Canadian wildfires.

Some climate activists think we are not hearing enough about the issue: Writing in The Guardian, columnist Jonathan Freedland insists that the problem is one of marketing. “The climate movement has devoted relatively few resources to reaching or persuading the public,” he writes, preposterously.

He quotes progressive p.r. man David Fenton — “We’re in a propaganda war, but only one side is on the battlefield” — and cites former United Nations climate grandee Christiana Figueres, who claims “the climate community has recoiled from marketing.” Why? Because, Figueres says, it is “sort of tainted. It’s icky. You know, ‘We’re too good for marketing. We’re too righteous’. . . Hopefully we’re getting over it.”

Of all the dumb and dishonest things that have been written and said in the climate debate, the notion that climate-change activists just can’t get their message out — that they won’t stoop to marketing — may be the very dumbest and most dishonest.

Billions of dollars have been spent on climate-change advocacy,
to say nothing of money devoted to actual climate policies.

Raging wildfires in Eastern Canada have sent vast plumes of smoke across North America this summer. Environmentalists loudly suggest the smoke is proof of a changing planet, even as progressives insist their agenda is being silenced. via REUTERS

The government leaders of practically every democratic country speak about the issue constantly.

In the intergovernmental sector, you have everybody from the United Nations to the International Monetary Fund ringing the climate alarm bells, while in the private sector you can count on the likes of BlackRock, Goldman Sachs and other corporate titans to do the same.

ESG rules have pushed the climate issue onto the corporate agenda in a big way—companies are spending billions in total (as much as $1.4 million per company) on climate-reporting costs alone.

Even the supposed villains in the story — big energy companies such as ExxonMobil — spend billions of dollars a year advertising the green agenda. “In the past ten years we have reduced greenhouse gas emissions in our operations by more than 7 million metric tons,” ExxonMobil boasts, “which is the equivalent of taking about 1.4 million cars off the road.” You may not think they are sincere, but they are far from silent about the issue.

Companies such as private equity biggie BlackRock are spending billions on ESG programs, which link their investment strategies with left-wing social goals. REUTERS

Climate activists have the commanding heights. What do the so-called deniers have?
A few of my cranky libertarian friends.  .  . And voters.

The real issue with climate policy isn’t that voters don’t know about the issue — it is that they disagree. Climate policy touches everything from big tech to farming to economic growth, everything from the homes we live in to the cars we drive, and, as such, an ambitious climate program will necessarily impose big costs.

The Alexandria Ocasio-Cortezes of the world can pretend that green policies will pay for themselves, but no serious person believes that.

One of the clearest ways to reduce our reliance on fossil fuels is to expand access to nuclear energy, which requires major investment in new infrastructure. Getty Images

Sure, Guardian headline writers can straight-up declare “The beauty of a Green New Deal is that it would pay for itself” — this is nothing more than that “marketing” to which our green friends supposedly are so averse.

American voters do care about climate issues, but not as intensely as activists would like. Climate routinely polls in the single digits when it comes to voters’ top concerns, far behind (surprise!) the economy and health care.  Independents rate immigration a more pressing issue than climate change.

Maybe you think the US government is under the heel of the oil barons, but no democratic country has undertaken the kind of economic transformation climate activists advocate.

The signatories of the Paris Agreement are far from meeting their climate obligations; the $100 billion a year in climate-finance commitments promised at the UN climate summit in Glasgow have not been fully funded; even in the European Union, the leaders of which take a much stronger climate line than their US counterparts, there has been no radical change.

A coal excavator in Germany, which boosted coal mining in the wake of gas shortages caused by the Ukraine crisis. AP

Germany responded to Russia’s recent energy blackmail by reopening coal plants.

European voters rank climate a higher priority than Americans do, but it typically polls behind economic growth and immediate issues such as the invasion of Ukraine.

That is not oil-drenched propaganda at work— that is, for better and for worse,
democratic politics at work.

While there has been piecemeal progress, countries across the globe are moving at a glacial pace when it comes to the one policy that can reliably reduce greenhouse-gas emissions at a reasonable cost: rapidly expanding nuclear power, which has an operational carbon footprint of approximately zero.

The state government in Pennsylvania got that collapsed interstate overpass reopened in record time by waiving all sorts of planning and permitting rules, but no such urgency exists in the case of nuclear power or other needful energy infrastructure.

Christiana Figueres, who leads the UN’s climate change campaign, contends that environmental issues suffer from a lack of proper marketing. Many would certainly disagree. LightRocket via Getty Images

That, unfortunately, is democracy, too.  What is needed is not more marketing — more propaganda, more hysteria.   What is needed is a more attractive set of trade-offs.

But finding better trade-offs means admitting that there are trade-offs, which climate activists — hostage to their marketing departments — have too often refused to do.

Promises made at major multi-national climate conferences such as the Paris Accords remain unmet as liberal democracies appear unable to overhaul their energy strategies. Getty Images

It isn’t that climate activists aren’t selling their agenda — it is that
voters in democratic countries around the world are not buying it.

Arctic Ice Surplus End July 2023

The animation above shows the Arctic sea ice extent on day 212 (end of July) from 2007 to yesterday 2023. Unsurprisingly the distribution varies, most notably there being less open water 2023 along the Russian shelf seas on the left side.  OTOH, Hudson Bay in most years still has some ice, but this year not.  Overall, Arctic ice this year is in surplus to the 17-year average and to 2007.

The graph above shows the July monthly average ice extent for the last 17 years for both MASIE and SII datasets.  Most years SII is slightly lower with the MASIE average at 8.279M km2 and SII at 8.033 (not shown).  Note that 2007 was near the lowest in the period and 2023 among the highest.

The graph for the last 30 days shows the normal melt is 2.7M km2 down to 6.9M km2.  2023 was tracking average for 2 weeks, and well above average after that.  SII tracked the MASIE average throughout, and sllghtly lower the second half. 2007 was average mid-July, but dropped much lower toward the end.

The table for day 212 shows how the ice extent is distributed across the Arctic regions, in comparison to 17 year average and 2007.  2023 was ~300k km2 above average, or 4% of total extent.

Region 2023212 Day 212 Average 2023-Ave. 2007212 2023-2007
 (0) Northern_Hemisphere 7232358 6936889  295469  6344860 887498 
 (1) Beaufort_Sea 723443 799968  -76525  760576 -37133 
 (2) Chukchi_Sea 659025 540756  118269  382350 276675 
 (3) East_Siberian_Sea 675190 756025  -80835  445385 229805 
 (4) Laptev_Sea 474071 371485  102587  314382 159689 
 (5) Kara_Sea 265568 161953  103615  239232 26336 
 (6) Barents_Sea 54417 29804  24612  23703 30714 
 (7) Greenland_Sea 328529 296824  31705  324737 3792 
 (8) Baffin_Bay_Gulf_of_St._Lawrence 243516 144525  98991  94179 149337 
 (9) Canadian_Archipelago 514780 555079  -40299  510063 4717 
 (10) Hudson_Bay 79485 143888  -64403  93655 -14170 
 (11) Central_Arctic 3213192 3134907  78285  3154837 58355 

The table shows earlier than average melting in Beaufort and East Siberian seas and Hudson Bay.  Surpluses are everywhere else, especially in Chukchi, Laptev and Kara Seas, as well as Baffin Bay and Central Arctic.  2007 was nearly a full Wadham less than 2023 yesterday.

Illustration by Eleanor Lutz shows Earth’s seasonal climate changes. If played in full screen, the four corners present views from top, bottom and sides. It is a visual representation of scientific datasets measuring Arctic ice extents and snow cover.