2023: August Report from Sea Ice Prediction Network
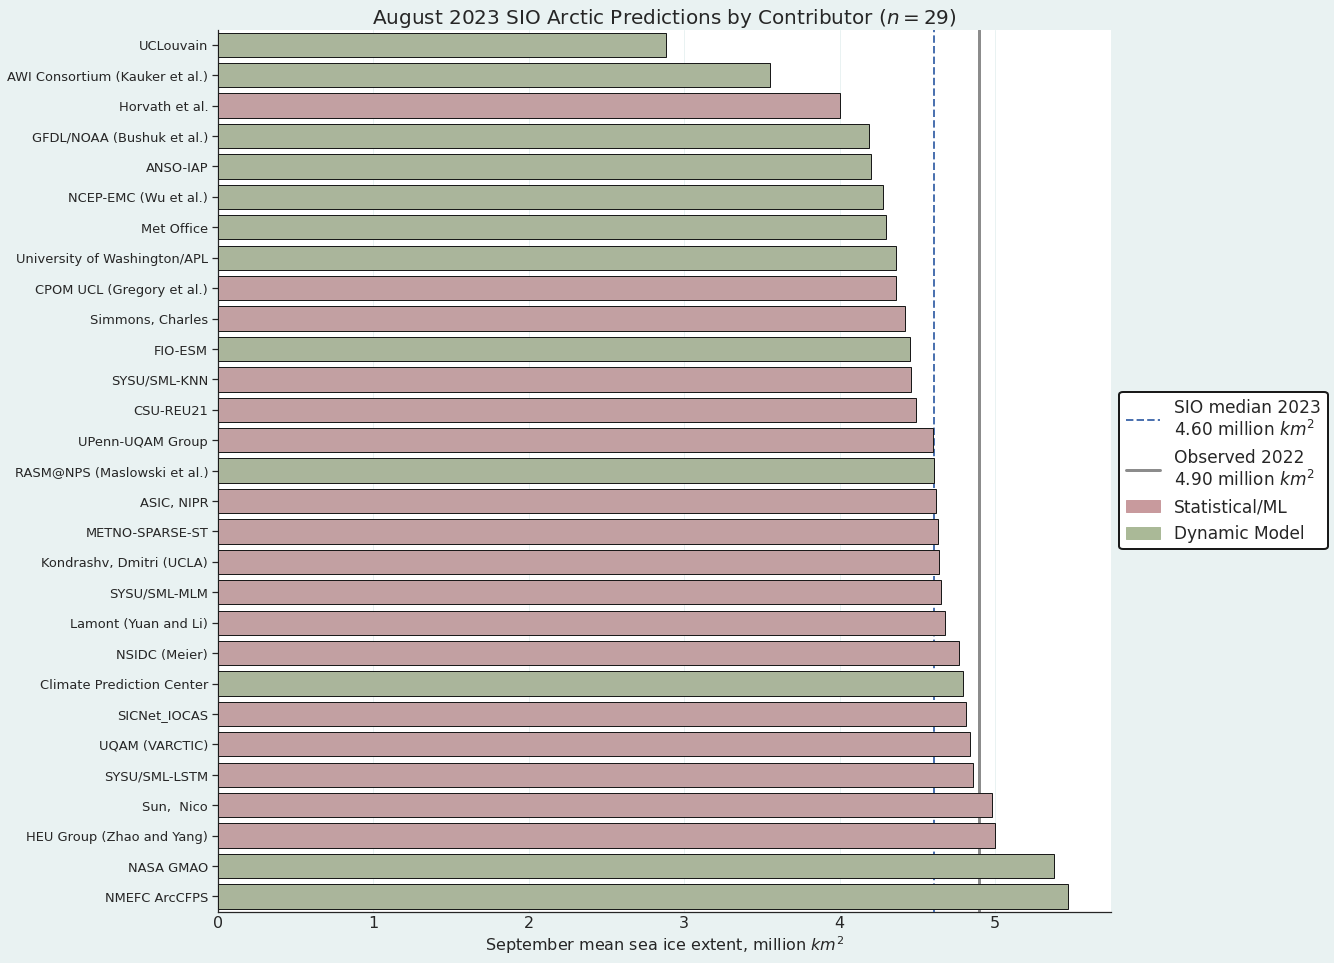
The August median forecasted value for pan-Arctic September sea-ice extent is 4.60 million square kilometers with interquartile values of 4.35 and 4.80 million square kilometers, while individual forecasts range from 2.88 to 5.47 million square kilometers. We note that the lowest two forecasts predict a new record September sea-ice extent value (current record is September 2012, with a sea-ice extent of 3.57 million square kilometers), but these forecasts are outliers relative to the other contributions.
These are predictions for the September 2023 monthly average ice extent as reported by NOAA Sea Ice Index (SII). This post provides a look at the 2023 Year To Date (YTD) based on monthly averages comparing MASIE and SII datasets. (17 year average is 2006 to 2022 inclusive).

The graph puts 2023 into recent historical perspective. Note how 2023 was slightly below the 17-year average for the first 5 months, then recovered to match average in May and has maintained or exceeded average through August. The outlier 2012 provided the highest March maximum as well as the lowest September minimum, coinciding with the Great Arctic Cyclone that year. 2007 began the period with the lowest minimum except for 2012. SII 2023 was running below MASIE except for May/Juneand is currently just below MASIE 2007 and 2012.
The table below provides the numbers for comparisons (all are M km2)
| Monthly | MASIE 2023 | SII 2023 | MASIE -SII | MASIE 2023-17 YR AVE | SII 2023-17 YR AVE | MASIE 2023-2007 |
| Jan | 13.579 | 13.347 | 0.232 | -0.207 | -0.250 | -0.183 |
| Feb | 14.481 | 14.177 | 0.304 | -0.207 | -0.292 | -0.171 |
| Mar | 14.655 | 14.440 | 0.215 | -0.212 | -0.248 | 0.032 |
| Apr | 13.979 | 13.992 | -0.013 | -0.120 | -0.025 | 0.283 |
| May | 11.866 | 12.159 | -0.293 | -0.742 | -0.492 | -0.561 |
| June | 11.044 | 10.963 | 0.081 | 0.242 | 0.099 | 0.218 |
| July | 8.431 | 8.183 | 0.248 | 0.152 | 0.150 | 0.439 |
| Aug | 5.825 | 5.561 | 0.264 | -0.062 | -0.083 | 0.241 |
The first two columns are the 2023 YTD shown by MASIE and SII, with the MASIE surpluses in column three. Column four shows MASIE 2023 compared to MASIE 17 year average, while column five shows SII 2023 compared to SII 17 year average. YTD August both MASIE and SII are very slightly below average. The last column shows MASIE 2017 holding an August surplus of 241k km2 over 2007.
Summary
The experts involved in SIPN are expecting SII 2023 September to be higher than 2007 and somewhat lower than 2022. The way MASIE is going, this September looks to be nearly average unless some bad weather intervenes. While the daily minimum for the year occurs mid September, ice extent on September 30 is typically slightly higher than on September 1.
Footnote:
Some people unhappy with the higher amounts of ice extent shown by MASIE continue to claim that Sea Ice Index is the only dataset that can be used. This is false in fact and in logic. Why should anyone accept that the highest quality picture of ice day to day has no shelf life, that one year’s charts can not be compared with another year? Researchers do this, including Walt Meier in charge of Sea Ice Index. That said, I understand his interest in directing people to use his product rather than one he does not control. As I have said before:
MASIE is rigorous, reliable, serves as calibration for satellite products, and continues the long and honorable tradition of naval ice charting using modern technologies. More on this at my post Support MASIE Arctic Ice Dataset

MASIE: “high-resolution, accurate charts of ice conditions”
Walt Meier, NSIDC, October 2015 article in Annals of Glaciology.
