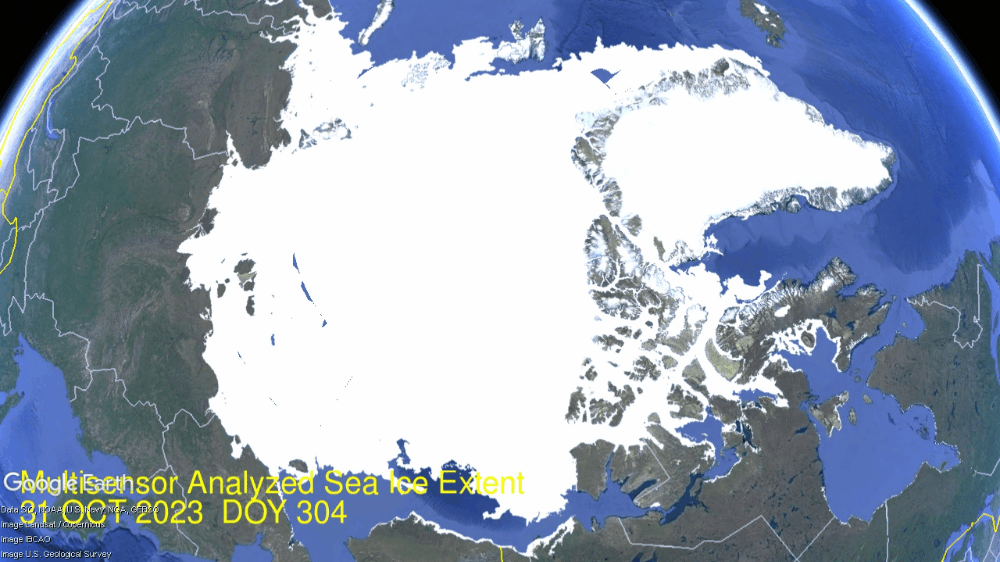
The animation shows the rapid growth of Arctic ice extent during November 2023, from day 304 to yesterday, day 319. For all of the fuss over the September minimum, little is said about Arctic ice growing back rapidly; that’s 4 Wadhams in October, plus another 1.3M in Nov to total 10M km2, or 10 Wadhams. The Russian side on the left froze over in October, and now at the center bottom you can see Beaufort sea and Canadian Archipelago icing up. Center right is Baffin Bay growing ice as well.
The graph below shows the last 30 days of 2023 compared to the 17 year average (2006 to 2022 inclusive), to SII (Sea Ice Index) and some notable years.
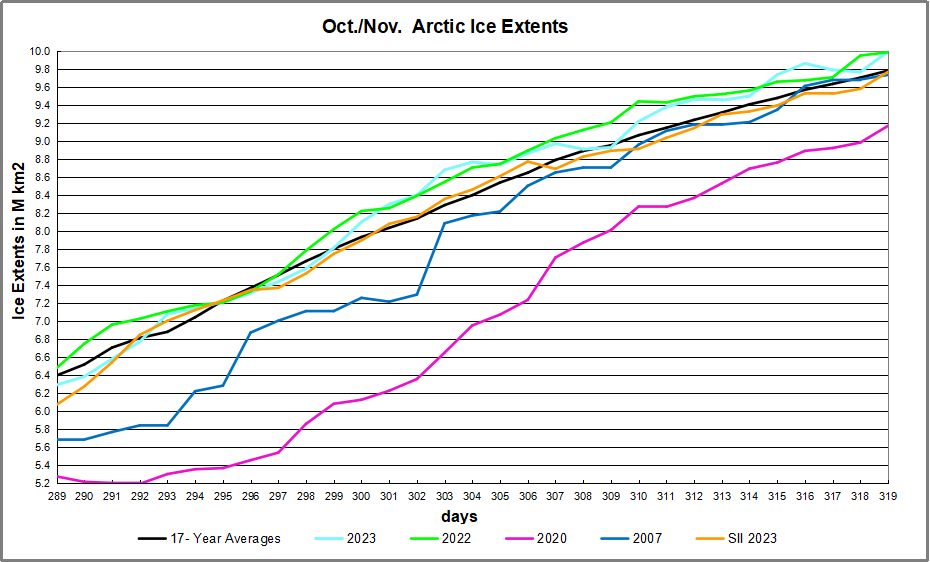
From Mid October to Mid November 2023, MASIE shows NH ice extent growing from 6.3 M km2 to 10M. That matches 2022 and exceeds the 17 year average by more than 200K km2. SII (Sea Ice Index) is only slightly lower.

The table below shows the distribution of ice in the Arctic Ocean basins.
| Region | 2023319 | Day 319 Ave. | 2023-Ave. | 2007319 | 2023-2007 |
| (0) Northern_Hemisphere | 9997068 | 9784253 | 212815 | 9737614 | 259454 |
| (1) Beaufort_Sea | 1051194 | 1063450 | -12257 | 1053727 | -2533 |
| (2) Chukchi_Sea | 596947 | 629695 | -32748 | 503783 | 93164 |
| (3) East_Siberian_Sea | 1064913 | 1075985 | -11072 | 1043952 | 20960 |
| (4) Laptev_Sea | 897845 | 897217 | 628 | 897845 | 0 |
| (5) Kara_Sea | 696199 | 658489 | 37710 | 765376 | -69177 |
| (6) Barents_Sea | 245998 | 154920 | 91078 | 145438 | 100560 |
| (7) Greenland_Sea | 613312 | 460620 | 152692 | 527575 | 85737 |
| (8) Baffin_Bay_Gulf_of_St._Lawrence | 536576 | 526706 | 9870 | 533931 | 2645 |
| (9) Canadian_Archipelago | 841536 | 850736 | -9200 | 852539 | -11003 |
| (10) Hudson_Bay | 161371 | 234076 | -72704 | 231544 | -70173 |
| (11) Central_Arctic | 3236821 | 3174741 | 62081 | 3156228 | 80594 |
Overall ice extent has 212k km2 above average or 2%. The only sizeable deficit is in Hudson Bay, more than offset by surpluses elsewhere, especiallly in Greenland and Barents seas, along with the Central Arctic.


One comment