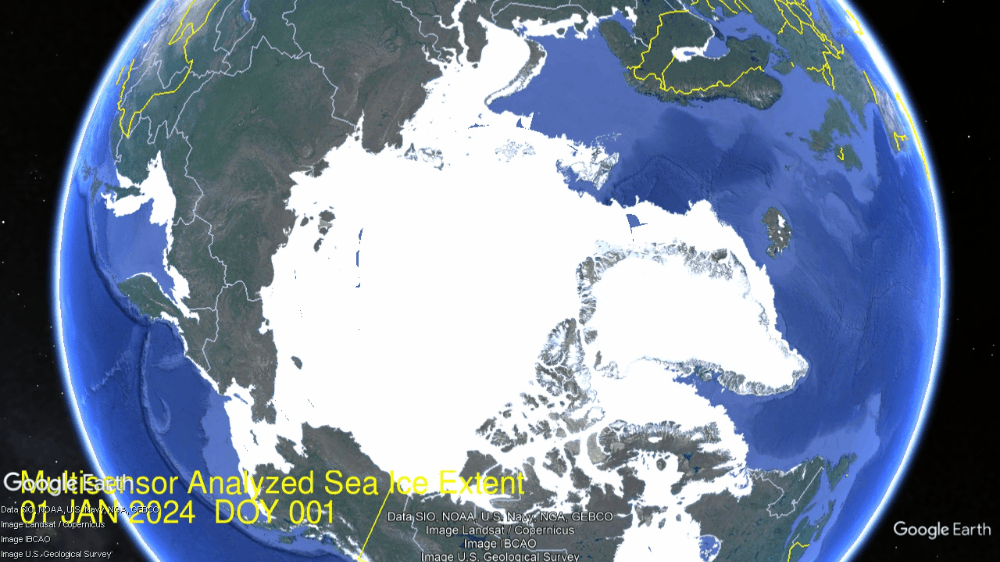
Many noticed the Gore effect during COP28 when Arctic ice extents grew rapidly to catch up and exceed normal. Now in the first 10 days of January Arctic ice is growing way faster than normal. On the left, both Bering and Okhotsk seas are now ~65% of their maxes. Kara at top is 100% of max and Barents next to Kara is 83% of max. Overall, the Arctic has already reached 93% of last year’s Mid March maximum.

A Lufthansa aircraft at the snow-covered Munich airport on Saturday. Photograph: Karl-Josef Hildenbrand/AP
Coincidently, COP28 also triggered heavy snow bringing chaos to southern Germany causing Munich to suspend flights to anywhere, including Dubai. Now January is breaking the glazed ceiling outstriping past conditions.
The graph below shows the gains in ice extent the first 10 days of January 2024, the 18 year average and some other recent years, as well as SII (Sea Ice Index).
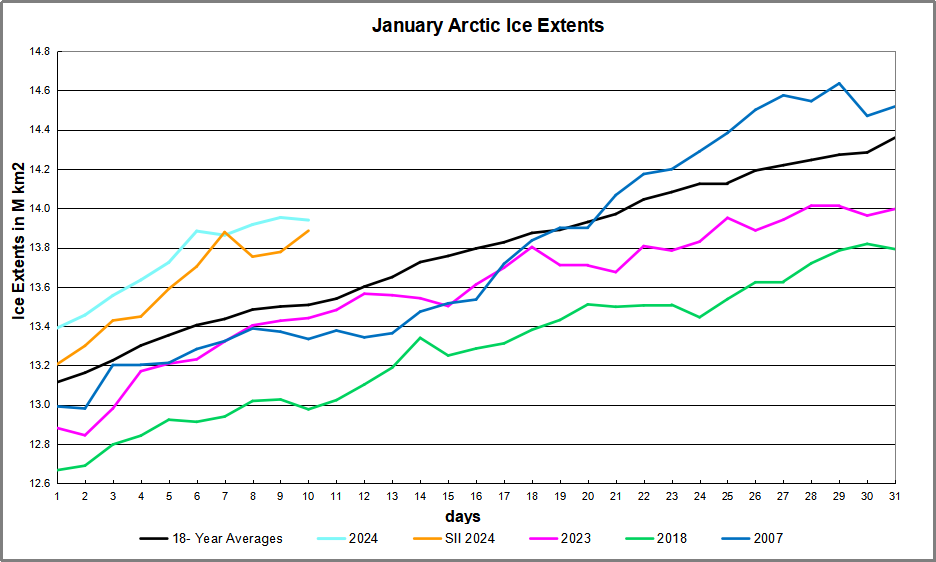
MASIE and SII are both well above the 18 year average, and almost 10 days ahead of it. 2024 is on the verge of breaking 14M km2, just 400k km2 short of normal extents at end of January.

The table below shows the distribution of ice in the Arctic Ocean basins.
| Region | 2024010 | Day 10 | 2024-Ave. | 2007010 | 2024-2007 |
| (0) Northern_Hemisphere | 13940138 | 13508235 | 431903 | 13334598 | 605540 |
| (1) Beaufort_Sea | 1070966 | 1070352 | 614 | 1069711 | 1255 |
| (2) Chukchi_Sea | 966006 | 965221 | 785 | 966006 | 0 |
| (3) East_Siberian_Sea | 1087137 | 1087131 | 6 | 1087137 | 0 |
| (4) Laptev_Sea | 897845 | 897836 | 8 | 897845 | 0 |
| (5) Kara_Sea | 934227 | 914139 | 20088 | 909703 | 24524 |
| (6) Barents_Sea | 593194 | 463310 | 129884 | 363027 | 230166 |
| (7) Greenland_Sea | 722914 | 577267 | 145647 | 576959 | 145955 |
| (8) Baffin_Bay_Gulf_of_St._Lawrence | 941219 | 1088951 | -147732 | 934564 | 6655 |
| (9) Canadian_Archipelago | 854860 | 853418 | 1442 | 852767 | 2094 |
| (10) Hudson_Bay | 1260903 | 1249501 | 11402 | 1260839 | 65 |
| (11) Central_Arctic | 3233482 | 3202675 | 30807 | 3204750 | 28732 |
| (12) Bering_Sea | 492428 | 503203 | -10775 | 606863 | -114435 |
| (13) Baltic_Sea | 128886 | 33634 | 95252 | 3303 | 125582 |
| (14) Sea_of_Okhotsk | 729537 | 565328 | 164209 | 585350 | 144187 |
Note that Arctic ice now nearly 14M km2 and 432k km2 above average, or 3.2%. As shown in the table above, the only deficit to average is in Baffin Bay, Offsetting are surpluses elsewhere, especially in Greenland sea, along with Barents and Okhotsk seas. Really, the only regions left to grow much up to max are Baffin Bay, Bering and Okhotsk seas.


