
Arctic Ice Roaring Back in Max Month of March
The animation shows growing Arctic ice extents over the last two weeks. Of course central Arctic basins are frozen solid, and the additions are visible on both the Atlantic side (right) and the Pacific (left).
The graph below shows March daily ice extents for 2024 compared to 18 year averages, and some years of note.
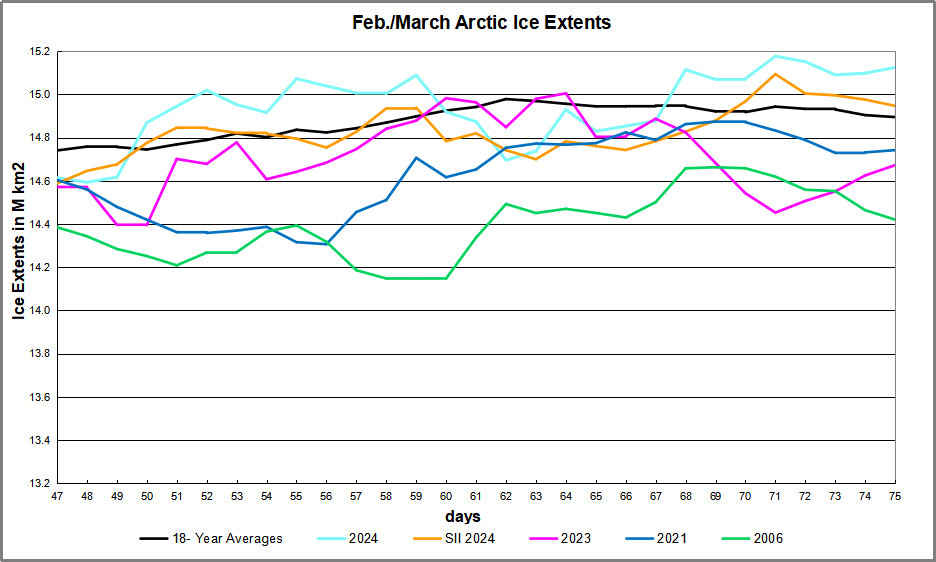
The black line shows during March on average Arctic ice extents nearly reach 15 Wadhams (15M km2) on Day 62, March 2. A slow decline is normal until Day 75, March 15. However, that period in 2024 saw Arctic ice increase 430k km2, nearly half a Wadham. Note also that this year ice extents rose above 15M already in February, and now in March ice has been well above that threshold for the last week. 2006 was the first year in this dataset and on Day 75 was 704k km2 less than yesterday. As usual in transitional months like March and September SII (Sea Ice Index) shows a similar pattern with generally lower extents.
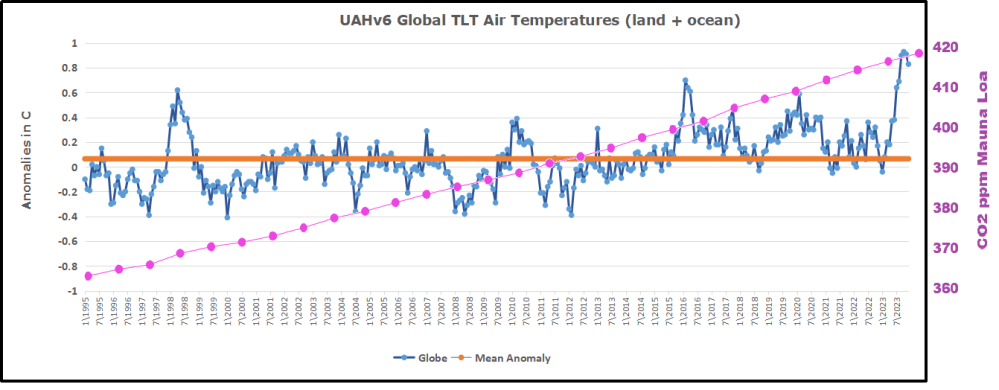
Why is this important? All the claims of global climate emergency depend on dangerously higher temperatures, lower sea ice, and rising sea levels. The lack of additional warming prior to 2023 El Nino is documented in a post UAH January 2024: Ocean Warm, Land Cooling.
The lack of acceleration in sea levels along coastlines has been discussed also. See USCS Warnings of Coastal Flooding
Also, a longer term perspective is informative:
 The table below shows the distribution of Sea Ice on day 75 across the Arctic Regions, on average, this year and 2006.
| Region | 2024075 | Day 75 Ave | 2024-Ave. | 2006075 | 2024-2006 |
| (0) Northern_Hemisphere | 15124987 | 14895040 | 229947 | 14420679 | 704309 |
| (1) Beaufort_Sea | 1070983 | 1070317 | 667 | 1069711 | 1273 |
| (2) Chukchi_Sea | 966006 | 965891 | 115 | 964227 | 1779 |
| (3) East_Siberian_Sea | 1087137 | 1087110 | 27 | 1086702 | 435 |
| (4) Laptev_Sea | 897845 | 897837 | 8 | 897773 | 71 |
| (5) Kara_Sea | 935023 | 920555 | 14469 | 921428 | 13595 |
| (6) Barents_Sea | 671826 | 643180 | 28646 | 646196 | 25630 |
| (7) Greenland_Sea | 771468 | 621747 | 149721 | 613161 | 158308 |
| (8) Baffin_Bay_Gulf_of_St._Lawrence | 1336897 | 1529678 | -192781 | 1134817 | 202080 |
| (9) Canadian_Archipelago | 854860 | 853214 | 1646 | 852715 | 2145 |
| (10) Hudson_Bay | 1260903 | 1258048 | 2855 | 1251360 | 9543 |
| (11) Central_Arctic | 3243865 | 3222218 | 21647 | 3244243 | -378 |
| (12) Bering_Sea | 723227 | 735481 | -12254 | 635252 | 87975 |
| (13) Baltic_Sea | 78741 | 80321 | -1580 | 175063 | -96322 |
| (14) Sea_of_Okhotsk | 1215262 | 990338 | 224924 | 874372 | 340890 |
The overall surplus to average is 230k km2, (2%). The only major deficit is in Baffin Bay, more than offset by surpluses in Okhotsk and Greenland seas. Everywhere else is maxed out.


Illustration by Eleanor Lutz shows Earth’s seasonal climate changes. If played in full screen, the four corners present views from top, bottom and sides. It is a visual representation of scientific datasets measuring Arctic ice extents.


2 comments