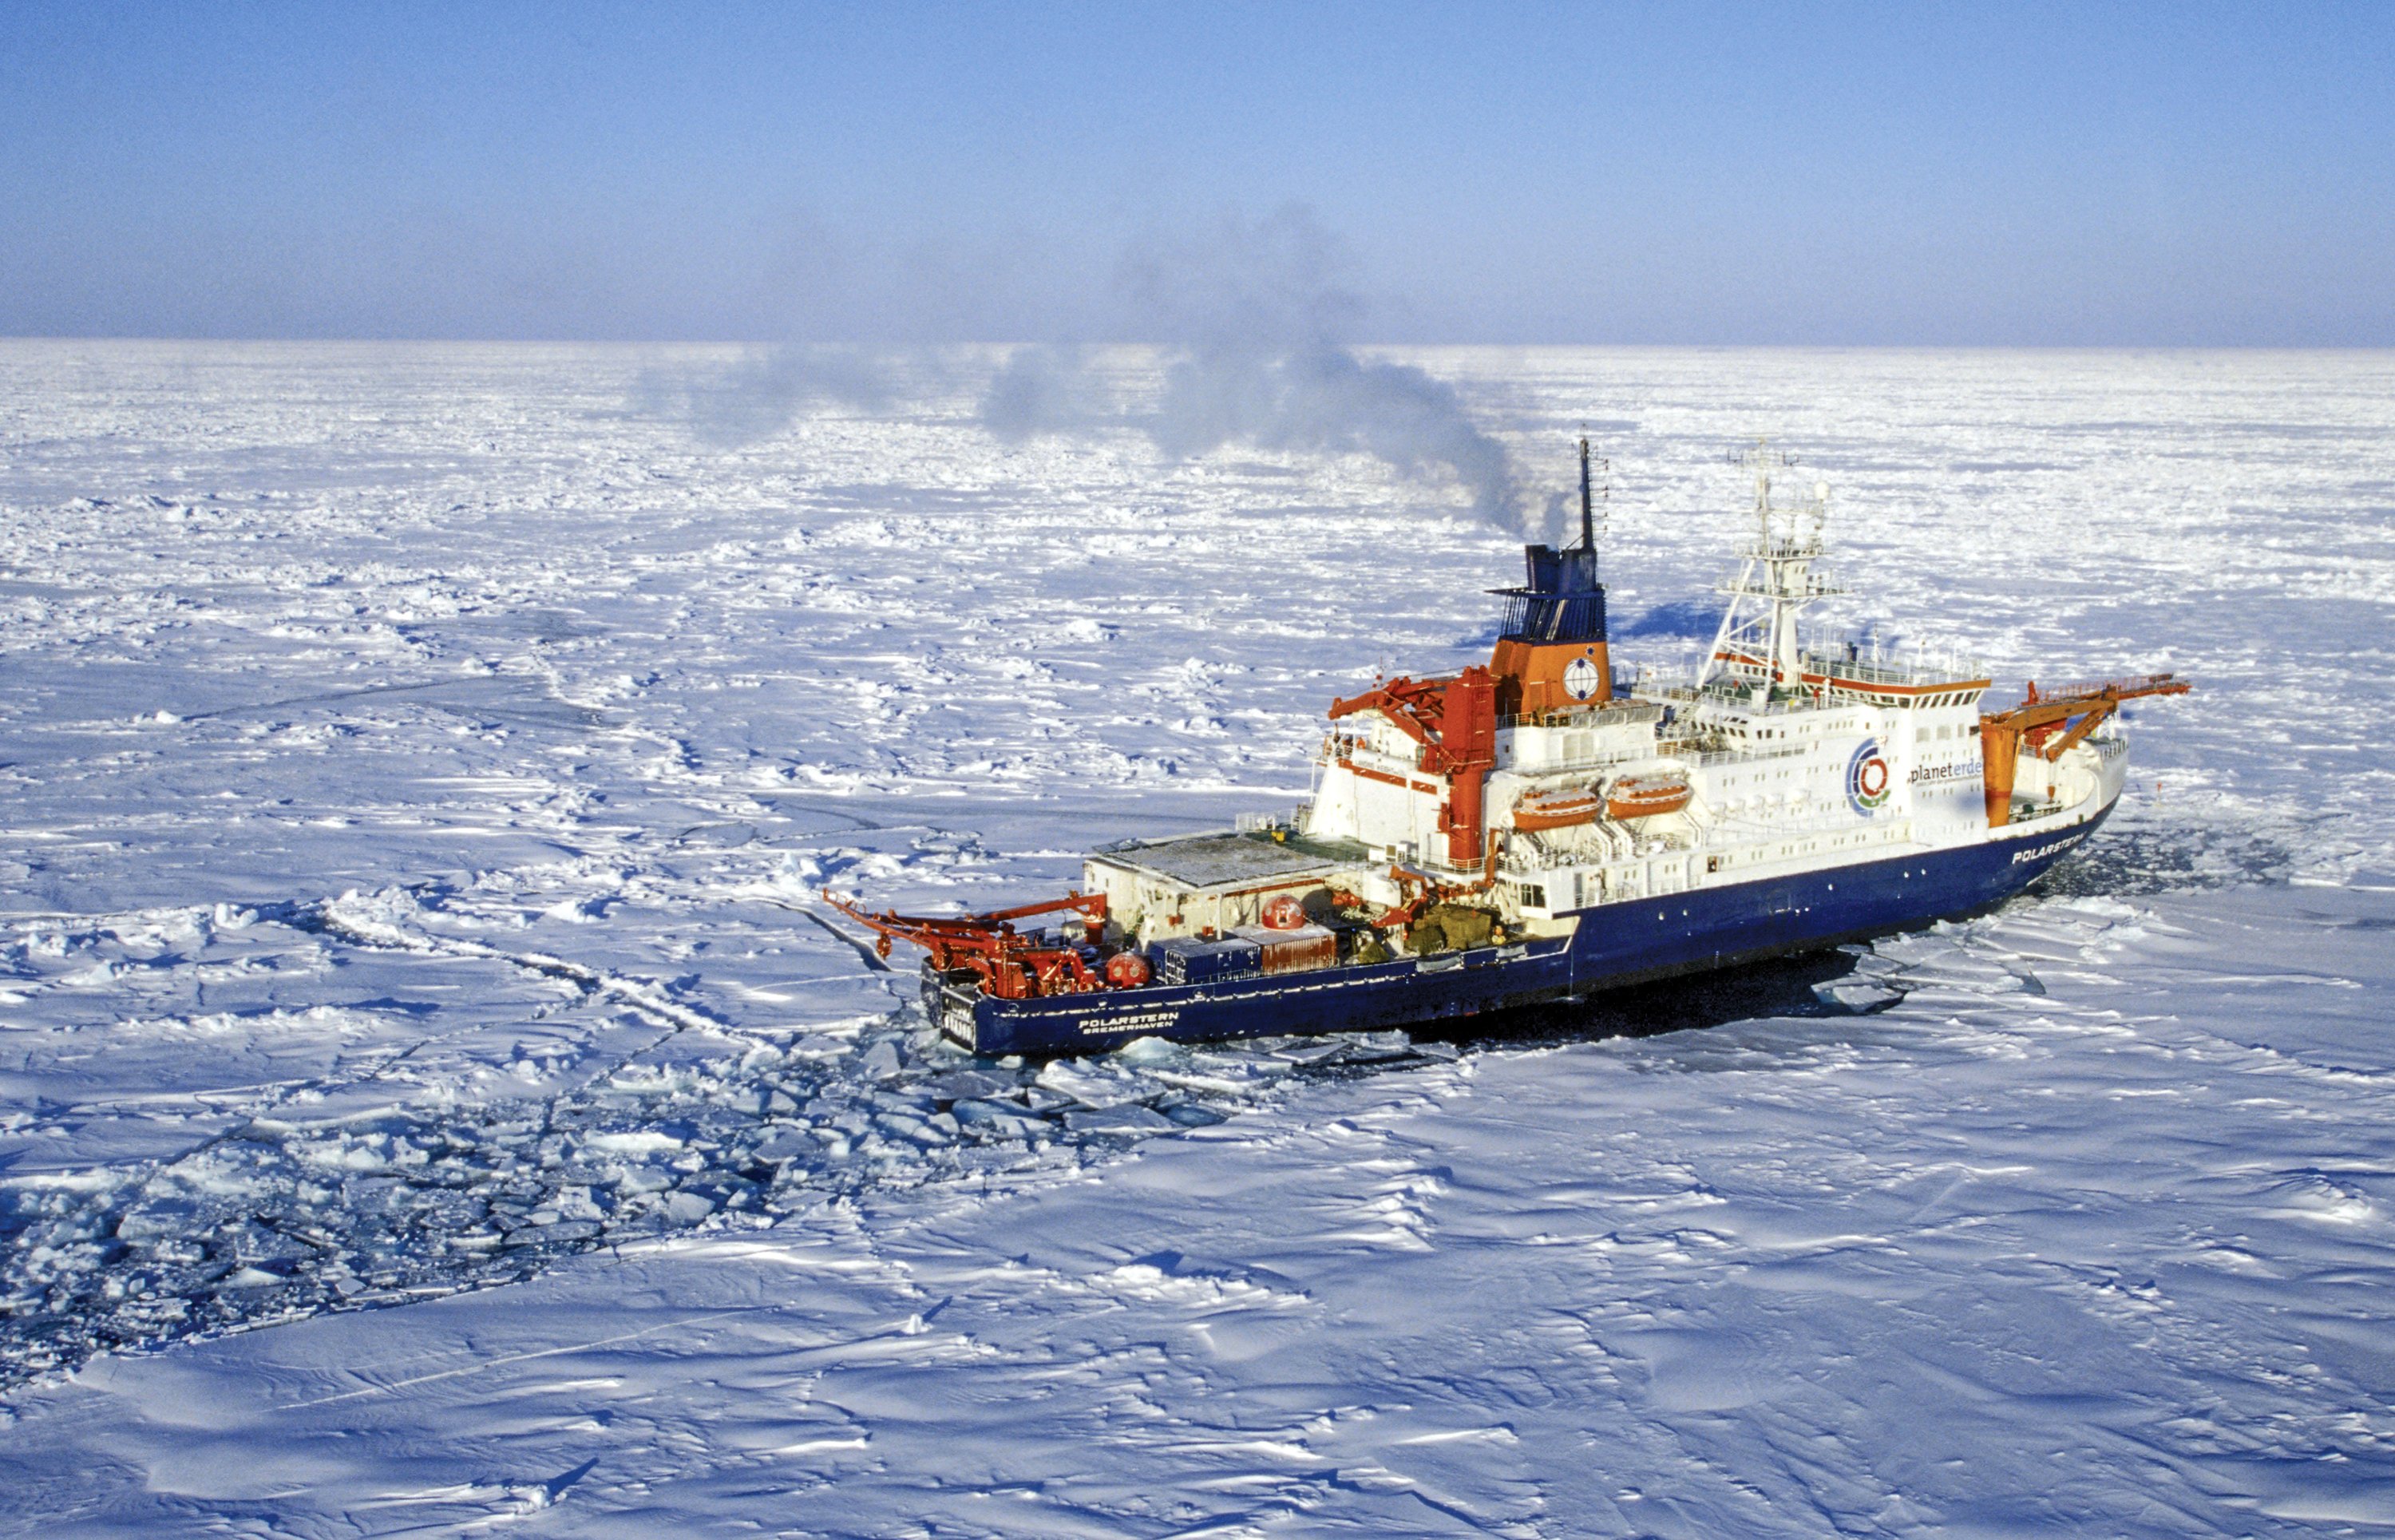
Research ship drifting along with Arctic ice, May 2019 US Naval Institute
In May, most of the Arctic ocean basins are still frozen over, while the melting of ice extent is underway in the marginal regions. During the last 30 days, on average according to MASIE, Arctic ice extents lose 1.4M km2. The few basins where open water appears this time of year tend to fluctuate and alternate waxing and waning.
The graph below shows the mid April to mid May patterns for ice extents on average, this year and some other years of note.
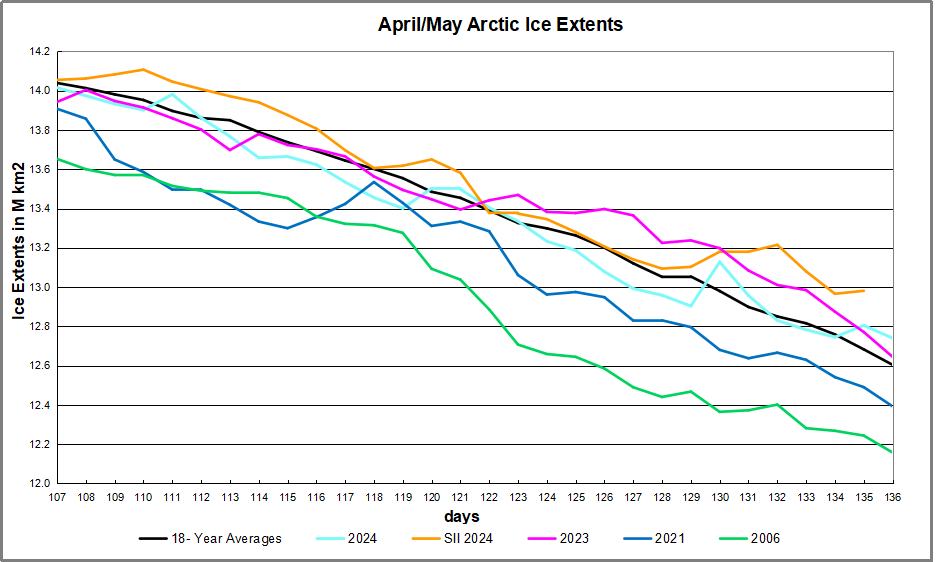
The graph shows the 18-year average loss for April is 1.4M km2. 2024 started this period with a slight deficit and ended 136k km2 above average. SII showed higher throughout, and much greater extents in May (still awaiting the number for Day 136). Other recent years have been nearly average, while 2006 ended with a large defict of ~400k km2.
| Region | 2024136 | Day 136 Ave | 2024-Ave. | 2006136 | 2024-2006 |
| (0) Northern_Hemisphere | 12740271 | 12604358 | 135913 | 12157814 | 582457 |
| (1) Beaufort_Sea | 1059379 | 1045092 | 14287 | 1066139 | -6760 |
| (2) Chukchi_Sea | 962124 | 924541 | 37582 | 956734 | 5389 |
| (3) East_Siberian_Sea | 1081877 | 1081548 | 330 | 1074876 | 7001 |
| (4) Laptev_Sea | 892100 | 879228 | 12872 | 889990 | 2109 |
| (5) Kara_Sea | 875173 | 876506 | -1333 | 839569 | 35603 |
| (6) Barents_Sea | 562240 | 406857 | 155382 | 182554 | 379686 |
| (7) Greenland_Sea | 666605 | 613812 | 52793 | 519337 | 147268 |
| (8) Baffin_Bay_Gulf_of_St._Lawrence | 984569 | 1059633 | -75065 | 892335 | 92234 |
| (9) Canadian_Archipelago | 838357 | 841188 | -2831 | 828806 | 9550 |
| (10) Hudson_Bay | 1117021 | 1177260 | -60239 | 1071342 | 45679 |
| (11) Central_Arctic | 3216321 | 3225072 | -8750 | 3169225 | 47096 |
| (12) Bering_Sea | 370480 | 285787 | 84693 | 478464 | -107984 |
| (13) Baltic_Sea | 14356 | 5552 | 8804 | 15239 | -883 |
| (14) Sea_of_Okhotsk | 98529 | 179953 | -81424 | 168615 | -70086 |
The table shows regional ice extents in km2. Note that Hudson and Baffin Bays have started melting, and Hudson will likely go to open water in a few weeks. Sea of Okhotsk on the Pacific side is down 81k, offset by a similar surplus in Bering sea. Note the huge surplus in Barents sea on the European side. Everywhere else is mostly in surplus, especially the seas of Barents, Greenland and Bering. 2006 had 582k km2 less ice extent than 2024 (more than half a Wadham).
The polar bears had a Valentine Day’s wish for Arctic Ice.

And Arctic Ice loves them back, returning every year so the bears can roam and hunt for seals.

Footnote:
Seesaw accurately describes Arctic ice in another sense: The ice we see now is not the same ice we saw previously. It is better to think of the Arctic as an ice blender than as an ice cap, explained in the post The Great Arctic Ice Exchange.
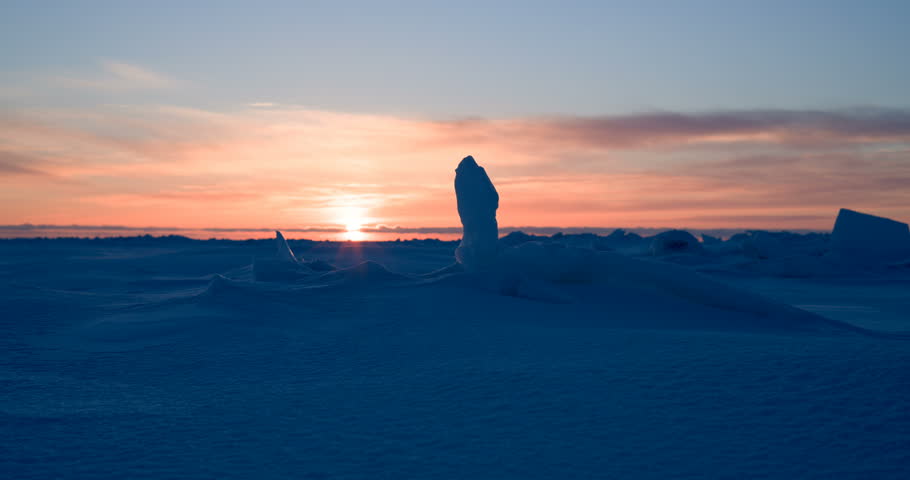
Sunrise over frozen Bering Sea
