Climatists Make Their Case by Omitting Facts

One of the world’s top economists has written an expert court report that forcefully supports a group of children and young adults who have sued the federal government for failing to act on climate change. (Source: Inside Climate News  here) Excerpts in italics with my bolds.

Stiglitz, a Columbia University economics professor and former World Bank chief economist, concludes that increasing global warming will have huge costs on society and that a fossil fuel-based system “is causing imminent, significant, and irreparable harm to the Youth Plaintiffs and Affected Children more generally.” He explains in a footnote that his analysis also examines impacts on “as-yet-unborn youth, the so-called future generations.”

But, he says, acting on climate change now—by imposing a carbon tax and cutting fossil fuel subsidies, among other steps—is still manageable and would have net-negative costs. He argues that if the government were to pursue clean energy sources and energy-smart technologies, “the net benefits of a policy change outweigh the net costs of such a policy change.”

“Defendants must act with all deliberate speed and immediately cease the subsidization of fossil fuels and any new fossil fuel projects, and implement policies to rapidly transition the U.S. economy away from fossil fuels,” Stiglitz writes. “This urgent action is not only feasible, the relief requested will benefit the economy.”

Stiglitz has been examining the economic impact of global warming for many years. He was a lead author of the 1995 report of the UN’s Intergovernmental Panel on Climate Change, an authoritative assessment of climate science that won the IPCC the 2007 Nobel Peace Prize, shared with Al Gore.

The Stiglitz expert report submitted to the court is here.

An Example of Intentional Omissions

Since this is a legal proceeding, Stiglitz wrote a brief telling the plaintiffs’ side of the story. In a scientific investigation, parties would assert theories attempting to explain all of the evidence at hand. Legal theories have no such requirement to incorporate all the facts, but rather present conclusions informed by the evidence deemed strongest and most pertinent to one party’s interests.

While the Pope accuses us with the Sin of Emissions, we counter with the Sins of Omissions by him and his fellow activists.

Let’s consider the Stiglitz brief according to the three suppositions comprising the Climatist (Activists and Alarmists) position. Climate change is a bundle that depends on all three assertions to be true.

Supposition 1: Humans make the climate warmer.

As an economist, Stiglitz defers to the IPCC on this scientific point, with references to reports by those deeply involved and committed to Paris Accord and other UN climate programs. In the recent California District Court case (Cities suing Big Oil companies), both sides in a similar vein stipulated their acceptance of IPCC reports as authoritative regarding global warming/climate change.

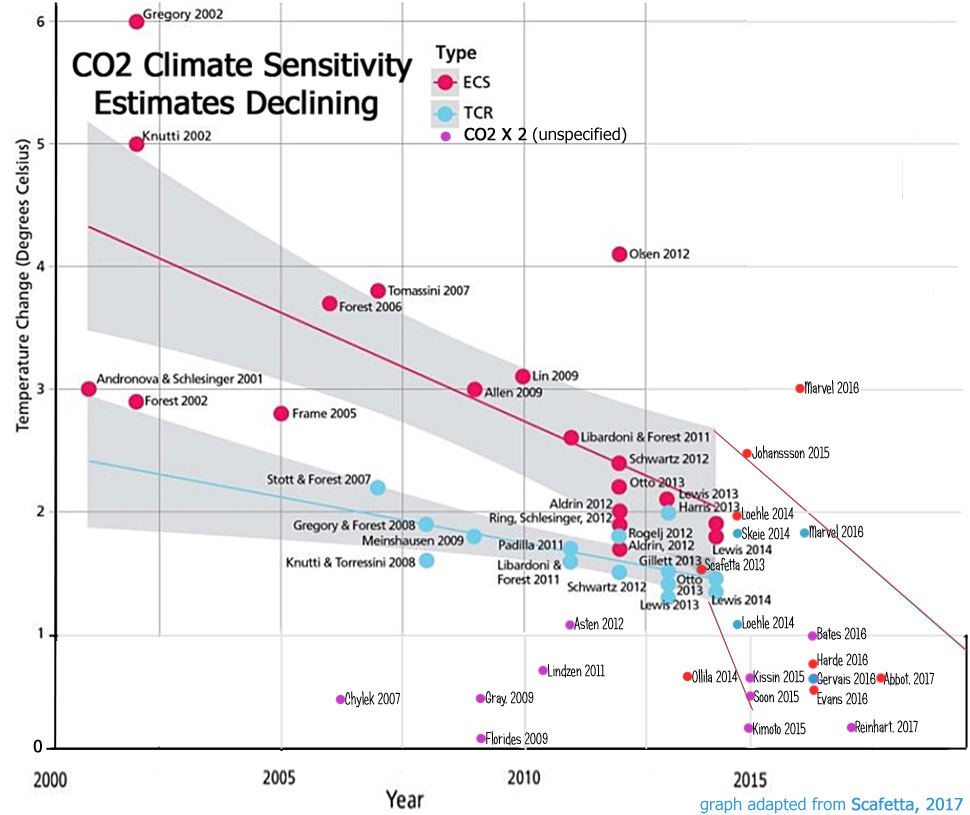
Skeptical observers must attend to the nuances of what is referenced and what is hidden or omitted in these testimonies. For example, Chevron’s attorney noted that IPCC’s reports express various opinions over time as to human influence on the climate. They noted that even today, the expected temperature effect from doubling CO2 ranges widely from 1.5C to 4.5C. No mention is made that several more recent estimates from empirical data (rather than GCMs) are at the low end or lower.

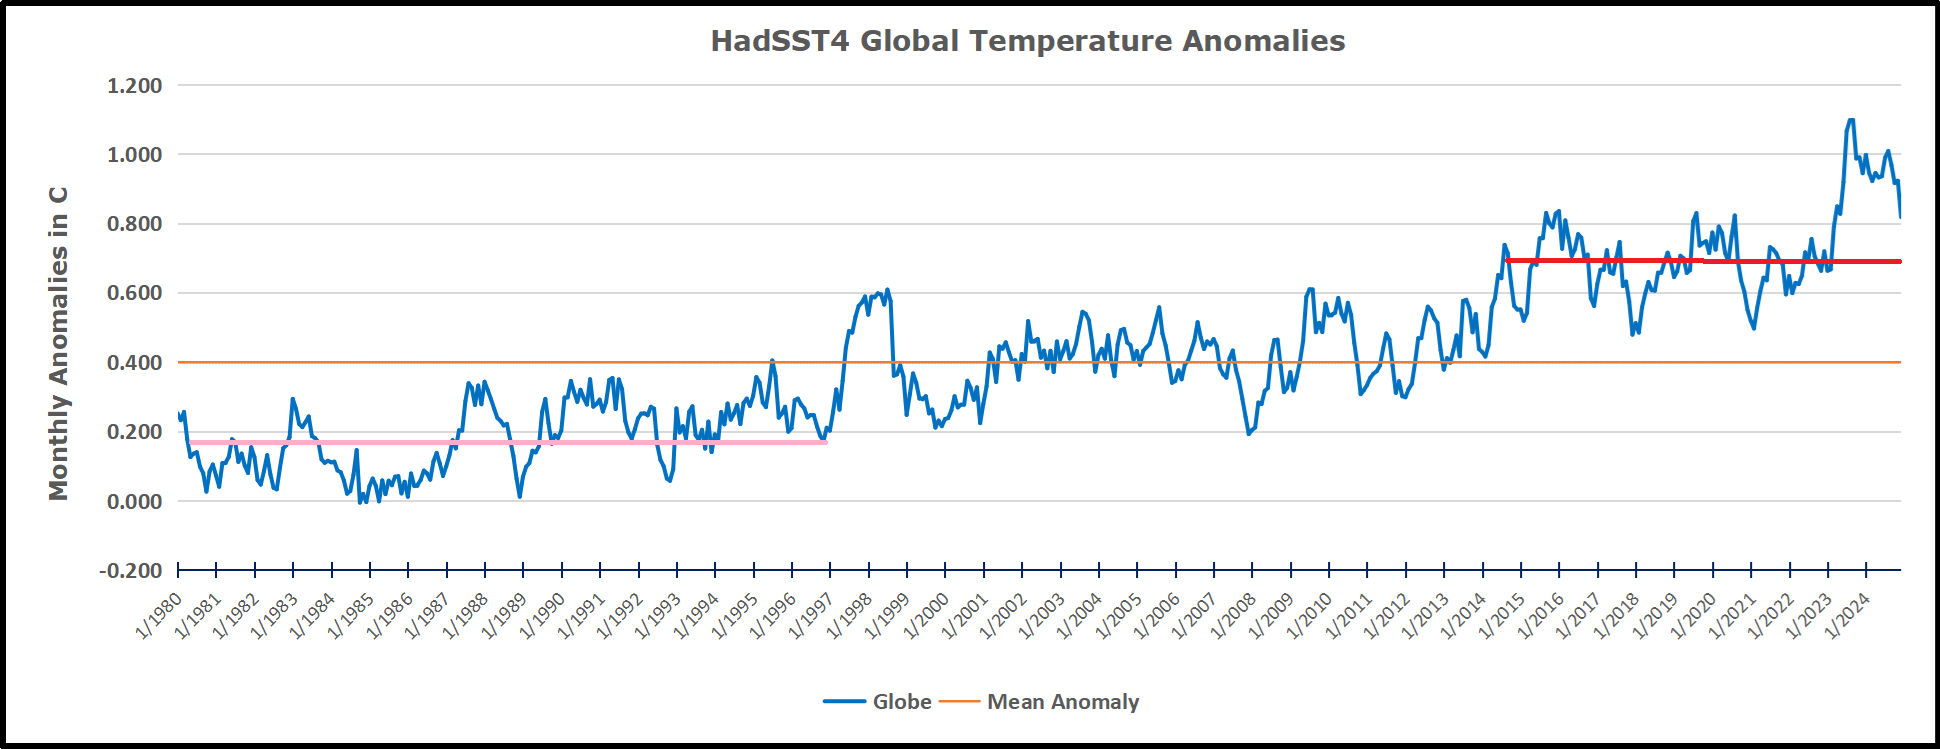
In addition, there is no mention that GCMs projections are running about twice as hot as observations. Omitted is the fact GCMs correctly replicate tropospheric temperature observations only when CO2 warming is turned off. In the effort to proclaim scientific certainty, neither Stiglitz nor IPCC discuss the lack of warming since the 1998 El Nino, despite two additional El Ninos in 2010 and 2016.

Figure 5. Simplification of IPCC AR5 shown above in Fig. 4. The colored lines represent the range of results for the models and observations. The trends here represent trends at different levels of the tropical atmosphere from the surface up to 50,000 ft. The gray lines are the bounds for the range of observations, the blue for the range of IPCC model results without extra GHGs and the red for IPCC model results with extra GHGs.The key point displayed is the lack of overlap between the GHG model results (red) and the observations (gray). The nonGHG model runs (blue) overlap the observations almost completely.

Further they exclude comparisons between fossil fuel consumption and temperature changes. The legal methodology for discerning causation regarding work environments or medicine side effects insists that the correlation be strong and consistent over time, and there be no confounding additional factors. As long as there is another equally or more likely explanation for a set of facts, the claimed causation is unproven. Such is the null hypothesis in legal terms: Things happen for many reasons unless you can prove one reason is dominant.

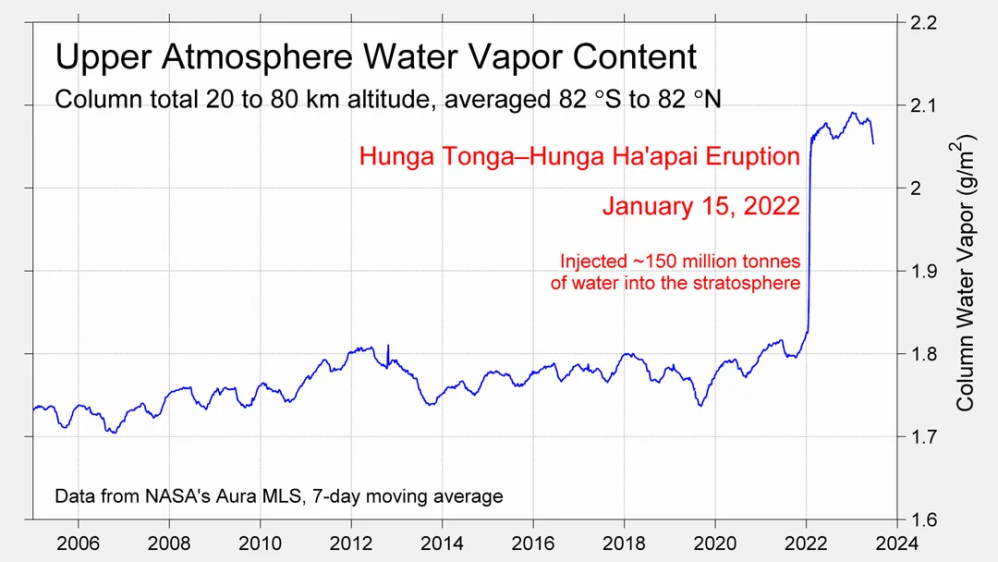
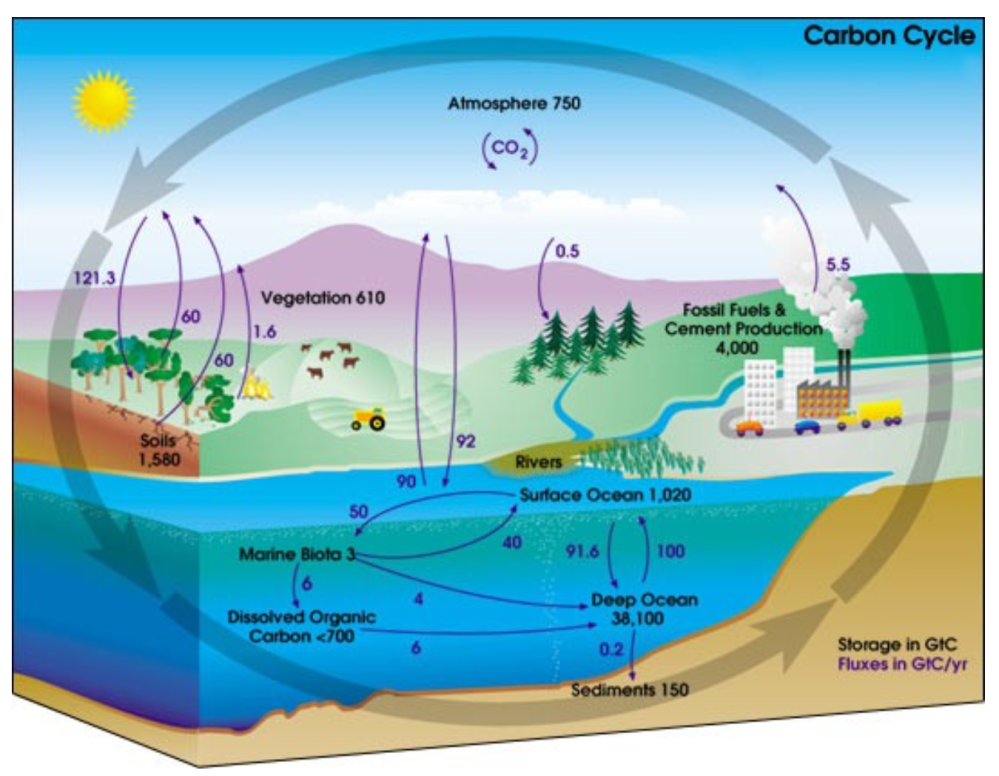
Finally, Stiglitz and IPCC are picking on the wrong molecule. The climate is controlled not by CO2 but by H20. Oceans make climate through the massive movement of energy involved in water’s phase changes from solid to liquid to gas and back again. From those heat transfers come all that we call weather and climate: Clouds, Snow, Rain, Winds, and Storms.

Esteemed climate scientist Richard Lindzen ended a very fine recent presentation with this description of the climate system:

I haven’t spent much time on the details of the science, but there is one thing that should spark skepticism in any intelligent reader. The system we are looking at consists in two turbulent fluids interacting with each other. They are on a rotating planet that is differentially heated by the sun. A vital constituent of the atmospheric component is water in the liquid, solid and vapor phases, and the changes in phase have vast energetic ramifications. The energy budget of this system involves the absorption and reemission of about 200 watts per square meter. Doubling CO2 involves a 2% perturbation to this budget. So do minor changes in clouds and other features, and such changes are common. In this complex multifactor system, what is the likelihood of the climate (which, itself, consists in many variables and not just globally averaged temperature anomaly) is controlled by this 2% perturbation in a single variable? Believing this is pretty close to believing in magic. Instead, you are told that it is believing in ‘science.’ Such a claim should be a tip-off that something is amiss. After all, science is a mode of inquiry rather than a belief structure.

Supposition 2: The Warming is Dangerous

Billions of dollars have been spent researching any and all negative effects from a warming world: Everything from Acne to Zika virus. Stiglitz links to a recent Climate Report that repeats the usual litany of calamities to be feared and avoided by submitting to IPCC demands. The evidence does not support these claims.

Stiglitz: It is scientifically established that human activities produce GHG emissions, which accumulate in the atmosphere and the oceans, resulting in warming of Earth’s surface and the oceans, acidification of the oceans, increased variability of climate, with a higher incidence of extreme weather events, and other changes in the climate.

Moreover, leading experts believe that there is already more than enough excess heat in the climate system to do severe damage and that 2C of warming would have very significant adverse effects, including resulting in multi-meter sea level rise.

Experts have observed an increased incidence of climate-related extreme weather events, including increased frequency and intensity of extreme heat and heavy precipitation events and more severe droughts and associated heatwaves. Experts have also observed an increased incidence of large forest fires; and reduced snowpack affecting water resources in the western U.S. The most recent National Climate Assessment projects these climate impacts will continue to worsen in the future as global temperatures increase.

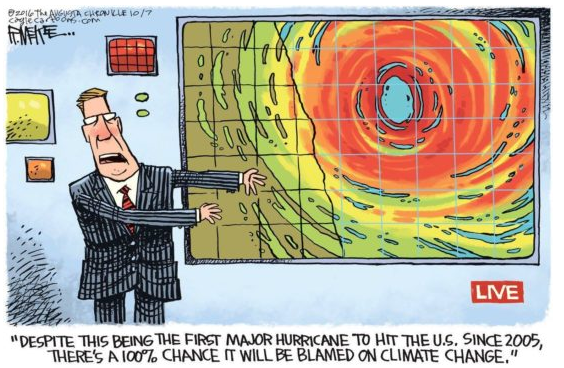
Alarming Weather and Wildfires

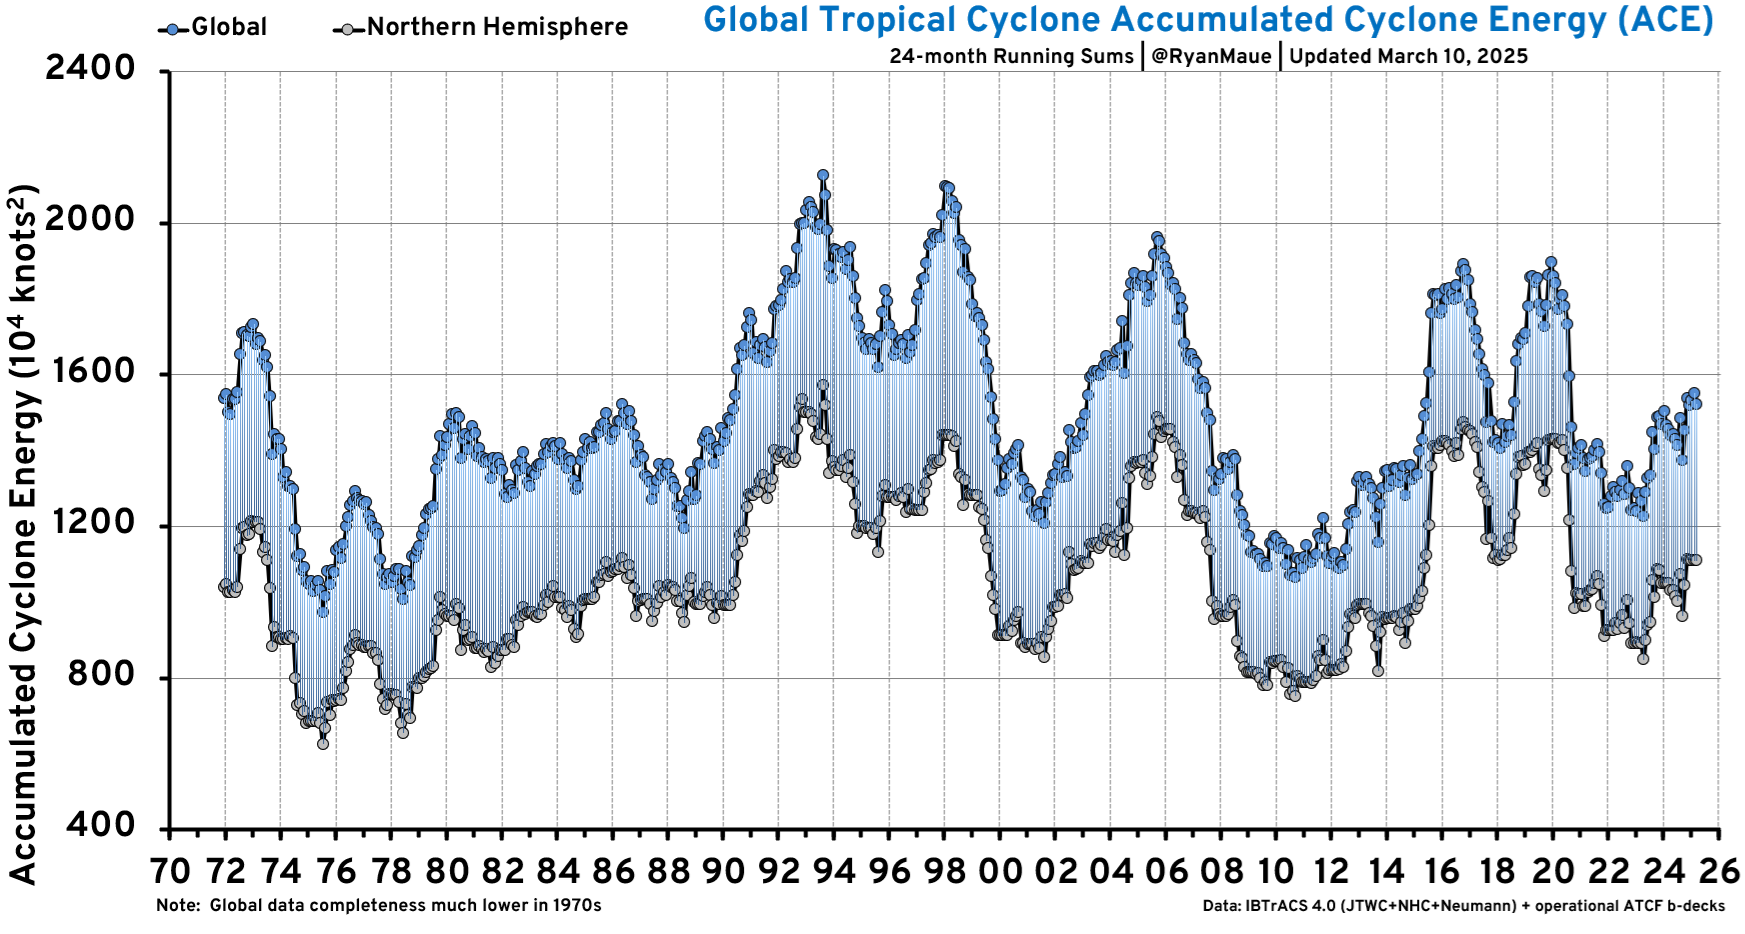
But: Weather is not more extreme.


And Wildfires were worse in the past.
But: Sea Level Rise is not accelerating.
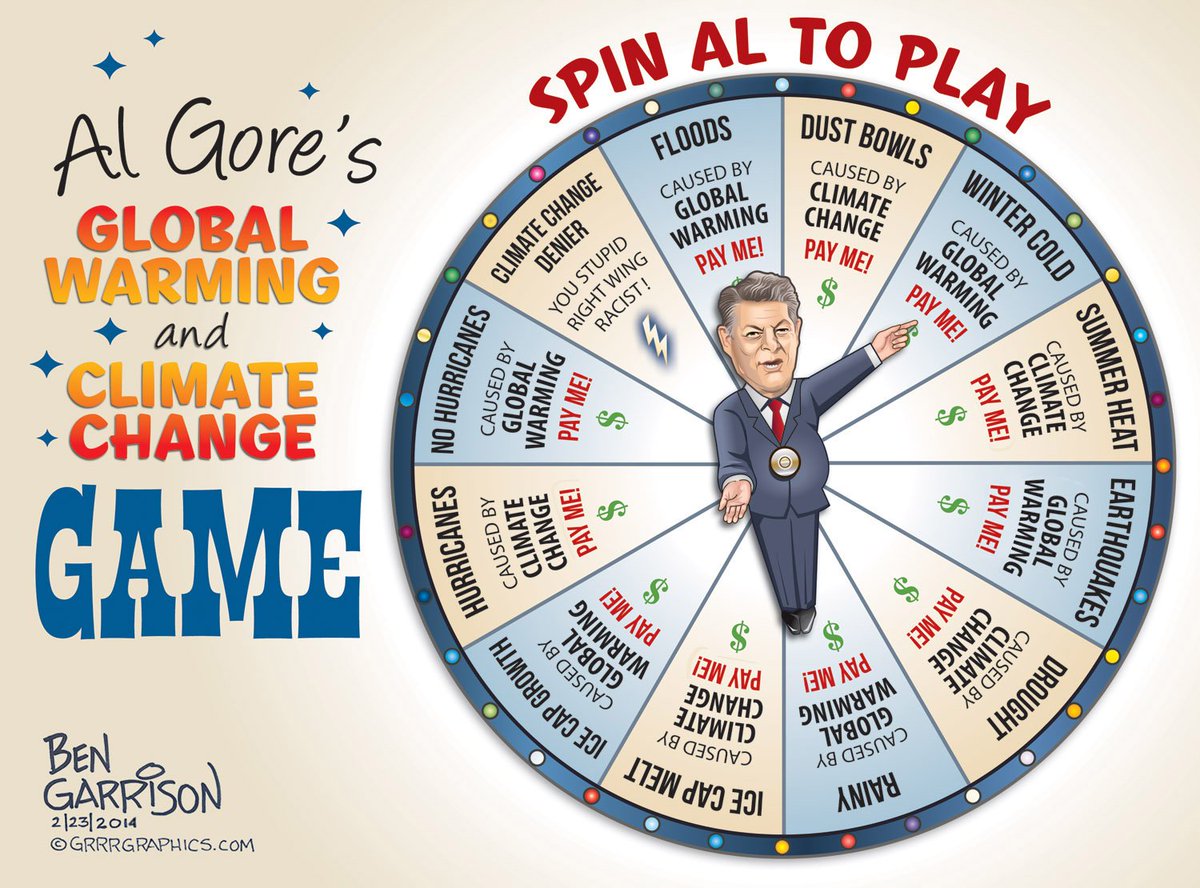
Litany of Changes

Seven of the ten hottest years on record have occurred within the last decade; wildfires are at an all-time high, while Arctic Sea ice is rapidly diminishing.

We are seeing one-in-a-thousand-year floods with astonishing frequency.

When it rains really hard, it’s harder than ever.

We’re seeing glaciers melting, sea level rising.

The length and the intensity of heatwaves has gone up dramatically.

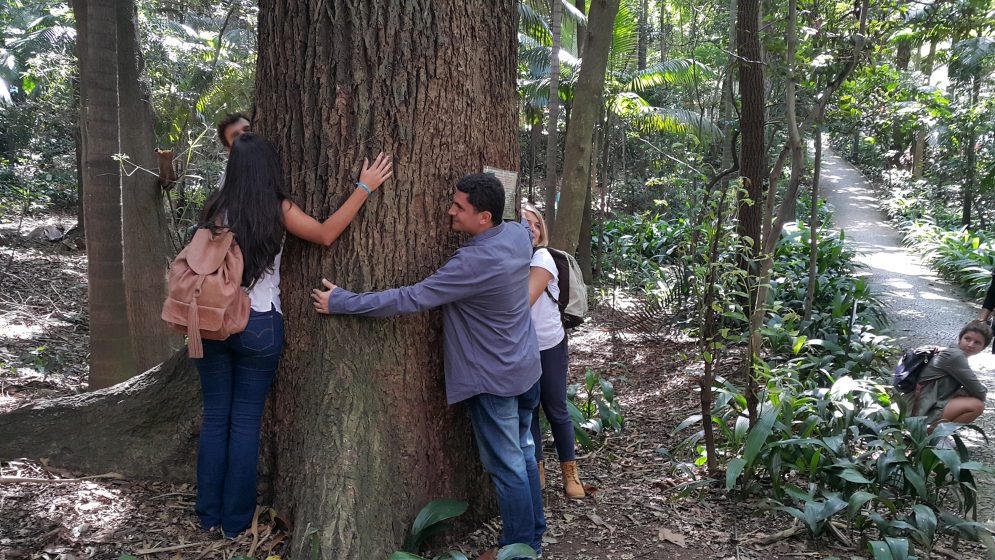
Plants and trees are flowering earlier in the year. Birds are moving polewards.

We’re seeing more intense storms.

But: Arctic Ice has not declined since 2007.

But: All of these are within the range of past variability.

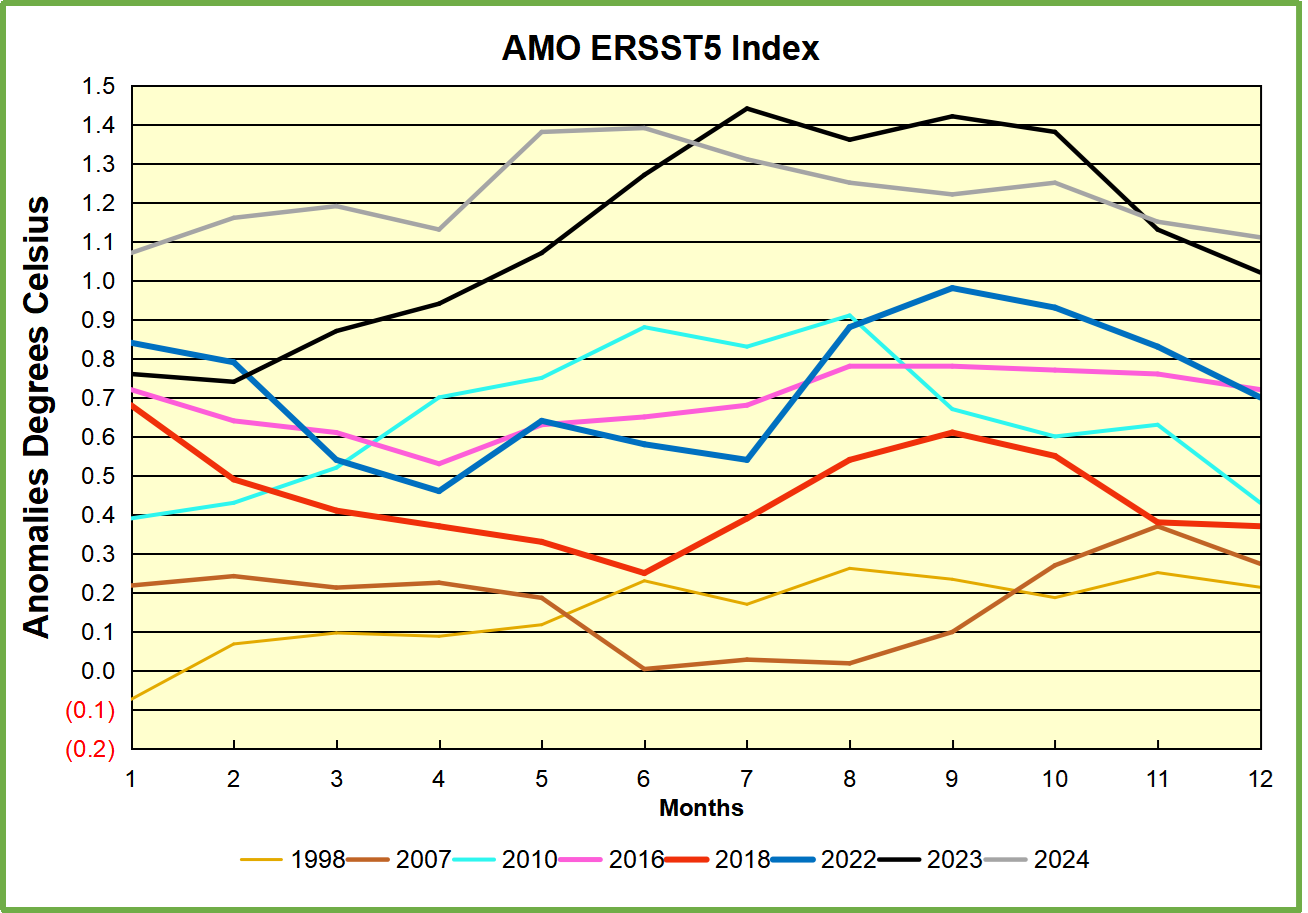
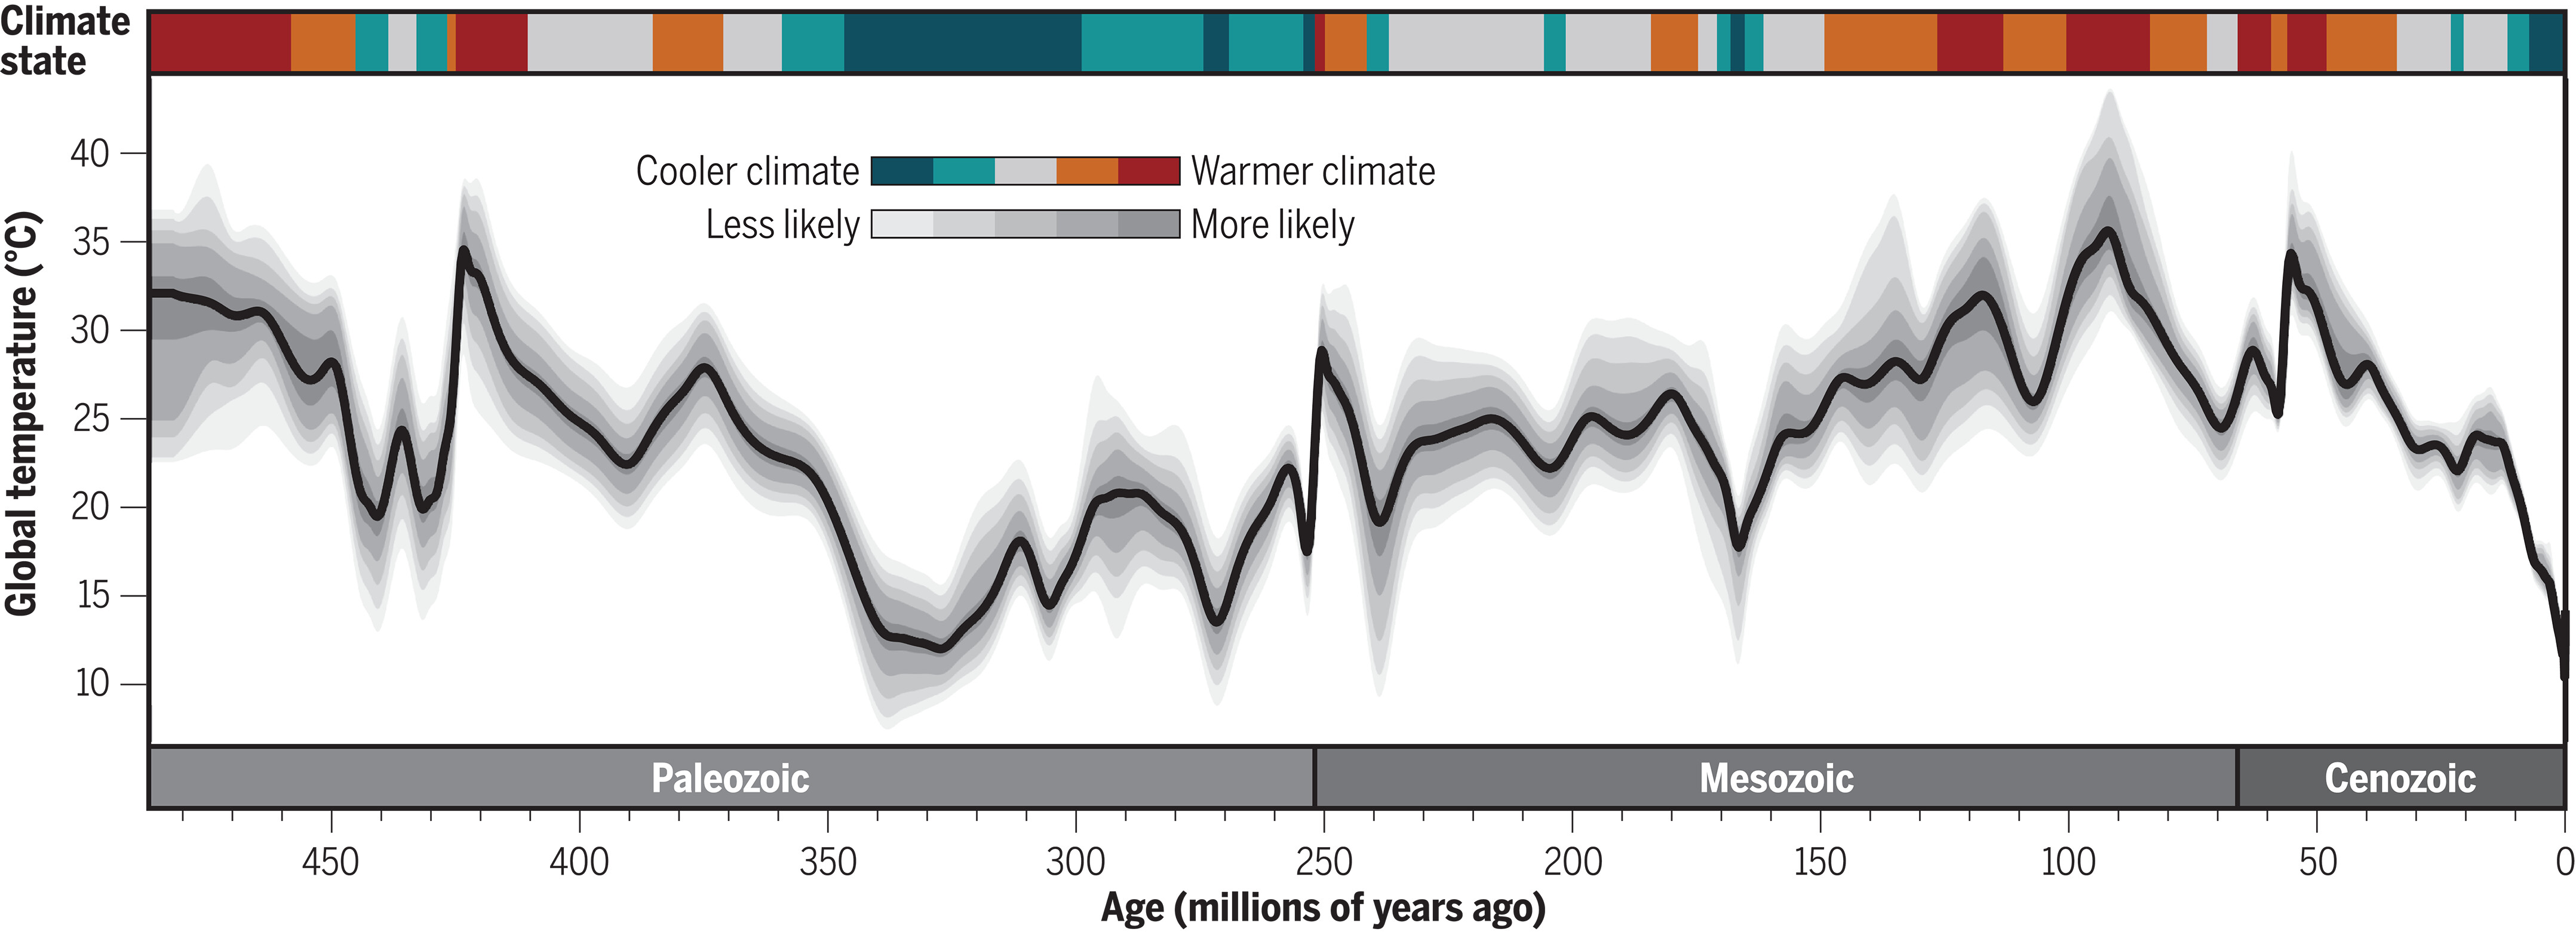
In fact our climate is remarkably stable.

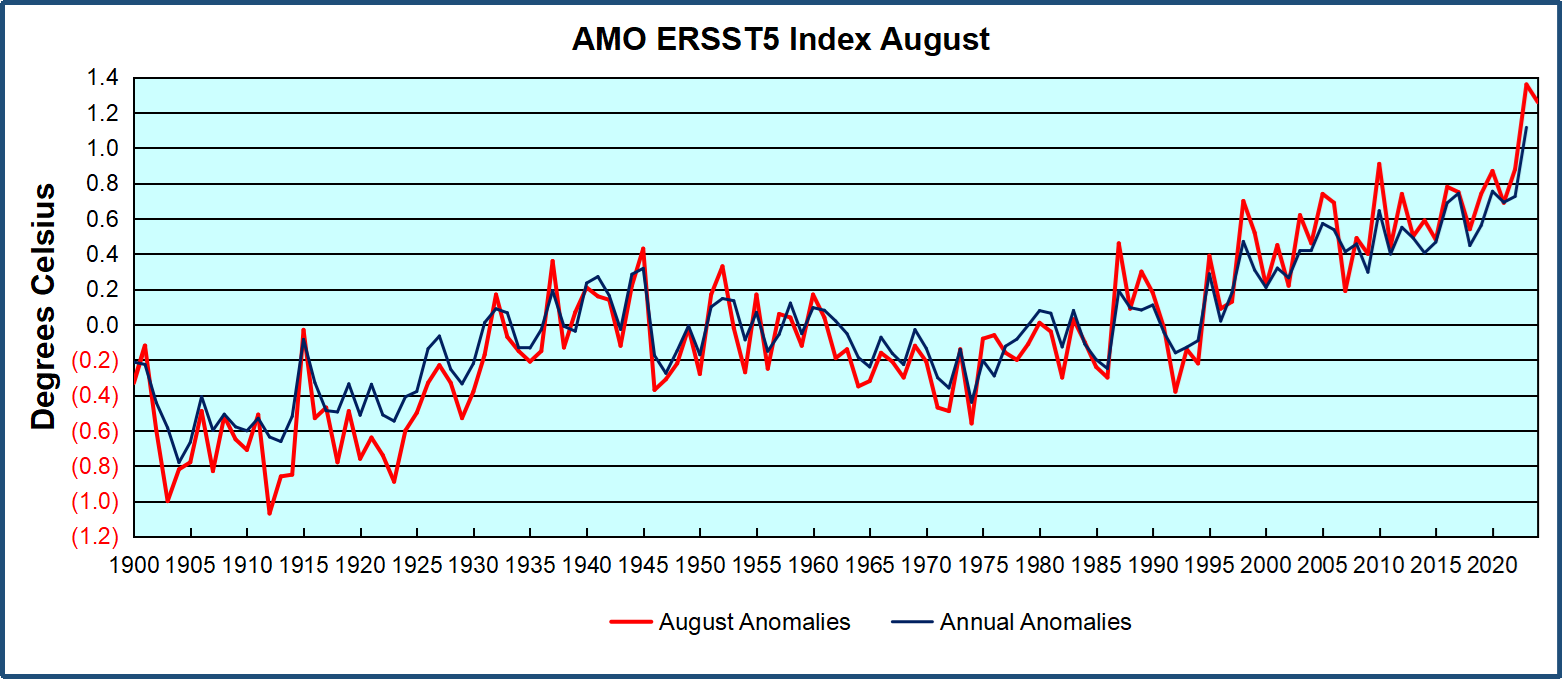
And many aspects follow quasi-60 year cycles.

Climate is Changing the Weather

Stiglitz:  Other potential examples include agricultural losses. Whether or not insurance
reimburses farmers for their crops, there can be food shortages that lead to higher food
prices (that will be borne by consumers, that is, Youth Plaintiffs and Affected Children).
There is a further risk that as our climate and land use pattern changes, disease vectors
may also move (e.g., diseases formerly only in tropical climates move northward).36 This
could lead to material increases in public health costs

But: Actual climate zones are local and regional in scope, and they show little boundary change.

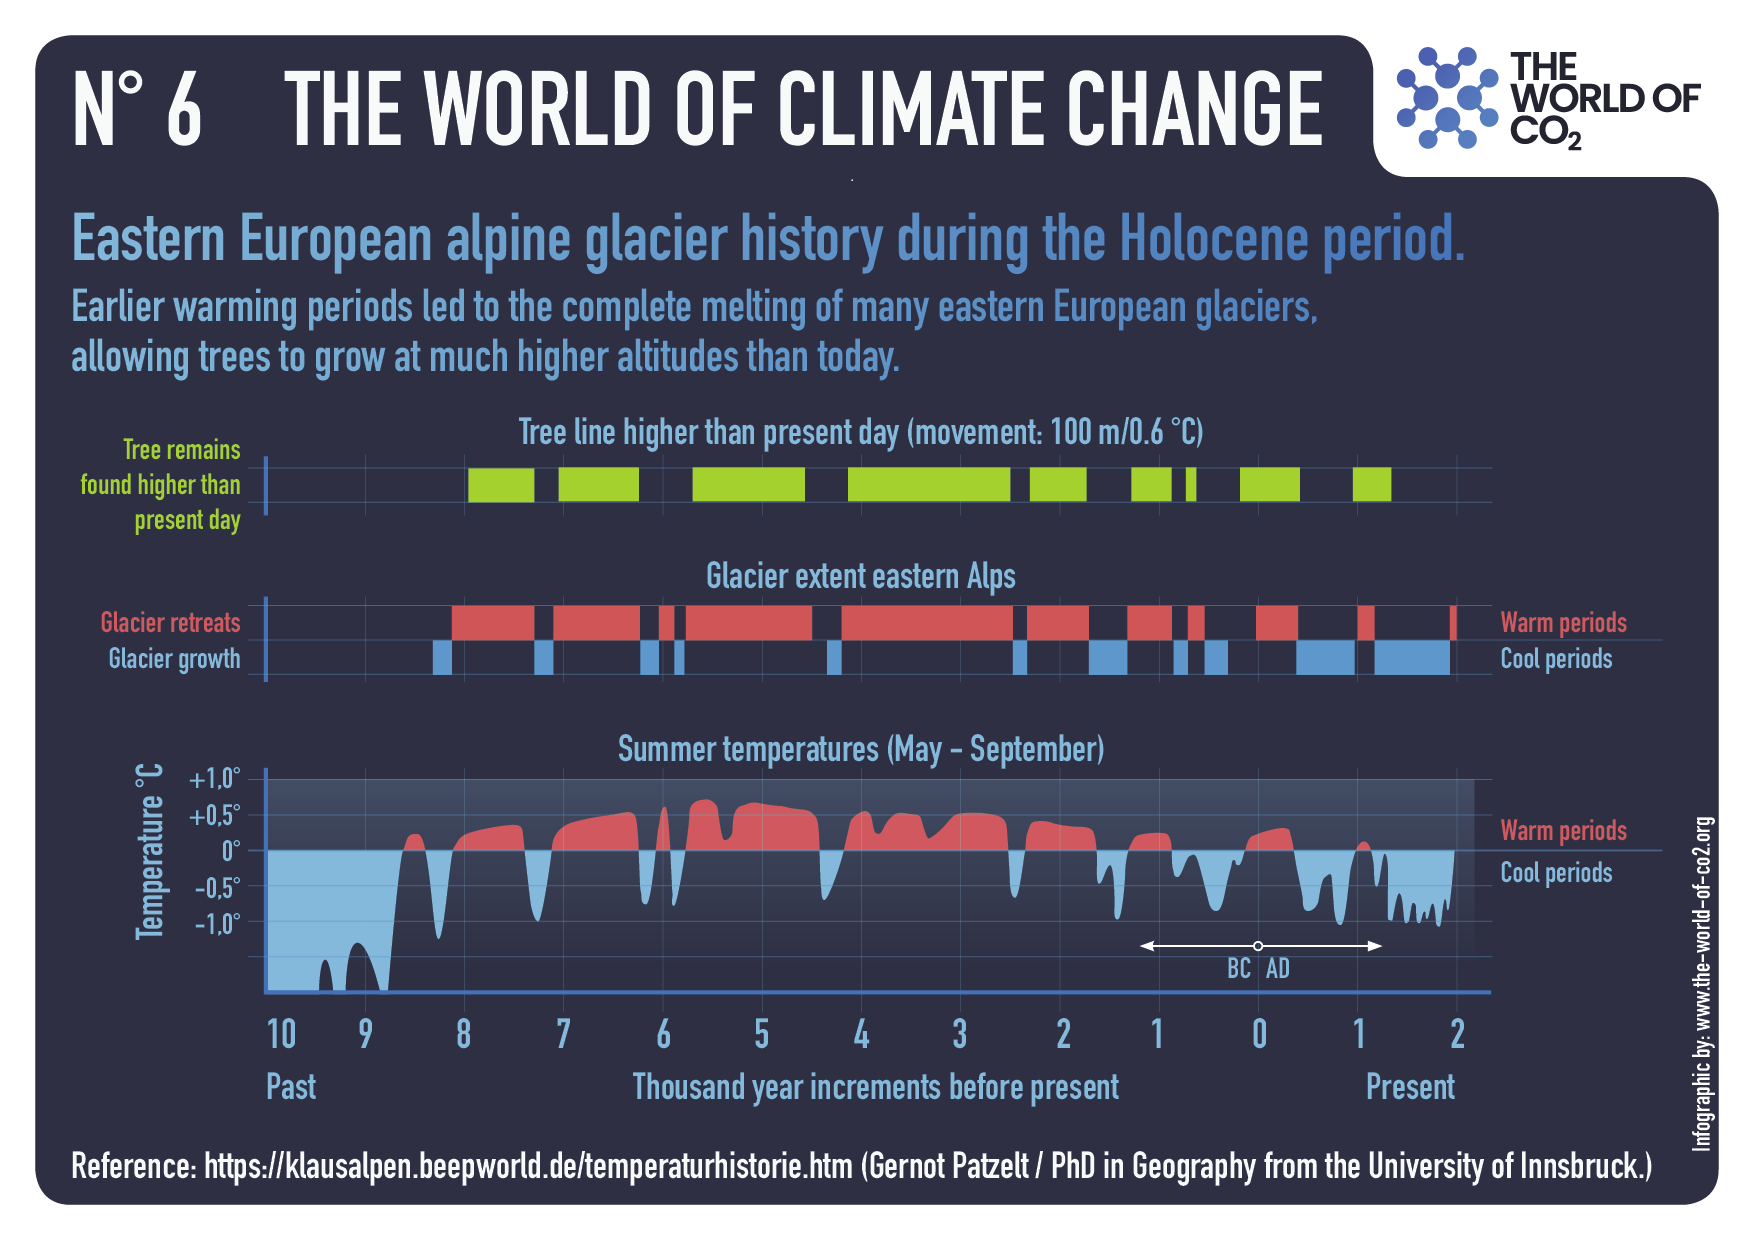
But: Ice cores show that it was warmer in the past, not due to humans.

Supposition 3:  Government Can Stop it!

Here it is blithely assumed that the court can rule the seas to stop rising, heat waves to cease, and Arctic ice to grow (though why we would want that is debatable).  All this will be achieved by leaving fossil fuels in the ground and powering civilization with windmills and solar panels.  While admitting that our way of life depends on fossil fuels, they ignore the inadequacy of renewable energy sources at their present immaturity.

Stiglitz: Conclusion
The choice between incurring manageable costs now and the incalculable, perhaps even
irreparable, burden Youth Plaintiffs and Affected Children will face if Defendants fail to
rapidly transition to a non-fossil fuel economy is clear. While the full costs of the climate
damages that would result from maintaining a fossil fuel-based economy may be
incalculable, there is already ample evidence concerning the lower bound of such costs,
and with these minimum estimates, it is already clear that the cost of transitioning to a
low/no carbon economy are far less than the benefits of such a transition. No rational
calculus could come to an alternative conclusion. Defendants must act with all deliberate
speed and immediately cease the subsidization of fossil fuels and any new fossil fuel
projects, and implement policies to rapidly transition the U.S. economy away from fossil
fuels.

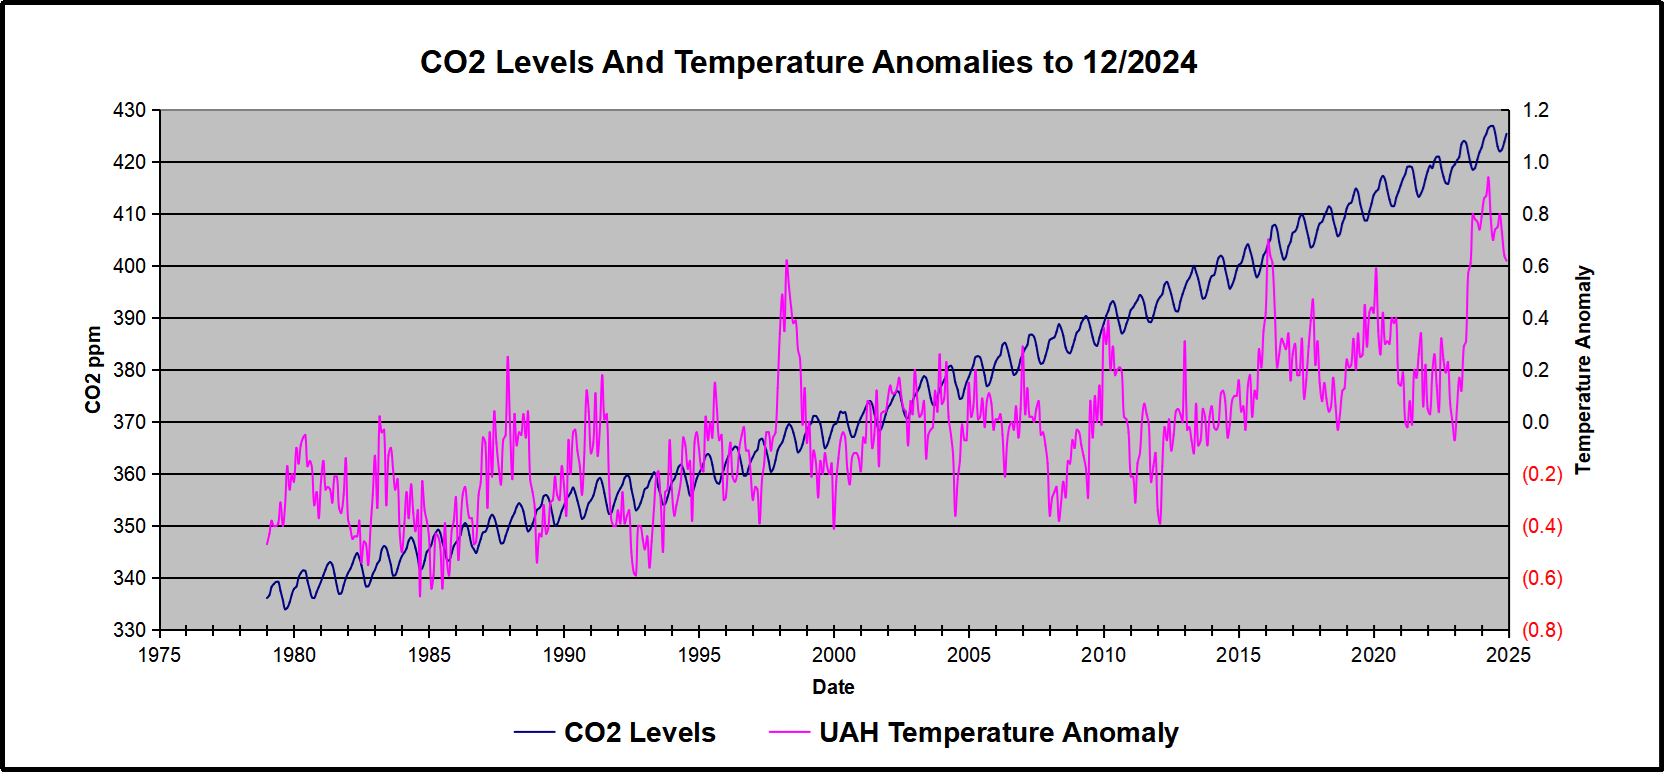
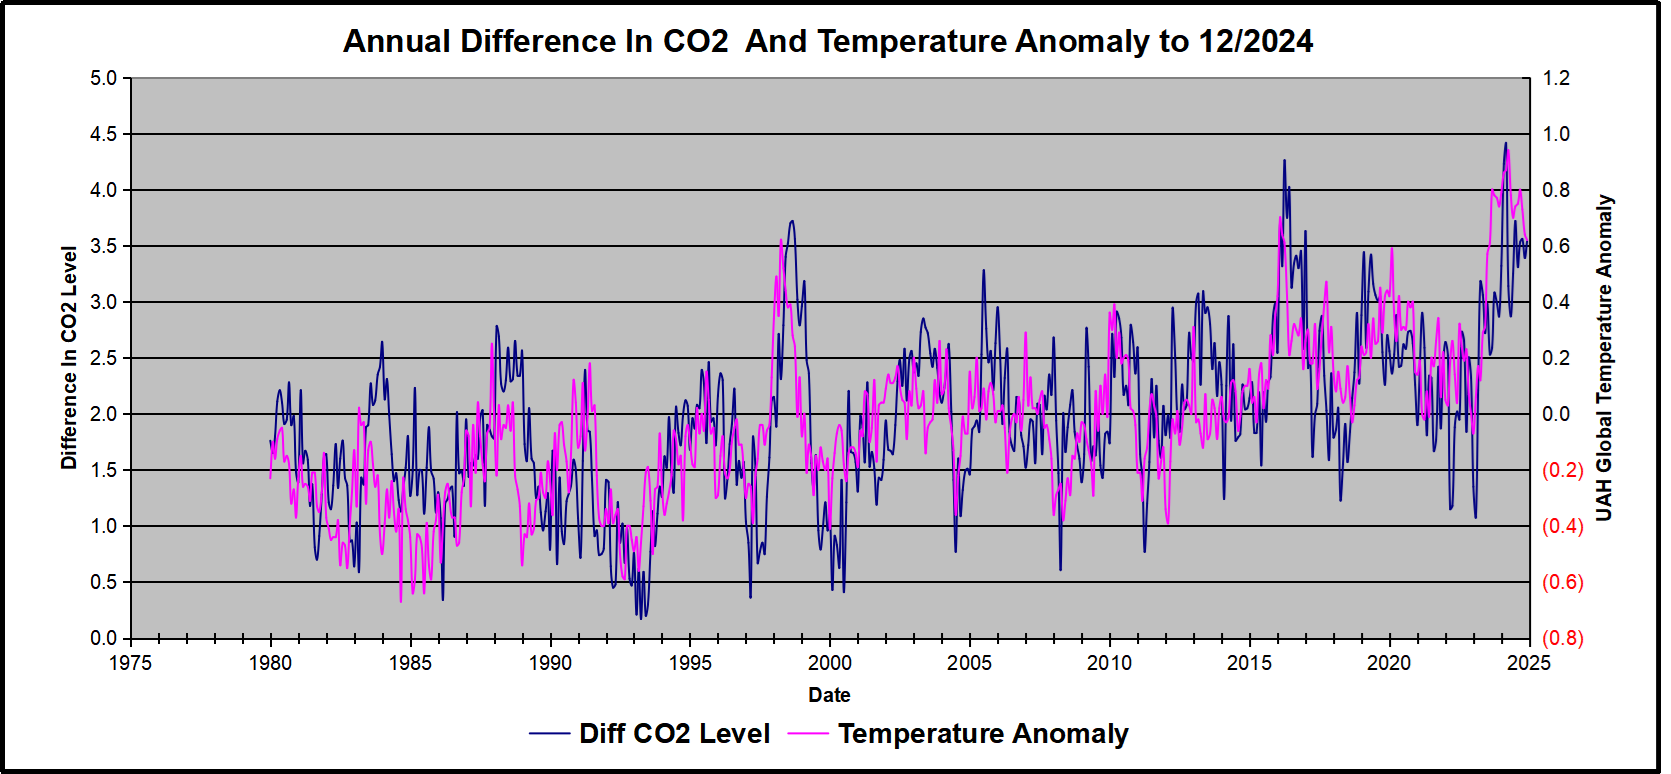
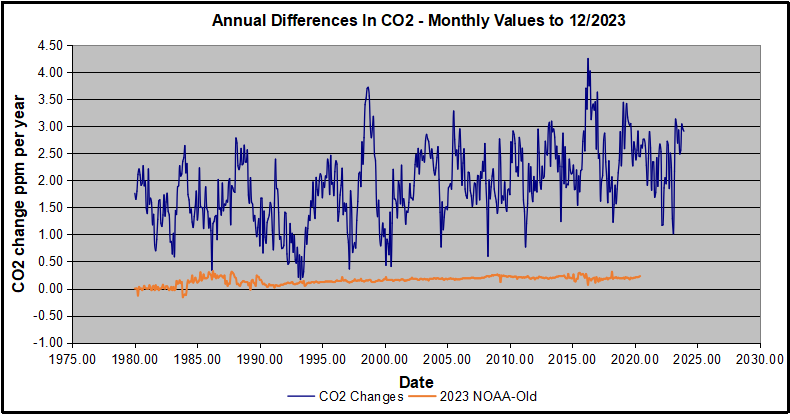
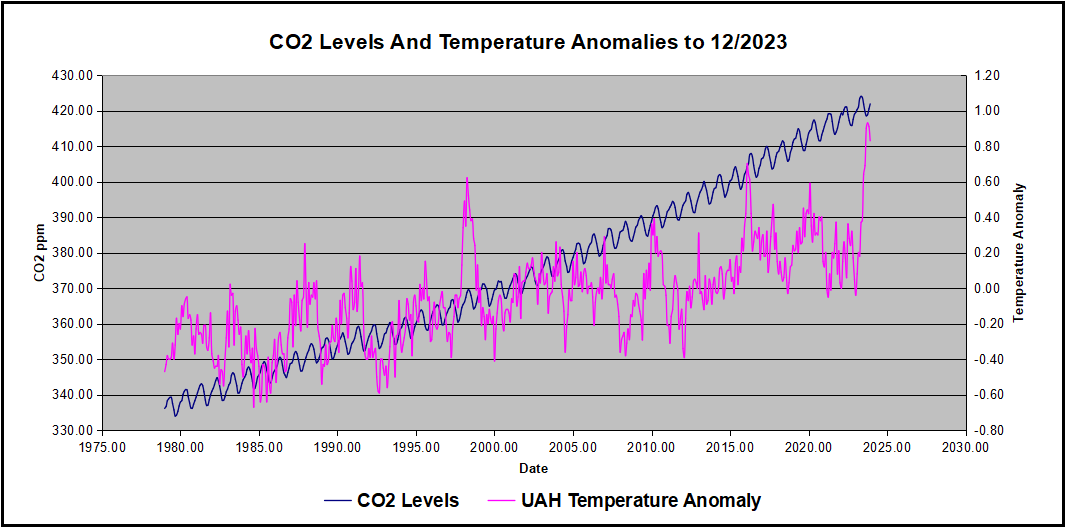
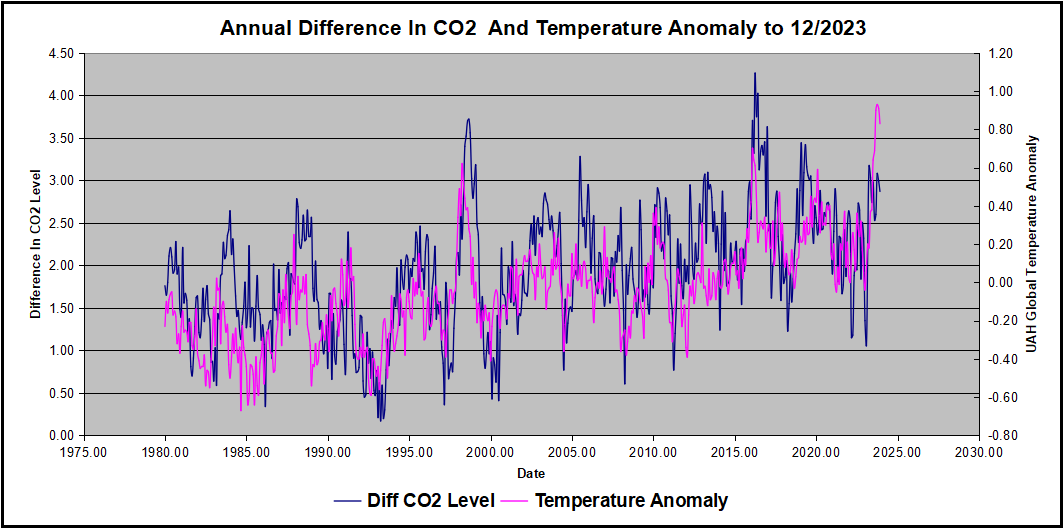
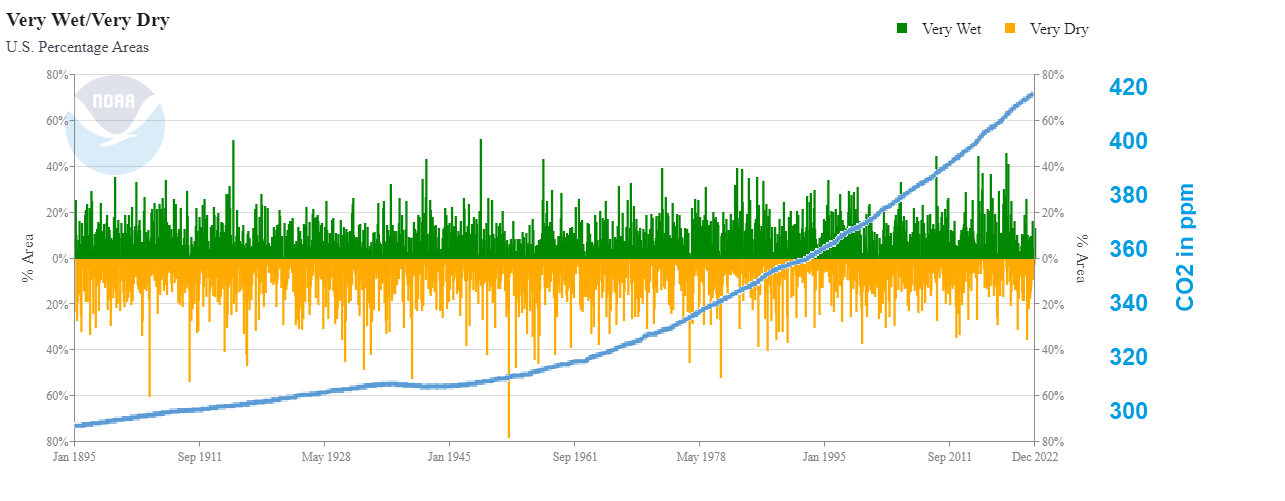
But CO2 relation to Temperature is Inconsistent.

But: The planet is greener because of rising CO2.

But: Modern nations (G20) depend on fossil fuels for nearly 90% of their energy.

But: Renewables are not ready for prime time.

People need to know that adding renewables to an electrical grid presents both technical and economic challenges.  Experience shows that adding intermittent power more than 10% of the baseload makes precarious the reliability of the supply.  South Australia is demonstrating this with a series of blackouts when the grid cannot be balanced.  Germany got to a higher % by dumping its excess renewable generation onto neighboring countries until the EU finally woke up and stopped them. Texas got up to 29% by dumping onto neighboring states, and some like Georgia are having problems.

But more dangerous is the way renewables destroy the economics of electrical power.  Seasoned energy analyst Gail Tverberg writes:

In fact, I have come to the rather astounding conclusion that even if wind turbines and solar PV could be built at zero cost, it would not make sense to continue to add them to the electric grid in the absence of very much better and cheaper electricity storage than we have today. There are too many costs outside building the devices themselves. It is these secondary costs that are problematic. Also, the presence of intermittent electricity disrupts competitive prices, leading to electricity prices that are far too low for other electricity providers, including those providing electricity using nuclear or natural gas. The tiny contribution of wind and solar to grid electricity cannot make up for the loss of more traditional electricity sources due to low prices.

These issues are discussed in more detail in the post Climateers Tilting at Windmills

Footnote regarding mention of “multi-meter” sea level rise.  It is all done with computer models.  For example, below is San Francisco.  More at USCS Warnings of Coastal Floodings


Scientific Societies Misstate “Climate Change”

Wallace Manheimer provides examples of the errors needing corrections in his American Thinker article Scientific Societies Err on ‘Climate Change’.  Excerpts in italics with my bolds and added images.

Major scientific organizations’ statements on “climate change” and the conclusions therein form the basis of much of the scientific foundation for governmental, scientific, media, and public concerns on the use of fossil fuels. Trillions of public and private dollars are currently being spent on alternative fuels to “save the planet” from the alleged harm of increasing CO2, a gas which is vital for life on earth. If the evaluations of these societies are erroneous, these measures could impoverish much of the world, to say nothing of wasting trillions. Economic damage and social unrest are already evident in some countries, including the United States.

It is therefore imperative for all that their views be based on sound science,
and if not, these societies should change their statements.

A recent publication and podcast have examined the scientific organization’s climate statements, and have found numerous errors, errors which are easy to find by simply comparing the societies’ statements with data from such reliable sources as NOAA, NASA, and others. These societies are:

♦  American Physical Society (APS),
♦  American Meteorological Society (AMS),
♦  National Academy of Science (NAS),
♦  American Chemical Society (ACS), and
♦  American Geophysical Union (AGU).    

[Manheimer refers to paper Science Societies Climate Statements: Some Concerns]

Here is one example. The AGU states “Greater CO2 concentrations in the atmosphere are also affecting the growth and nutritional value of land plants…” Numerous studies, including measurements of terrestrial plant life from space, and measurements of crop production, have shown that if anything, increasing CO2 has increased both plant life and crop production. After all, CO2 is a vital nutrient for plants, and the slight warming we have experienced, possibly in part due to the increased CO2, has increased the growing seasons in the temperate latitudes.

As another example, the ACS statement asserts: “Extreme weather and related events, such as floods, droughts… are increasing in frequency and intensity, threatening Americans’ physical, social, and economic well-being.”. The frequency and intensity of floods and droughts is measured by what is called NOAA’s Palmer drought index and this index is displayed as a graph vs of index versus year. It shows clearly, that in the United States the worst sustained droughts in the U.S. were in the 1930s and 1950s, and the worst sustained floods were in the 1970s through the 1990s.

Tens of thousands of scientists, including over 10,000 with Ph.Ds., have critically examined the evidence, and have concluded that a CO2-induced climate crisis is extremely unlikely. They have willingly and publicly asserted this, by adding their names to document such as, the Oregon petition, Clintel Climate Petition , and the CO2 Coalition. Among other things, the societies should not ignore these, professional conclusions of many of their members.

Accordingly, and with humility, I suggest that these societies do the following:

  1.  Replace their climate statements with ones that say there is most likely an effect humans have on the changing climate, but its importance for humanity is uncertain and it is still being debated.
  2.   Eliminate statements that are demonstrably incorrect, as shown by comparison with easily available and reliable data.
  3. Acknowledge in their statements that fossil fuels cannot be replaced in the next several decades without greatly endangering our civilization.
  4. Acknowledge in their statements that CO2 has obvious obvious benefit for human existence, as well as potential risks.

By changing their statements to ones that are more moderate and scientifically correct, these societies will not only be helping the professions they serve, but more important, will ultimately be aiding humanity. On the other hand, if they keep their statements as they are, they will remain on the wrong side of history, and posterity will not look kindly on them. And posterity may be arriving sooner than they think. With a Republican Congress and President Trump referring to the “green new scam,” these society presidents may find themselves hauled before Congress to receive the university president treatment.

After all, the APS statement says, “Multiple lines of evidence strongly support the finding that anthropogenic greenhouse gases have become the dominant driver of global climate warming observed since the mid-twentieth century.”

    • What will its president say when the congressman puts up a graph showing that for 30 years in the early decades of the 20th century, the warming rate was the same or greater?
    • Or when he puts up a map proving that the northern forests, 4000 years ago extended about 200 miles further north worldwide than they do today.
    • Or shows that 2000 years ago, the Romans had vineyards in England extending all the way to Hadrian’s wall, millennia before cold weather grapes had been developed.
    • Or when he shows evidence that 1000 years ago the Vikings grew barley in Greenland, something not possible today. Surely this proves that the world had many warmer periods without the help of extra CO2 in the atmosphere.

There are many such statements that Congress can quote, to very publicly humiliate these society presidents. As a committed life fellow of the APS, I hope these societies will change their statements now, before the roof collapses on them.

Background from Richard Lindzen

The above described changes in scientific culture were both the cause and effect of the growth of ‘big science,’ and the concomitant rise in importance of large organizations. However, all such organizations, whether professional societies, research laboratories, advisory bodies (such as the national academies), government departments and agencies (including NASA, NOAA, EPA, NSF, etc.), and even universities are hierarchical structures where positions and policies are determined by small executive councils or even single individuals. This greatly facilitates any conscious effort to politicize science via influence in such bodies where a handful of individuals (often not even scientists) speak on behalf of organizations that include thousands of scientists, and even enforce specific scientific positions and agendas. The temptation to politicize science is overwhelming and longstanding. Public trust in science has always been high, and political organizations have long sought to improve their own credibility by associating their goals with ‘science’ – even if this involves misrepresenting the science.

Professional societies represent a somewhat special case. Originally created to provide a means for communication within professions – organizing meetings and publishing journals – they also provided, in some instances, professional certification, and public outreach. The central offices of such societies were scattered throughout the US, and rarely located in Washington. Increasingly, however, such societies require impressive presences in Washington where they engage in interactions with the federal government. Of course, the nominal interaction involves lobbying for special advantage, but increasingly, the interaction consists in issuing policy and scientific statements on behalf of the society. Such statements, however, hardly represent independent representation of membership positions. For example, the primary spokesman for the American Meteorological Society in Washington is Anthony Socci who is neither an elected official of the AMS nor a contributor to climate science. Rather, he is a former staffer for Al Gore.

Returning to the matter of scientific organizations, we find a variety of patterns of influence. The most obvious to recognize (though frequently kept from public view), consists in prominent individuals within the environmental movement simultaneously holding and using influential positions within the scientific organization. Thus, John Firor long served as administrative director of the National Center for Atmospheric Research in Boulder, Colorado. This position was purely administrative, and Firor did not claim any scientific credentials in the atmospheric sciences at the time I was on the staff of NCAR. However, I noticed that beginning in the 1980’s, Firor was frequently speaking on the dangers of global warming as an expert from NCAR. When Firor died last November, his obituary noted that he had also been Board Chairman at Environmental Defense– a major environmental advocacy group – from 1975-1980 [5].

One could go on at some length with such examples, but a more common form of infiltration consists in simply getting a couple of seats on the council of an organization (or on the advisory panels of government agencies). This is sufficient to veto any statements or decisions that they are opposed to. Eventually, this enables the production of statements supporting their position – if only as a quid pro quo for permitting other business to get done. Sometimes, as in the production of the 1993 report of the NAS, Policy Implications of Global Warming, the environmental activists, having largely gotten their way in the preparation of the report where they were strongly represented as ‘stake holders,’ decided, nonetheless, to issue a minority statement suggesting that the NAS report had not gone ‘far enough.’ The influence of the environmental movement has effectively made support for global warming, not only a core element of political correctness, but also a requirement for the numerous prizes and awards given to scientists. That said, when it comes to professional societies, there is often no need at all for overt infiltration since issues like global warming have become a part of both political correctness and (in the US) partisan politics, and there will usually be council members who are committed in this manner.

Source:  Climate Science: Is it Currently Designed to Answer Questions?

Comment: These bodies all claim to serve society, which as American institutions should primarily be concerned about American society.  Funded by American taxpayers and donors, they should consider first and foremost their own country’s needs.  That means stopping the fuzzy logic and blurring the truth about weather and climate.  Otherwise they must fade into irrelevance.

And they must stop promoting the interests of a few colleagues at the expense of the many ordinary citizens.


L.A.’s Self-induced Fires Seen From the Ground

E.M. Smith provides a resident-level view of the California Calamity at his Chiefio blog Los Angeles Burning & Did It To Themselves.  Excerpts in italics with my bolds and added images.

Check The News – L.A. Is On Fire

Yes, it is a disaster. Yes, $Billions of real estate going up in flames. Yes, “Stars” Losing everything; and normies too. No, it is not due to Global Warming. This is January and seasonal cool swamps any 1.5 C change.

It looks like not just Malibu, but several places all around Los Angeles, the hills, Hollywood, and more are having major fire problems.

Houses built too close together, using flammable materials. Trees and
shrubs that are flammable too. Then the Santa Ana Winds kick in.

Fire is an absolutely normal aspect of the Southern California landscape. When the Santa Ana winds blow (down slope wind that heats up from compression and gets funneled into a narrower space, so very fast) any fire becomes a blow torch. By then, there is not much you can do. Prevention is what matters, so now we wait for the winds to die down.

One TV Video showed a multi-lane major road, about 6 lanes across by the look of it. All abandoned cars. Folks trying to flee the fire, in a traffic jam, got out of their cars and ran. Firefighters had to take a bulldozer and push the cars off the road to make a lane for firetrucks.

This is the edge of insane.

So instead of mitigating fuel loads, assuring there are enough fire trucks, fire fighters, and water storage, Gavin Newsom & the L.A. area Mayors, were busy working on how to run for POTUS, and Get Trump, and assure the Unions donated a lot of money to Democrats. Hollywood “Names” were busy complaining about Republicans and having Panic Attacks about Global Warming instead of asking if their trees were Towering Infernos waiting to happen and replacing that Shake Roof with a metal one.

Distraction leads to destruction. They all knew they lived in a fire zone. PSAs have been running about it my whole life in California (at least 65 years). They chose parties with All The Right People over Prudent Planning and preparation. They chose “self actualization” over Situational Awareness and adaptation (and hard work).   Now comes the consequences.

In Conclusion

BUT, fire awareness and risk has been true the entire life of California. Either you learn to mitigate fuel, provide for rapid and effective fire suppression, and harden you house against fire; or you burn. Has always been that way. Will be too.

Folks have known for generations how to harden, mitigate, and adapt. Have houses separated from each other by enough space that one can not start the next one on fire. Build with non-flammable materials (cinder block, concrete, stucco over wire with metal 2×4 studs, tile or metal roofs, and metal shutters to prevent IR ignition of drapes inside windows (or even fiberglass drapes). Install water sprinkler fire suppression systems. DO NOT PLANT FLAMMABLE TREES, BUSHES & GRASS around houses. Have wide firebreaks between buildings. And more.

Remaining trees and vegetation on the forest floor are more vigorous after removal of small trees for fuels reduction.

All of this has been known for 100 years.

But you get more houses built, so more money made, if you pack them 12 to an acre. Folks like the “look” of wood shake roofs, asphalt shingles are cheaper, nobody wants “stucco” anymore, but I LIKE eucalyptus! and on it goes.

Nobody wants to “damage the ecology” by taking out scrub and clearing forest liter. Paying for and planning large water sources, big pipes & pumps, and having all necessary equipment on standby for a decade (or two) “for that day” just seems wasteful; until you need it.

So call me hard-hearted. I grew up in Fire Country. I’ve fought grass fires and as a temporary Forest Fire Fighter climbed up and down hills with a Pulaski (axe hoe combo) on my shoulder, sleeping in a shredded newspaper stuffed sleeping bag for a weekend, working a fire. The home I grew up in had a metal roof. My present home has cinder block walls with stucco and faux brick over it. When this roof wears out in a few years, the replacement will be metal. I have hoses and nozzles ready to put out any sparks that blow in (old habits die hard…) Folks either prepare for fire, or they accept the consequences.

A feller buncher removing small trees that act as fuel ladders and transmit fire into the forest canopy.

So when the inevitable bleating and braying about Global Warming Oh Noes! and “More Fires!” starts: Just ask if they know how many of the homes had metal roofs & shutters and stucco over cinder block walls? How many homes had a 20 foot fire break of non-flammable area around them?

And answers came there none.

Democrats: You own this one 100% since you own ALL of California Government. You made all the building codes, water systems, fire departments, roads & infrastructure. Planned all of it. Permitted the “rack ’em, pack ’em & stack ’em” building permits. Made money off cheaper wood & asphalt shingle construction. Now you will reap the results.

Wyoming: Make Carbon Dioxide Great Again–No Net Zero

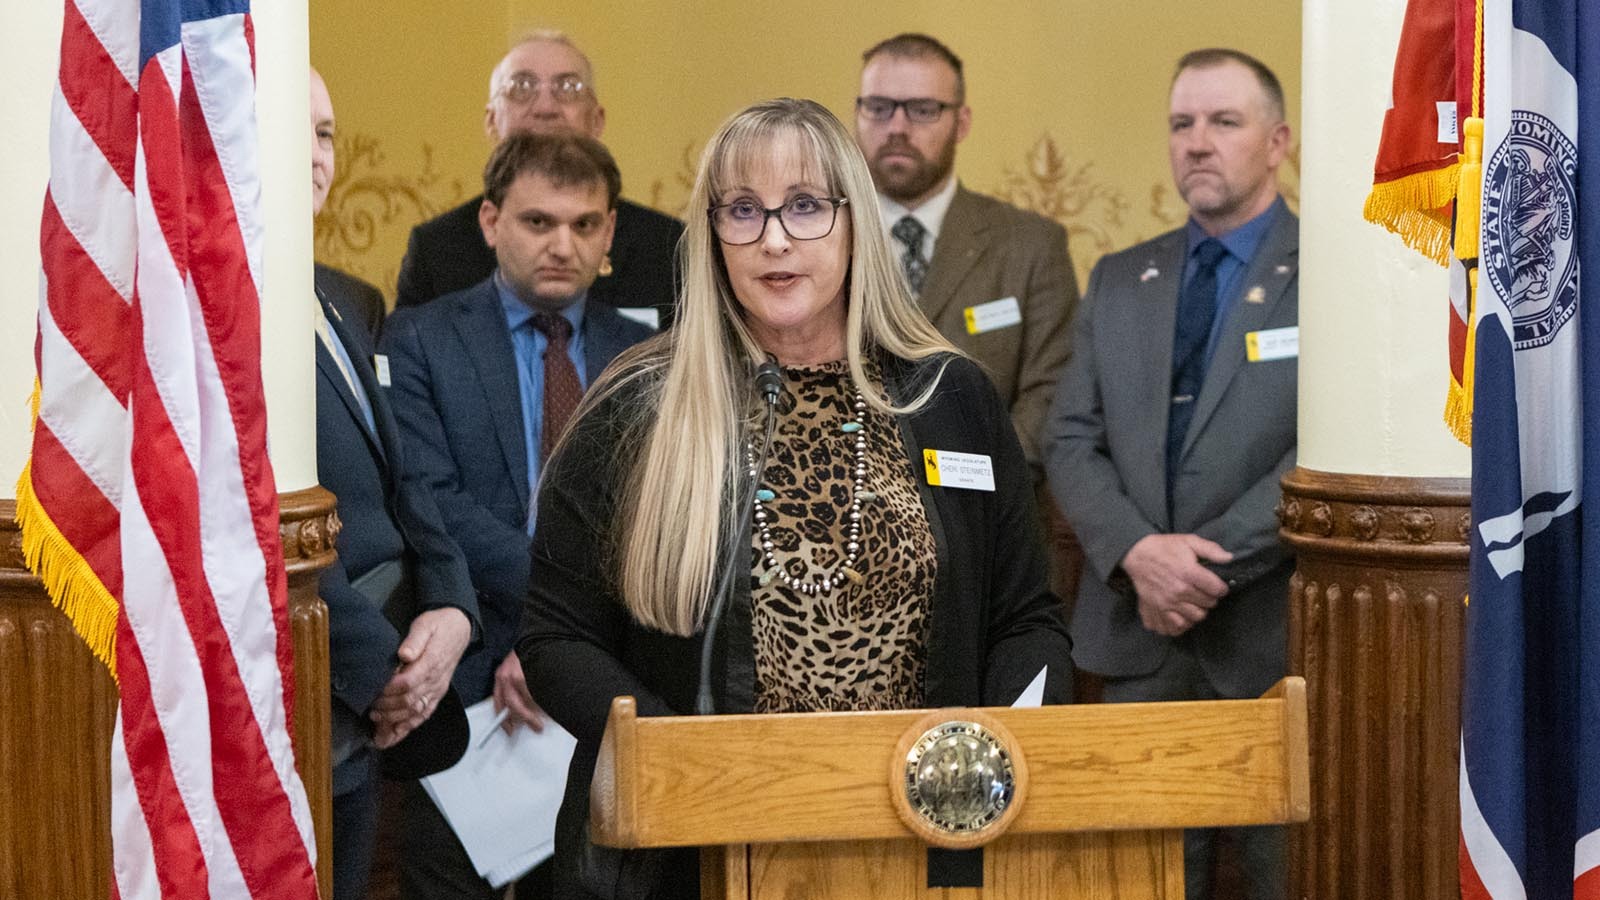
A bill is progressing through the Wyoming State Legislature, as described by the author in her op-ed Rethinking Carbon Dioxide – Wyoming’s Bold Move.  Excerpts in italics with my bolds and added images.

Torrington, WY (State Senator Cheri Steinmetz) January 7th, 2025 — The people of Wyoming have always believed in the value of questioning conventional wisdom, looking at the bigger picture and finding solutions that are possible and actually work. That’s the purpose of the bill titled “Make Carbon Dioxide Great Again”. This legislation is not about denying science, it is about applying science, thoroughly reevaluating the ‘climate change’ scientific assumptions and advocating for policies grounded in practicality, reality, and achievability – common sense.

Carbon dioxide (CO2) is vital to life on Earth.

Without it, plants could not grow, and without plants, no life would survive. Scientists and farmers alike recognize that higher CO2 levels improve agricultural productivity. Plants thrive with more CO2 – they grow faster, use water more efficiently, and are more resilient to drought. NASA’s own research shows that rising CO2 has contributed to a global “greening” effect, expanding vegetation and helping ecosystems flourish. CO2 is plant food!

Yet, despite its essential role in sustaining life,
CO2 has been demonized as a pollutant.

But what impact are human driven CO2 emissions actually capable of? We are contributing a very small part of the natural carbon cycle. Current CO2 levels are among the lowest Earth has seen over its long history. There were times in the past when ecosystems flourished under much higher CO2 concentrations. Instead of vilifying this essential gas, we should be acknowledging its role in our ecosystems and industries and protect the benefits it has in our lives.

Wyoming is uniquely positioned to lead this conversation.

Our state is vital to energy production, agriculture and food industries, transportation and energy reliability and stability. We understand the real-world importance of CO2. And we understand the benefits of CO2 used directly. Our industries already use it to enhance oil recovery, making energy production more efficient. This technology exemplifies what we are capable of when we treat CO2 as a resource rather than a liability.

The bill Make Carbon Dioxide Great Again shifts how we think about CO2.

It proposes that we stop treating the essential gas as a pollutant or contaminant. It requires a clear-eyed look at how policies aimed at eliminating CO2 emissions, such as decarbonizing the West, making Wyoming carbon negative or popular “net-zero” mandates. They may sound good on paper but often come with high economic costs and questionable environmental benefits, and clearly negative effects on our people and our industries.

Wyoming must refuse to jeopardize our economy and energy security
for initiatives that will yield – at best – questionable results.

Critics of “net-zero” strategies have highlighted the risks of pursuing policy goals without fully considering their consequences. These frequently require massive investments, disruption of reliable energy systems, and the forced undue burdens on families and businesses. Instead, Wyoming advocates for a balanced approach – one that evaluates the risks and possible rewards of any CO2 management plans that will safeguard our economic stability and way of life.

This approach challenges the status quo, and that is precisely the point. Now is the time to rethink how we talk about CO2 and climate change. This bill is not about ignoring environmental concerns; it is about addressing them with clear-eyed pragmatism and truth.

Wyoming is taking a bold step forward to lead a balanced, science-based dialogue. We all stand to benefit from this. Our energy sector, agriculture, transportation and all other industries, and even the broader environment, will gain when we use CO2 wisely.

This conversation is just beginning and must spark
a national debate about the fundamental role of CO2.

It is a debate we need to have – not just in Wyoming, with our own Governor and citizens – but across the nation and with all the organizations leading the charge to “net zero.” Let us challenge the assumptions, ask the hard questions, and make sure our policies truly serve the people, industry and the environment. After all, that is the Wyoming way.

Text of Wyoming Bill     SF0092  Make carbon dioxide great again-no net zero.

AN   ACT   relating to   environmental quality;   providing legislative findings;
specifying that carbon dioxide is not a pollutant and is a beneficial substance;
providing policy statements of the state associated with carbon dioxide;
repealing low-carbon energy standard requirements; repealing conflicting provisions;
making conforming amendments;  specifying applicability;
requiring reimbursement to utility customers as specified;
requiring rulemaking; and providing for an effective date.

Be It Enacted by the Legislature of the State of Wyoming:

Section 1.    W.S. 35-11-215 is created to read:

1             SF0092

35-11-215.     Carbon dioxide;   beneficial treatment; state policy.

(a)   The legislature finds that:

  (i)    Carbon dioxide is  a foundational nutrient necessary for all life on earth. Plants need carbon dioxide along with sunlight, water and nutrients to prosper. The more carbon dioxide available for this, the better life can  flourish;

  (ii)    The carbon cycle, where carbon dioxide is reused and transferred between the atmosphere and organisms on earth, is a biological necessity for life on earth;

  (iii)    Agricultural production worldwide is outpacing population growth and breaking production records primarily due to increasing atmospheric carbon dioxide;

  (iv)    More carbon dioxide allows plants to better resist drought by using water more efficiently;

  (v)     The national aeronautics and space administration has confirmed that global vegetation is increasing from the near-polar regions to the equator. The largest contributor to this greening of  the earth is increasing carbon dioxide;

  (vi)     Carbon dioxide levels are currently at approximately four hundred twenty (420) parts per million, which is  at near-historically low concentrations.   The current carbon dioxide levels are one-sixth (1/6) of the average of  two thousand six hundred  (2,600)  parts per million over geologic time;

  (vii)     It is estimated that carbon dioxide levels  need to exceed one hundred fifty (150) parts per million to ensure the survival of plant life on earth;

  (viii)     The earth needs carbon dioxide to support  life and to  increase plant yields,  both of     which will contribute to  the health and prosperity of  all Wyoming citizens.

   (b)     It is the policy of the state of Wyoming that:

(i)       Carbon dioxide is a foundational nutrient necessary for life on earth;

(ii)       Carbon dioxide shall not be designated or treated as a pollutant or contaminant;

(iii)       The state of Wyoming shall not pursue any targets or measures that support the reduction or elimination of  carbon dioxide,  including any  “net-zero”  targets.

          Section 2.        W.S. 37-1-101(a)(intro) and 37-2-134(a)(i)  and (iv) are amended to read:

37-1-101.       Definitions.

(a)   As used in chapters 1, 2, 3, 12, and 17 and 18 of  this title:

37-2-134.       Electric generation facility closures; presumption; commission review

(a)    As used in this section:

(i)     “Dispatchable” means as defined in W.S. 37-18-101(a)(ii) a source of electricity that is available for use on demand and that can be dispatched upon request of a power grid operator or that can have its power output adjusted, according to  market needs and includes dispatchability;

(iv)    “Reliable” means as  defined in W.S. 37-18-101(a)(iv) generated electricity that is not subject to intermittent availability.

        Section    3.    W.S.    37-1-101(a)(vi)(N), 37-18-101 and  37-18-102 are repealed.

Section    4.   Not later than sixty (60) days after the effective date of this act each public utility that recovered rates from customers under W.S. 37-18-102(c)(i) or (iii),  as repealed by section 3 of this act, shall refund those rates to customers who paid them, provided that the utility shall not be  required to refund rates recovered under W.S. 37-18-102(c)(i) and (iii) that the utility had expended for carbon capture, utilization and storage technology before the effective date of this act. Refunds required under this section shall be in a form and manner specified by the public service commission

Section    5.  The public service commission shall promulgate all rules necessary to implement this act.

Section    6.  This act is effective immediately upon completion of all acts necessary for a bill to become law as provided by Article 4, Section 8 of the Wyoming Constitution.

 (END)

Ocean Even Cooler December 2024

The best context for understanding decadal temperature changes comes from the world’s sea surface temperatures (SST), for several reasons:

  • The ocean covers 71% of the globe and drives average temperatures;
  • SSTs have a constant water content, (unlike air temperatures), so give a better reading of heat content variations;
  • Major El Ninos have been the dominant climate feature in recent years.

HadSST is generally regarded as the best of the global SST data sets, and so the temperature story here comes from that source. Previously I used HadSST3 for these reports, but Hadley Centre has made HadSST4 the priority, and v.3 will no longer be updated.  HadSST4 is the same as v.3, except that the older data from ship water intake was re-estimated to be generally lower temperatures than shown in v.3.  The effect is that v.4 has lower average anomalies for the baseline period 1961-1990, thereby showing higher current anomalies than v.3. This analysis concerns more recent time periods and depends on very similar differentials as those from v.3 despite higher absolute anomaly values in v.4.  More on what distinguishes HadSST3 and 4 from other SST products at the end. The user guide for HadSST4 is here.

The Current Context

The chart below shows SST monthly anomalies as reported in HadSST4 starting in 2015 through December 2024.  A global cooling pattern is seen clearly in the Tropics since its peak in 2016, joined by NH and SH cycling downward since 2016, followed by rising temperatures in 2023 and 2024.

Note that in 2015-2016 the Tropics and SH peaked in between two summer NH spikes.  That pattern repeated in 2019-2020 with a lesser Tropics peak and SH bump, but with higher NH spikes. By end of 2020, cooler SSTs in all regions took the Global anomaly well below the mean for this period.  A small warming was driven by NH summer peaks in 2021-22, but offset by cooling in SH and the tropics, By January 2023 the global anomaly was again below the mean.

Now in 2023-24 came an event resembling 2015-16 with a Tropical spike and two NH spikes alongside, all higher than 2015-16. There was also a coinciding rise in SH, and the Global anomaly was pulled up to 1.1°C last year, ~0.3° higher than the 2015 peak.  Then NH started down autumn 2023, followed by Tropics and SH descending 2024 to the present. After 10 months of cooling in SH and the Tropics, the Global anomaly came back down, led by NH cooling the last 4 months from its peak in August. It’s now about 0.1C higher than the average for this period. Note that the Tropical anomaly has cooled from 1.29C in 2024/01 to 0.66C as of 2024/12.

Comment:

The climatists have seized on this unusual warming as proof their Zero Carbon agenda is needed, without addressing how impossible it would be for CO2 warming the air to raise ocean temperatures.  It is the ocean that warms the air, not the other way around.  Recently Steven Koonin had this to say about the phonomenon confirmed in the graph above:

El Nino is a phenomenon in the climate system that happens once every four or five years.  Heat builds up in the equatorial Pacific to the west of Indonesia and so on.  Then when enough of it builds up it surges across the Pacific and changes the currents and the winds.  As it surges toward South America it was discovered and named in the 19th century  It iswell understood at this point that the phenomenon has nothing to do with CO2.

Now people talk about changes in that phenomena as a result of CO2 but it’s there in the climate system already and when it happens it influences weather all over the world.   We feel it when it gets rainier in Southern California for example.  So for the last 3 years we have been in the opposite of an El Nino, a La Nina, part of the reason people think the West Coast has been in drought.

It has now shifted in the last months to an El Nino condition that warms the globe and is thought to contribute to this Spike we have seen. But there are other contributions as well.  One of the most surprising ones is that back in January of 2022 an enormous underwater volcano went off in Tonga and it put up a lot of water vapor into the upper atmosphere. It increased the upper atmosphere of water vapor by about 10 percent, and that’s a warming effect, and it may be that is contributing to why the spike is so high.

A longer view of SSTs

Open image in new tab to enlarge.

The graph above is noisy, but the density is needed to see the seasonal patterns in the oceanic fluctuations.  Previous posts focused on the rise and fall of the last El Nino starting in 2015.  This post adds a longer view, encompassing the significant 1998 El Nino and since.  The color schemes are retained for Global, Tropics, NH and SH anomalies.  Despite the longer time frame, I have kept the monthly data (rather than yearly averages) because of interesting shifts between January and July. 1995 is a reasonable (ENSO neutral) starting point prior to the first El Nino. 

The sharp Tropical rise peaking in 1998 is dominant in the record, starting Jan. ’97 to pull up SSTs uniformly before returning to the same level Jan. ’99. There were strong cool periods before and after the 1998 El Nino event. Then SSTs in all regions returned to the mean in 2001-2. 

SSTS fluctuate around the mean until 2007, when another, smaller ENSO event occurs. There is cooling 2007-8,  a lower peak warming in 2009-10, following by cooling in 2011-12.  Again SSTs are average 2013-14.

Now a different pattern appears.  The Tropics cooled sharply to Jan 11, then rise steadily for 4 years to Jan 15, at which point the most recent major El Nino takes off.  But this time in contrast to ’97-’99, the Northern Hemisphere produces peaks every summer pulling up the Global average.  In fact, these NH peaks appear every July starting in 2003, growing stronger to produce 3 massive highs in 2014, 15 and 16.  NH July 2017 was only slightly lower, and a fifth NH peak still lower in Sept. 2018.

The highest summer NH peaks came in 2019 and 2020, only this time the Tropics and SH were offsetting rather adding to the warming. (Note: these are high anomalies on top of the highest absolute temps in the NH.)  Since 2014 SH has played a moderating role, offsetting the NH warming pulses. After September 2020 temps dropped off down until February 2021.  In 2021-22 there were again summer NH spikes, but in 2022 moderated first by cooling Tropics and SH SSTs, then in October to January 2023 by deeper cooling in NH and Tropics.  

Then in 2023 the Tropics flipped from below to well above average, while NH produced a summer peak extending into September higher than any previous year.  Despite El Nino driving the Tropics January 2024 anomaly higher than 1998 and 2016 peaks, following months cooled in all regions, and the Tropics continued cooling in April, May and June along with SH dropping.  After July and August NH warming again pulled the global anomaly higher, September and October resumed cooling in all regions.

What to make of all this? The patterns suggest that in addition to El Ninos in the Pacific driving the Tropic SSTs, something else is going on in the NH.  The obvious culprit is the North Atlantic, since I have seen this sort of pulsing before.  After reading some papers by David Dilley, I confirmed his observation of Atlantic pulses into the Arctic every 8 to 10 years.

Contemporary AMO Observations

Through January 2023 I depended on the Kaplan AMO Index (not smoothed, not detrended) for N. Atlantic observations. But it is no longer being updated, and NOAA says they don’t know its future.  So I find that ERSSTv5 AMO dataset has current data.  It differs from Kaplan, which reported average absolute temps measured in N. Atlantic.  “ERSST5 AMO  follows Trenberth and Shea (2006) proposal to use the NA region EQ-60°N, 0°-80°W and subtract the global rise of SST 60°S-60°N to obtain a measure of the internal variability, arguing that the effect of external forcing on the North Atlantic should be similar to the effect on the other oceans.”  So the values represent sst anomaly differences between the N. Atlantic and the Global ocean.

The chart above confirms what Kaplan also showed.  As August is the hottest month for the N. Atlantic, its variability, high and low, drives the annual results for this basin.  Note also the peaks in 2010, lows after 2014, and a rise in 2021. Then in 2023 the peak was holding at 1.4C before declining.  An annual chart below is informative:

Note the difference between blue/green years, beige/brown, and purple/red years.  2010, 2021, 2022 all peaked strongly in August or September.  1998 and 2007 were mildly warm.  2016 and 2018 were matching or cooler than the global average.  2023 started out slightly warm, then rose steadily to an  extraordinary peak in July.  August to October were only slightly lower, but by December cooled by ~0.4C.

Then in 2024 the AMO anomaly started higher than any previous year, then leveled off for two months declining slightly into April.  Remarkably, May showed an upward leap putting this on a higher track than 2023, and rising slightly higher in June.  In July, August and September 2024 the anomaly declined, and despite a small rise in October, is now lower than the peak reached in 2023.

The pattern suggests the ocean may be demonstrating a stairstep pattern like that we have also seen in HadCRUT4. 

The purple line is the average anomaly 1980-1996 inclusive, value 0.18.  The orange line the average 1980-2024, value 0.39, also for the period 1997-2012. The red line is 2013-2024, value 0.67. As noted above, these rising stages are driven by the combined warming in the Tropics and NH, including both Pacific and Atlantic basins.

See Also:

2024 El Nino Collapsing

Curiosity:  Solar Coincidence?

The news about our current solar cycle 25 is that the solar activity is hitting peak numbers now and higher  than expected 1-2 years in the future.  As livescience put it:  Solar maximum could hit us harder and sooner than we thought. How dangerous will the sun’s chaotic peak be?  Some charts from spaceweatherlive look familar to these sea surface temperature charts.

Summary

The oceans are driving the warming this century.  SSTs took a step up with the 1998 El Nino and have stayed there with help from the North Atlantic, and more recently the Pacific northern “Blob.”  The ocean surfaces are releasing a lot of energy, warming the air, but eventually will have a cooling effect.  The decline after 1937 was rapid by comparison, so one wonders: How long can the oceans keep this up? And is the sun adding forcing to this process?

Space weather impacts the ionosphere in this animation. Credits: NASA/GSFC/CIL/Krystofer Kim

Footnote: Why Rely on HadSST4

HadSST is distinguished from other SST products because HadCRU (Hadley Climatic Research Unit) does not engage in SST interpolation, i.e. infilling estimated anomalies into grid cells lacking sufficient sampling in a given month. From reading the documentation and from queries to Met Office, this is their procedure.

HadSST4 imports data from gridcells containing ocean, excluding land cells. From past records, they have calculated daily and monthly average readings for each grid cell for the period 1961 to 1990. Those temperatures form the baseline from which anomalies are calculated.

In a given month, each gridcell with sufficient sampling is averaged for the month and then the baseline value for that cell and that month is subtracted, resulting in the monthly anomaly for that cell. All cells with monthly anomalies are averaged to produce global, hemispheric and tropical anomalies for the month, based on the cells in those locations. For example, Tropics averages include ocean grid cells lying between latitudes 20N and 20S.

Gridcells lacking sufficient sampling that month are left out of the averaging, and the uncertainty from such missing data is estimated. IMO that is more reasonable than inventing data to infill. And it seems that the Global Drifter Array displayed in the top image is providing more uniform coverage of the oceans than in the past.

uss-pearl-harbor-deploys-global-drifter-buoys-in-pacific-ocean

USS Pearl Harbor deploys Global Drifter Buoys in Pacific Ocean


12/2024 Update–As Temperature Changes, CO2 Follows

Previously I have demonstrated that changes in atmospheric CO2 levels follow changes in Global Mean Temperatures (GMT) as shown by satellite measurements from University of Alabama at Huntsville (UAH). That background post is reprinted later below.

My curiosity was piqued by the remarkable GMT spike starting in January 2023 and rising to a peak in April 2024, and then declining afterward.  I also became aware that UAH has recalibrated their dataset due to a satellite drift that can no longer be corrected. The values since 2020 have shifted slightly in version 6.1, as shown in my recent report  Ocean Leads Cooling UAH December 2024.

In this post, I test the premise that temperature changes are predictive of changes in atmospheric CO2 concentrations.  The chart above shows the two monthly datasets: CO2 levels in blue reported at Mauna Loa, and Global temperature anomalies in purple reported by UAHv6.1, both through December 2024. Would such a sharp increase in temperature be reflected in rising CO2 levels, according to the successful mathematical forecasting model? Would CO2 levels decline as temperatures dropped following the peak?

The answer is yes: that temperature spike resulted
in a corresponding CO2 spike as expected.
And lower CO2 levels followed the temperature decline.

Above are UAH temperature anomalies compared to CO2 monthly changes year over year.

Changes in monthly CO2 synchronize with temperature fluctuations, which for UAH are anomalies now referenced to the 1991-2020 period. CO2 differentials are calculated for the present month by subtracting the value for the same month in the previous year (for example December 2024 minus December 2023).  Temp anomalies are calculated by comparing the present month with the baseline month. Note the recent CO2 upward spike and drop following the temperature spike and drop.

The final proof that CO2 follows temperature due to stimulation of natural CO2 reservoirs is demonstrated by the ability to calculate CO2 levels since 1979 with a simple mathematical formula:

For each subsequent year, the CO2 level for each month was generated

CO2  this month this year = a + b × Temp this month this year  + CO2 this month last year

The values for a and b are constants applied to all monthly temps, and are chosen to scale the forecasted CO2 level for comparison with the observed value. Here is the result of those calculations.

In the chart calculated CO2 levels correlate with observed CO2 levels at 0.9987 out of 1.0000.  This mathematical generation of CO2 atmospheric levels is only possible if they are driven by temperature-dependent natural sources, and not by human emissions which are small in comparison, rise steadily and monotonically.  For a more detailed look at the recent fluxes, here are the results since 2015, an ENSO neutral year.

For this recent period, the calculated CO2 values match the annual lows, while some annual generated values of CO2 are slightly higher or lower than observed at other months of the year. Still the correlation for this period is 0.9931.

Key Point

Changes in CO2 follow changes in global temperatures on all time scales, from last month’s observations to ice core datasets spanning millennia. Since CO2 is the lagging variable, it cannot logically be the cause of temperature, the leading variable. It is folly to imagine that by reducing human emissions of CO2, we can change global temperatures, which are obviously driven by other factors.

Background Post Temperature Changes Cause CO2 Changes, Not the Reverse

This post is about proving that CO2 changes in response to temperature changes, not the other way around, as is often claimed.  In order to do  that we need two datasets: one for measurements of changes in atmospheric CO2 concentrations over time and one for estimates of Global Mean Temperature changes over time.

Climate science is unsettling because past data are not fixed, but change later on.  I ran into this previously and now again in 2021 and 2022 when I set out to update an analysis done in 2014 by Jeremy Shiers (discussed in a previous post reprinted at the end).  Jeremy provided a spreadsheet in his essay Murray Salby Showed CO2 Follows Temperature Now You Can Too posted in January 2014. I downloaded his spreadsheet intending to bring the analysis up to the present to see if the results hold up.  The two sources of data were:

Temperature anomalies from RSS here:  http://www.remss.com/missions/amsu

CO2 monthly levels from NOAA (Mauna Loa): https://www.esrl.noaa.gov/gmd/ccgg/trends/data.html

Changes in CO2 (ΔCO2)

Uploading the CO2 dataset showed that many numbers had changed (why?).

The blue line shows annual observed differences in monthly values year over year, e.g. June 2020 minus June 2019 etc.  The first 12 months (1979) provide the observed starting values from which differentials are calculated.  The orange line shows those CO2 values changed slightly in the 2020 dataset vs. the 2014 dataset, on average +0.035 ppm.  But there is no pattern or trend added, and deviations vary randomly between + and -.  So last year I took the 2020 dataset to replace the older one for updating the analysis.

Now I find the NOAA dataset starting in 2021 has almost completely new values due to a method shift in February 2021, requiring a recalibration of all previous measurements.  The new picture of ΔCO2 is graphed below.

The method shift is reported at a NOAA Global Monitoring Laboratory webpage, Carbon Dioxide (CO2) WMO Scale, with a justification for the difference between X2007 results and the new results from X2019 now in force.  The orange line shows that the shift has resulted in higher values, especially early on and a general slightly increasing trend over time.  However, these are small variations at the decimal level on values 340 and above.  Further, the graph shows that yearly differentials month by month are virtually the same as before.  Thus I redid the analysis with the new values.

Global Temperature Anomalies (ΔTemp)

The other time series was the record of global temperature anomalies according to RSS. The current RSS dataset is not at all the same as the past.

Here we see some seriously unsettling science at work.  The purple line is RSS in 2014, and the blue is RSS as of 2020.  Some further increases appear in the gold 2022 rss dataset. The red line shows alterations from the old to the new.  There is a slight cooling of the data in the beginning years, then the three versions mostly match until 1997, when systematic warming enters the record.  From 1997/5 to 2003/12 the average anomaly increases by 0.04C.  After 2004/1 to 2012/8 the average increase is 0.15C.  At the end from 2012/9 to 2013/12, the average anomaly was higher by 0.21. The 2022 version added slight warming over 2020 values.

RSS continues that accelerated warming to the present, but it cannot be trusted.  And who knows what the numbers will be a few years down the line?  As Dr. Ole Humlum said some years ago (regarding Gistemp): “It should however be noted, that a temperature record which keeps on changing the past hardly can qualify as being correct.”

Given the above manipulations, I went instead to the other satellite dataset UAH version 6. UAH has also made a shift by changing its baseline from 1981-2010 to 1991-2020.  This resulted in systematically reducing the anomaly values, but did not alter the pattern of variation over time.  For comparison, here are the two records with measurements through December 2023.

Comparing UAH temperature anomalies to NOAA CO2 changes.

Here are UAH temperature anomalies compared to CO2 monthly changes year over year.

Changes in monthly CO2 synchronize with temperature fluctuations, which for UAH are anomalies now referenced to the 1991-2020 period.  As stated above, CO2 differentials are calculated for the present month by subtracting the value for the same month in the previous year (for example June 2022 minus June 2021).   Temp anomalies are calculated by comparing the present month with the baseline month.

The final proof that CO2 follows temperature due to stimulation of natural CO2 reservoirs is demonstrated by the ability to calculate CO2 levels since 1979 with a simple mathematical formula:

For each subsequent year, the co2 level for each month was generated

CO2  this month this year = a + b × Temp this month this year  + CO2 this month last year

Jeremy used Python to estimate a and b, but I used his spreadsheet to guess values that place for comparison the observed and calculated CO2 levels on top of each other.

In the chart calculated CO2 levels correlate with observed CO2 levels at 0.9986 out of 1.0000.  This mathematical generation of CO2 atmospheric levels is only possible if they are driven by temperature-dependent natural sources, and not by human emissions which are small in comparison, rise steadily and monotonically.

Comment:  UAH dataset reported a sharp warming spike starting mid year, with causes speculated but not proven.  In any case, that surprising peak has not yet driven CO2 higher, though it might,  but only if it persists despite the likely cooling already under way.

Previous Post:  What Causes Rising Atmospheric CO2?

nasa_carbon_cycle_2008-1

This post is prompted by a recent exchange with those reasserting the “consensus” view attributing all additional atmospheric CO2 to humans burning fossil fuels.

The IPCC doctrine which has long been promoted goes as follows. We have a number over here for monthly fossil fuel CO2 emissions, and a number over there for monthly atmospheric CO2. We don’t have good numbers for the rest of it-oceans, soils, biosphere–though rough estimates are orders of magnitude higher, dwarfing human CO2.  So we ignore nature and assume it is always a sink, explaining the difference between the two numbers we do have. Easy peasy, science settled.

What about the fact that nature continues to absorb about half of human emissions, even while FF CO2 increased by 60% over the last 2 decades? What about the fact that in 2020 FF CO2 declined significantly with no discernable impact on rising atmospheric CO2?

These and other issues are raised by Murray Salby and others who conclude that it is not that simple, and the science is not settled. And so these dissenters must be cancelled lest the narrative be weakened.

The non-IPCC paradigm is that atmospheric CO2 levels are a function of two very different fluxes. FF CO2 changes rapidly and increases steadily, while Natural CO2 changes slowly over time, and fluctuates up and down from temperature changes. The implications are that human CO2 is a simple addition, while natural CO2 comes from the integral of previous fluctuations.  Jeremy Shiers has a series of posts at his blog clarifying this paradigm. See Increasing CO2 Raises Global Temperature Or Does Increasing Temperature Raise CO2 Excerpts in italics with my bolds.

The following graph which shows the change in CO2 levels (rather than the levels directly) makes this much clearer.

Note the vertical scale refers to the first differential of the CO2 level not the level itself. The graph depicts that change rate in ppm per year.

There are big swings in the amount of CO2 emitted. Taking the mean as 1.6 ppmv/year (at a guess) there are +/- swings of around 1.2 nearly +/- 100%.

And, surprise surprise, the change in net emissions of CO2 is very strongly correlated with changes in global temperature.

This clearly indicates the net amount of CO2 emitted in any one year is directly linked to global mean temperature in that year.

For any given year the amount of CO2 in the atmosphere will be the sum of

  • all the net annual emissions of CO2
  • in all previous years.

For each year the net annual emission of CO2 is proportional to the annual global mean temperature.

This means the amount of CO2 in the atmosphere will be related to the sum of temperatures in previous years.

So CO2 levels are not directly related to the current temperature but the integral of temperature over previous years.

The following graph again shows observed levels of CO2 and global temperatures but also has calculated levels of CO2 based on sum of previous years temperatures (dotted blue line).

Summary:

The massive fluxes from natural sources dominate the flow of CO2 through the atmosphere.  Human CO2 from burning fossil fuels is around 4% of the annual addition from all sources. Even if rising CO2 could cause rising temperatures (no evidence, only claims), reducing our emissions would have little impact.

Atmospheric CO2 Math

Ins: 4% human, 96% natural
Outs: 0% human, 98% natural.
Atmospheric storage difference: +2%
(so that: Ins = Outs + Atmospheric storage difference)

Balance = Atmospheric storage difference: 2%, of which,
Humans: 2% X 4% = 0.08%
Nature: 2% X 96 % = 1.92%

Ratio Natural:Human =1.92% : 0.08% = 24 : 1

Resources
For a possible explanation of natural warming and CO2 emissions see Little Ice Age Warming Recovery May be Over
Resources:

CO2 Fluxes, Sources and Sinks

Who to Blame for Rising CO2?

Fearless Physics from Dr. Salby

Sorting (Again) Climate and Weather Changes

Brian C. Joondeph asks in his American Thinker Article When Did Changing Weather Become Climate Change? Excerpts in italics with my bolds and added images.

What’s the difference between weather and climate? Let’s ask the expert class, the governmental National Weather Service.

Weather is defined as the state of the atmosphere at a given time and place, with respect to variables such as temperature, moisture, wind speed and direction, and barometric pressure.

Climate is defined as the expected frequency of specific states of the atmosphere, ocean, and land, including variables such as temperature, salinity, soil moisture, wind speed and direction, and current strength and direction. It encompasses the weather over different periods of time and also relates to mutual interactions between the components of the earth system (e.g., atmospheric composition, volcanic eruptions, changes in the earth’s orbit around the sun, and changes in the energy from the sun itself).

That’s a mouthful, a typical governmental explanation. Simply put, weather is short-term, meaning days or a few weeks, while climate is long-term, meaning years, centuries, or longer. [Comment: I prefer a baseball analogy: Weather is like the batter swinging in the box, and climate is the batting statistics, hits, walks, RBIs etc.]

It’s sunny and unseasonably warm where I am today, but a week ago, it was snowy and unseasonably cold. A climate warrior might label the former as global warming, the latter as global cooling, or the composite as climate change. A rational person would call it weather.

The United Nations (UN) defines climate change,

Climate change refers to long-term shifts in temperatures and weather patterns. Such shifts can be natural, due to changes in the sun’s activity or large volcanic eruptions. But since the 1800s, human activities have been the main driver of climate change, primarily due to the burning of fossil fuels like coal, oil and gas.

The first sentence is undeniably true. The Great Lakes were once covered by mile-thick ice sheets that disappeared when the glaciers retreated 10,000 years ago. This is not long ago, considering the Earth’s 4.5 billion-year age.

Somehow, the climate cooled and warmed long before any significant human activity existed. And how many additional times did this happen in the past 4.5 billion years?

But the UN believes humans are the “main driver of climate change” since the 1800s, not explaining how climate changed so drastically 10,000 years ago to melt a mile-thick ice sheet during a time of minuscule human activity.

The UN relies on the Intergovernmental Panel on Climate Change (IPCC), that reports in a scary fashion,

Many of the changes observed in the climate are unprecedented in thousands, if not hundreds of thousands of years, and some of the changes already set in motion—such as continued sea level rise—are irreversible over hundreds to thousands of years.

Is today’s climate “unprecedented”? Do they know the temperatures hundreds of thousands of years ago? They should, as this data is readily available, published in the prestigious journal Science.

Researchers reconstructed global mean surface temperature using data assimilation, integrating geological data with climate model simulations. They discovered that “the Earth’s temperature has varied more dynamically than previously thought.”

PhanDA global mean surface temperature across the last 485 million years. The gray shading corresponds to different confidence levels, and the black line shows the average solution. The colored bands along the top reflect the climate state, with cooler colors indicating icehouse (coolhouse and coldhouse) climates, warmer colors indicating greenhouse (warmhouse and hothouse) climates, and the gray representing a transitional state. Source: Judd et al 2024

Today’s global temperature is low. It was last this cold 300 million years ago. According to the chart, Planet Earth has been cooling for the past 50 million years. Any man-made warming would be helpful now.

Scientists should know better, as should corporate media.
But obviously, they don’t.

I reference a few articles from this year in The Guardian, a two-hundred-year-old British newspaper considered a “newspaper of record in the UK” (along with the London Times), much like The New York Times in America. As a British newspaper, the Guardian has observed climate change firsthand, reporting on it cooling, then warming, then cooling again.

Another record is the recent (in geological terms) history of the Thames River. Between 1309 and 1814, it froze at least 23 times. There was a “frost fair” in 1608 when the river froze for over six weeks.

What caused this freeze? London’s activity in the 1600s was mainly overcrowding, disease, and crime, not air conditioners, internal combustion engines, and backyard grills.

More recently, the river froze over in 1963 and again partially in 2021. This seems to be normal cyclic climate change, far from the “man-made global warming” the UN and IPCC warn about.

The Guardian ran two stories this year without a bit of irony. In February of this year, their headline was “What will Spain look like when it runs out of water? Barcelona is giving us a glimpse.” In October, the new headline was “Spain floods: number killed passes 150 as scientists say climate change ‘most likely explanation’ – as it happened.”

From running out of water to flooding, all within a few months. It’s dry, then it’s wet. It’s cold, then it’s warm. And vice versa. It’s also normal. But The Guardian wants it both ways. It’s all climate change, in their view.

A month ago, the paper wrote, “Spain’s deadly floods and droughts are two faces of the climate crisis coin.” In other words, all forms of weather are climate change.

CNN wants it both ways, too. In December 2023, it ran a headline, “Winter is here, but it’s losing its cool.” One year later, without a bit of irony or introspection, it reversed itself with this headline, “It’s about to get dangerously cold, even for winter.”

Much like racism, when everything is considered racist, then nothing is. The same is true for climate change. Psychologists call this confirmation bias,

People display this bias when they select information that supports their views, ignoring contrary information, or when they interpret ambiguous evidence as supporting their existing attitudes. The effect is strongest for desired outcomes, for emotionally charged issues, and for deeply entrenched beliefs.

It is also hubris to believe that we can predict, much less control, the climate. The IPCC readily admits, “The climate system is a coupled non-linear chaotic system, and therefore, the long-term prediction of future climate states is impossible.”

Yet Al Gore, Greta Thunberg, John Kerry, and other “climate experts” claim to know exactly how many years it will be until the Earth is uninhabitable.

Speaking of Al Gore, I recommend Joel Gilbert’s new film, “The Climate According to AI Al Gore,” where Joel interviews an AI Gore, debunking Gore’s conviction, expertise, and the entire climate emergency of the left.

To the fearmongering, climate-catastrophizing left, it’s all humans’ fault, and with ever-increasing command-and-control diktats, rules, regulations, and taxes, we can affect forces beyond our comprehension and control.

The climate is indeed changing—it always has and always will. Temperatures will likely rise from their current 500 million-year low regardless of what the so-called experts, activists, or any world government agencies say or do.

In their attempts to regulate and tinker with Mother Nature, they may inadvertently destroy everything they are attempting to save—unless that’s the plan.

Previous Post: Corrupting Climate and Weather

An article at The Spectator raises the question Do alarmists know the difference between weather and climate?  The author Charles Moore may also be a man for all seasons like Sir Thomas More.  Excerpts in italics with my bolds and images.

A lot of clever people are putting the ‘green’ into ‘greenbacks’

Until recently, those expressing skepticism about climate change catastrophe have been hauled over the coals (or the renewables equivalent) for not understanding the difference between ‘climate’ and ‘weather’. The lack of global warming at the beginning of the 21st century was not to be taken, chided the warmists, as evidence that climate change was not happening. Weather was the passing phenomenon of each day: climate was the real, deep thing.

Now, however, the alarmists themselves have elided the two concepts, using the Australian bush fires as their cue. As Sir David Attenborough puts it: ‘The moment of crisis has come’. They could be right, of course, but how could they really know? In this sense, President Trump is surely justified in warning, at Davos, against the ‘Prophets of Doom’. Prophecy is a different skill from an exact understanding of the here and now.

Mr Trump might usefully have talked about the Profits of Doom too. If the movement can persuade western society that the climate emergency is upon us, there are enormous sums to be made by people who claim to be able to remedy it. Hence the patter now coming out of companies such as Blackrock, BP or Microsoft, fanned by Mammon’s public intellectuals, such as Mark Carney. A lot of clever people are putting the ‘green’ into ‘greenbacks’. A lot of less clever investors are going to get their fingers burnt.

See Also Stoking Big Climate Business

Footnote:  Case in Point:  Green Fraudsters Plead Guilty

Jeff Carpoff, 49, of Martinez, pleaded guilty today to conspiracy to commit wire fraud and money laundering. His wife, Paulette Carpoff, 46, pleaded guilty today to conspiracy to commit an offense against the United States and money laundering. According to court documents, between 2011 and 2018, DC Solar manufactured mobile solar generator units (MSG), solar generators that were mounted on trailers that were promoted as able to provide emergency power to cellphone towers and lighting at sporting events. A significant incentive for investors were generous federal tax credits due to the solar nature of the MSGs.

The conspirators pulled off their scheme by selling solar generators that did not exist to investors, making it appear that solar generators existed in locations that they did not, creating false financial statements, and obtaining false lease contracts, among other efforts to conceal the fraud. In reality, at least half of the approximately 17,000 solar generators claimed to have been manufactured by DC Solar did not exist.

“By all outer appearances this was a legitimate and successful company,” said Kareem Carter, Special Agent in Charge IRS Criminal Investigation. “But in reality it was all just smoke and mirrors — a Ponzi scheme touting tax benefits to the tune of over $900 million. IRS CI is committed to investigating those who take advantage and impact the financial well-being of others for their own personal gain.”

“The Federal Deposit Insurance Corporation, Office of Inspector General (FDIC-OIG) is pleased to join our law enforcement colleagues in announcing these guilty pleas,” stated Special Agent in Charge Wade Walters for the FDIC OIG San Francisco Regional Office. “The defendants conspired with others to create a fraudulent business venture that duped unsuspecting entities, including banks, to invest approximately $1 billion, which the two later used to support a lavish lifestyle.

Source:  https://wattsupwiththat.com/2020/01/27/dc-solar-owners-plead-guilty-to-largest-ponzi-scheme-in-eastern-california-history/

Unsettled Science: How Sun’s Fluxes Affect Our Climate

John Green writes at American Thinker Why are we studying the sun, if the science is settled? Excerpts in italics with my bolds and added images.

NASA’s Parker solar probe just completed one of its primary multi-year mission objectives, with the closest ever approach to the Sun. On Christmas Eve, the probe flew through the Sun’s corona at a blistering (literally and figuratively) 430,000 mph. For aircraft buffs, that’s Mach 560 — fast enough to circle the earth in about 3 minutes!

NASA’s Closest Approach to the Sun’s Fiery Surface Achieved by Parker Probe

A faint signal from Parker indicates that it survived its scorching flyby, and scientists are expecting it to download a treasure trove of data later this month. It turns out there’s a lot the guys with the PhDs don’t understand about the sun. As NASA states:

The NASA Parker Solar Probe mission is a mission designed to help humanity better understand the Sun, where changing conditions can propagate out into the solar system, affecting Earth and other worlds. As such, the primary goals are to examine the acceleration of solar wind through the movement of heat and energy in the Sun’s corona in addition to study solar energetic particles.

They’re hoping data collected while flying through the Sun’s corona will provide a few answers and make it a bit more predictable.

I confess I’m just a lowly engineer, and many of the mysteries they’re trying to unravel are well beyond my college physics courses. But reading about the Parker probe got me wondering: Doesn’t the Sun have something to do with our weather? I mean it’s warm on sunny days, and plants grow better when the earth’s surface is the closest to the Sun.

Those observations may sound obtuse, but they’re no more obtuse than “experts” saying that “climate science is settled” — when they don’t understand how the freaking Sun works! (Looking at you “Science Guy” Bill Nye.)

The science can only be settled when the smart guys understand all the factors that affect our climate — and how they interact — well enough to predict outcomes. The Sun imparts about 342 watts of energy on every square meter of the earth’s surface (according to NASA). That’s the equivalent of 44 million average electric power plants (700 times what the world has) — yet we don’t understand its fluctuations.

That’s a rather big unpredictable factor for this supposedly “settled science” — no?

One can only conclude that when highly educated people — who should know better — claim climate science is settled, they’re lying. Perhaps that’s why multiple predictions that the polar bears would be extinct and New York would be underwater by now have all been wrong. It might also explain why the greenies avoid discussion of ice ages and interglacial periods when assuring us that our cars are delivering planetary doom – while their private jets are perfectly fine.

Given what little we know about the Sun, the anthropogenic climate change “experts” are either:

  • Ignorant men, succumbing to irrational fears — placing superstition above science, or
  • Evil men — profiting by scaring us into irrational behavior.

We should keep that in mind when they insist that we halt progress, live in destitution, and scare our children that apocalypse is imminent. Our only rational response is to ignore them … and cut off their funding.

Yes, IPCC, Our Climate Responds to Our Sun

John Gideon Hartnett writes at Spectator Australia The sun is in control of our oceans. Text is from John Ray at his blog, excerpts in italics with my bolds and added images.

In recent years, there has been observed an increase in ocean temperature. Those who adhere to the Climate Change version of events say that the oceans are getting warmer because of trapped carbon dioxide (CO2) in the atmosphere causing a massive greenhouse effect leading to boiling oceans.

Well, anyone who has a brain knows that the oceans are not boiling, but let’s assume that is just hyperbole. When actual research – when actual measurements were taken – reality turns out to be the exact opposite.

New research shows that the temperature of our oceans are controlled by incident radiation from the Sun. Who would have guessed?

And as a consequence of the oceans warming, dissolved carbon dioxide gas is released due to reduced is solubility in ocean water. This means the warming of the oceans would lead (or cause) an increase in CO2 concentration in the atmosphere.  One of the researchers in the study wrote on X.com:

A decrease in cloud cover and albedo means more short wavelength (SW) solar radiation reaches the oceans. Albedo is the reflectivity of the Earth. Lower albedo means more sunlight reaching the land and oceans and more warming by the Sun.

Figure 8. Comparison between observed global temperature anomalies and CERES-reported changes in the Earth’s absorbed solar flux. The two data series representing 13-month running means are highly correlated with the absorbed SW flux explaining 78% of the temperature variation (R2 = 0.78). The global temperature lags the absorbed solar radiation between 0 and 9 months, which indicates that climate change in the 21st Century was driven by solar forcing.

I mean to say that this is so obvious. The Sun heats Earth’s surface of which 71% is covered by the oceans! Basic physics!

The energy from the Sun powers all life on the planet and causes all Earth changes. Every second, the Earth receives the equivalent energy of 42 megatons of TNT in radiation from the Sun. That cannot be ignored. 

Climate Change, the ideological movement which I prefer to call a cult, views all evidence through the lens of their religious belief that the Earth is warmed by human activity. That activity releases carbon dioxide gas, which has been observed to be increasing. Their belief is that CO2 traps heat in a giant greenhouse effect. That is the dogma anyway. And I must add, we all are the carbon they want to eliminate.

But how much of that observed increase in CO2 is actually from natural causes and not from human activity? At least 94 per cent is. This new evidence now suggests it could be even more than that.

If the oceans emit CO2 gas following changes in the water temperature, which this research shows is due to the amount (flux) of solar radiation reaching the surface, then more CO2 comes from natural causes.

It is basic physics that as you heat water the dissolved gases are released due to a decrease in gas solubility. This means as the solar flux increases CO2 gas is released from the warmer ocean water.

Thus an ocean temperature increase leads to an increase in CO2 in the atmosphere, and not the other way around.

Space weather impacts the ionosphere in this animation. Credits: NASA/GSFC/CIL/Krystofer Kim

Simpleton’s Guide to Climate Alarmist Protests

Rex Murphy wrote a National Post article in 2023 The simpleton’s guide to climate alarmist protest.  Excerpts in italics with my bolds and added images.

Glue yourself to a masterpiece or throw paint on a building.
If that doesn’t hold off climate Armageddon, what will?

The quality of truth in an existential cause may be measured by the quality of the intellects of its most committed followers. Allow me to illustrate.

Imagine the fumings of a climate alarmist. Here, a representation of what goes on in the alarmist mind.

The world is in deep imminent threat.

It may end.

Our beautiful, blue, penguin-marching-David Attenborough-marble may be no more.

All life will disappear. Farewell soy milk. Farewell shocking pink hair dye. Farewell all.

Climate activists in front of police officers during the Extinction Rebellion protest in London [Henry Nicholls/Reuters]

What can I do?

Why, I can call out from every hollow my comrade eco-warriors. Come in a black mask, or strip to your unsightly nudity when you get there, will be the summons.

And what is the plan that I and my fellow eco-doomsters have to avert planetary extinction?

We are, above all, strategists and tacticians. We know what earns quality
and never-challenged coverage on NPR and festivals of authentication from CBC
.

Protesters march on Russell Street in Melbourne, Australia [Darrian Traynor/Getty Images]

That is why we organize the type of protests that we do. Direct actions and exhibitionist displays — stripping down at awards shows — that speak to the farmer, the logger, the fisherman, the movie star falling from favour, or the sad professor who does not have Jordan Peterson’s reach and fame.

Our protests are aimed at persuasion, credibility, their appeal to Steven Guilbeault. Before Steven became our environment minister, he once climbed atop then-premier Ralph Klein’s home in Calgary to “install” solar panels. Even though it terrified Klein’s wife, who thought it was a home invasion, it was a great moment in the history of climate protest and an example for us even today. Steven, you are a hero, and you looked so good in those orange overalls. Greenpeace forever!

So when we want to avert the gravest challenge humanity has ever had to face, that is why we select actions that will — in the words of a very great writer — “strike home to every bosom.”

Is there a Monet or a Goya or a Munch or a Botticelli or a van Gogh in your city’s art gallery? Well, off to the hardware store and the supermarket. There is glue to be bought and cans of tomato soup to drop into the backpack.

Glue yourselves to the painting or throw the tomato soup over it. Doesn’t matter which.

When the world, on TV and the internet, sees these brave assaults on western art at its highest, you know everyone, just everyone, will park their cars, turn off the heat, refuse to buy anything with a petroleum base and insist that all the heads of oil companies and plastic manufacturers be put on trial for genocide, and Hollywood liberals will forsake their mansions and move to caves.

One of our very keenest moves happened over the weekend in Ottawa. An eco-warrior threw a bucket of pink paint on the Prime Minister’s Office and padlocked herself to a rail after the ritual half-undressing. A whole bucket of pink paint — if that doesn’t hold off climate Armageddon, what will?

A climate activist from On2Ottawa threw a bucket of pink paint on the entrance to the Prime Minister’s Office in Ottawa before chaining herself topless to the office door on April 18, 2023. Photo by On2Ottawa / Twitter

All on camera. So bold.

She did not — it is most necessary to add — honk! End of musing.

California-funded eco-activists sprayed orange paint on Christmas trees in seven German cities in a protest against government inaction on climate change. (2023)

We should measure the value of high-order environmental activism — IPCC stuff, Davos effluvia, anything Al Gore or David Suzuki so stridently say — by the quality of the minds and actions of their most intense supporters.

Climate protesters block traffic on the FDR during the morning commute Oct. 25, 2021 (Credit: Extinction Rebellion NYC)

By which I mean the “gluers” on paintings, the neuron-challenged street-blockaders, simpletons who smear soup on masterpieces, and — a great example — the dimwit(s) who think throwing paint on the PM’s office amounts to a persuasive, consciousness-raising tactic.

Instead of what everyone else knows it to be: a display of desperate intellectual incapacity, delusionary arrogance, and the “Hey-I’m-saving-the-world-so-I-can-be-as-stupid-and-supremely-annoying-to-anyone-as-I-f—-ing-well-choose” attitude of such world saviours.

Climate change protesters block downtown D.C. streets in hours-long protest (2019)

That’s the level of non-thought that supports most energetically and egregiously the high priests and savants of the net-zero fantasy. Measured by the standard of its pathetic protests, environmental alarmism is the religion of children, a sandbox for narcissists — regardless of how old they are.

US Supremes Hear Climate Lawfare Case to Stop Oil Railway

IER reports the news from December in article The Supreme Court Takes on a Case Involving the National Environmental Policy Act.  Excerpts in italics with my bolds and added images.

Key Takeaways

The Supreme Court recently heard a major case, Seven County Infrastructure Coalition v. Eagle County, Colorado, that will affect the scope of the National Environmental Policy Act (NEPA). The case concerns the permitting of a proposed Utah railway that would ship oil from the Uinta Basin, potentially quadrupling its oil production. The 88-mile Uinta Basin Railway would connect the oil fields of northeastern Utah to the national rail network running alongside 100 or so miles of the Colorado River to reach oil refineries on the Gulf Coast.  According to The Hill,  at issue is whether and when upstream and downstream environmental impacts should be considered as part of federal environmental reviews. The company behind the railway and a group of Utah counties appealed a lower court decision to the Supreme Court, arguing that those indirect impacts are beyond the scope of the federal reviews.

Background

The case concerns a rail line to support oil development and mineral mining. In 2021, the federal Surface Transportation Board (STB) issued a 3,600-page environmental impact statement to comply with NEPA and approved the rail line. The NEPA mandates that federal agencies assess the environmental effects of projects within their authority. Any major initiative that is managed, regulated, or authorized by the federal government must undergo a NEPA evaluation, a process that can span years and frequently exposes projects to legal challenges.

The STB analyzed the railway’s potential effects on local water resources, air quality, protected species, recreation, local economies, the Ute Indian tribe, and other factors. Environmental groups, however, sued the agency, saying that it failed to examine sufficiently how the railway might affect the risk of accidents on connecting lines hundreds of miles away and to assess emissions in “environmental justice communities” on the Gulf Coast from increased oil shipments, among other supposed shortcomings.

According to the Wall Street Journal editorial board, “a D.C. Circuit Court of Appeals panel sided with the plaintiffs and told the STB it must consider the line’s upstream and downstream effects even if they were hard to predict and beyond the control of the agency and developers. This includes the effects of oil shipments on Gulf Coast refiners and their contributions to climate change.” The appeals court ruling found that the federal STB violated the Endangered Species Act and the Interstate Commerce Commission Termination Act when it permitted the project.

Furthermore, the editorial board also explained that lower court judges—those on the D.C. and Ninth Circuits—ignored the Supreme Court’s past rulings and imposed arbitrary permitting requirements with no limiting principle. The STB lacks authority over Gulf Coast refiners and cannot prevent climate change.

Court Rulings Regarding NEPA

The Supreme Court has heard other related cases and held that agencies need not consider indirect and unpredictable impact, most recently in a 2004 case, Department of Transportation v. Public Citizen. In that case, the Supreme Court held that agencies need only analyze environmental impact with “a reasonably close causal relationship” over which they have “statutory authority” and which they can prevent.

In 2020, the Supreme Court green-lit approval for permits for the Atlantic Coast Pipeline after nearly seven years of litigation, but the pipeline was scrapped due to legal delays that raised project costs significantly. It takes an average of 4.2 years to litigate a NEPA challenge, which adds to the four or more years to obtain a federal permit. These delays are what frustrate investment in new projects, slowing job creation and economic expansion in the United States.

judge struck down a Montana coal mine permit because a federal agency did not consider the climate effects of coal combustion in Asia. Additionally, a 225-mile electric transmission line in Nebraska has been stuck in permitting for 10 years because a lower court invalidated a U.S. Fish and Wildlife permit.

Conclusion

The Supreme Court is tackling a case involving the scope of a federal environmental law, NEPA, that involves a rail line to move oil. In this case, lower courts agreed with environmental groups, who are challenging the government’s permit approval of the rail line. The case is instrumental to the issue of what should be considered when determining potential environmental damages. Congress recognizes that NEPA needs reform as delays over lawsuits have killed projects and dramatically increased their costs and it continues to debate ways to make federal permitting easier and quicker. Until that reform happens, however, Supreme Court Justices need to reign in the environmental limits of NEPA so that needed projects can progress in America.