
Solar energy accumulates massively in the ocean and is variably released during circulation events.
Thanks to Franklin Isaac Ormaza-González alerting me to this paper Did Schwabe cycles 19–24 influence the ENSO events, PDO, and AMO indexes in the Pacific and Atlantic Oceans? by Ormaza-González, Espinoza-Celi and Roa-López, all from ESPOL Polytechnic University, Ecuador. Why is this important? Because warming in the modern era is closely tied to El Niño and La Niña events (ENSO). For example,

The exhibit shows since 1947 GMT warmed by 0.8 C, from 13.9 to 14.7, as estimated by Hadcrut4. This resulted from three natural warming events involving ocean cycles. The most recent rise 2013-16 lifted temperatures by 0.2C. Previously the 1997-98 El Nino produced a plateau increase of 0.4C. Before that, a rise from 1977-81 added 0.2C to start the warming since 1947.
As shown in the synopsis below, the paper analyzes multiple oceanic oscillations during the years 1954 to 2019 in order to compare with solar cycles of sunspots 19 through 24 occurring during that time frame. The title is stated as a question, and the conclusion provides this answer (in italics with my bolds).
Finally, did Schwabe cycles 19–24 influence the ENSO events, PDO, and AMO indexes in the Pacific and Atlantic Oceans? Yes, it has been found a wide range correlation coefficient from 0.100 to about 0.500 statistically significant (p < 0.05) with lag times from few months to over 2 years between the Schwabe cycles and the ocean indices chosen here. These results could be a potential source to improve predictive skills for the understanding of ENSO, PDO and AMO interannual and decadal fluctuations. Better predictive models are imperative given that El Niño or La Niña has vast impacts on lives, property, and economic activity around the globe, especially when dramatic peaks of El Niño occur. The new cycle 25 has started and could have a major oceanic swing follow suit, and the next El Niño would be in around 2023–2024 according to historical events and results presented here.
Given that the paper was drafted before submitting in February 2022, and publication in October that year, the forecast of a 2023-24 El Nino was confirmed in a remarkable way.

To enlarge, open image in new tab.
The cyan line represents SST anomalies in the Tropics and shows the major El Ninos, 2015-16, 2019-20 and 2023-24. Note all three events included pairs of major NH summer warming peaks. The synopsis below consists of excerpts in italics with my bolds to present the broad strokes of the analyses and findings. (Note: The paper includes detailed analyses and many references to supporting studies, and interested readers can access them by linking there.)
Context
The surface-subsurface layers of the ocean that interact with the lower atmosphere alternately release and absorb heat energy. The work of Zhou and Tung (2010) reported the impact of the TSI on global SST over 150 years, finding signals of cooling and warming SSTs at the valley and peak of the SS cycles. Schlesinger and Ramankutty (1994) report a global cycle of 65–70 years for SST that is affected by greenhouse anthropogenic gases, sulphate aerosols and/or El Niño events, but they did not imply any external forcing such as the SS. There have been other studies on how solar radiation variability could affect temperature; recently, Cheke et al. (2021) have studied those solar cycles of SS that would affect the El Nino Southern Oscillation (ENSO) indexes.
There are well known oceanic events that show periodicity with low or high frequencies: 25–30 and 3–7 years, respectively. These include the Pacific Decadal Oscillation (PDO), Atlantic Multidecadal Oscillation (AMO), and Interdecadal Pacific Oscillation (IPO), as well as El Niño or La Niña. During El Niño events, the surface and subsurface lose energy to the atmosphere and the opposite occurs during La Niña; these events have a periodicity of 3–7 years. The Interdecadal oscillations have a series of impacts; e.g., the PDO gives rise to teleconnections between the tropic and mid-latitudes, and the effects include:
1) ocean heat content,
2) the lower and higher levels of the trophic chain including small pelagic fisheries (tuna and sardines);
3) biogeochemical air-sea CO2 fluxes;
4) the frequency of La Niña/El Niño.
The interactions between decadal oscillations PDO/IPO and AMO may also affect ocean heat content. All these low and high frequency oceanographic events have a direct impact on local, regional, and global climate patterns, and there is growing evidence from many studies that the driving source of energy is the sun.
Thus, whatever affects the solar irradiation falling on the surface of the oceans, including volcanic eruptions (Fang et al., 2020), and cloudiness for example, it would affect the gain or loss of heat content of the oceans. The cited works tried to find the physical reasons for these connections, but they remained unknown or difficult to explain.
The work reported here investigates how fluctuations of sunspots over time (1954–2019) may cross-correlate with low and high frequency oceanic events such as the sea surface temperature (SST), anomalies (SSTA), Oceanographic El Niño Index (ONI), Multivariate ENSO Index (MEI), Southern Oscillation Index (SOI) in the central and east equatorial Pacific Ocean; and PDO, as well as on the AMO in the North Pacific and Atlantic basins. The hypothesis is that even small variations of the TSI can be reflected in these tele-connected indexes.
Discussion

Fig. 1. Behaviour of monthly counts of SS, ONI, MEI, PDO and AMO. The Indexes start at t = 0, 12, 24 and 36 months (panels a, b, c, and d respectively). The SS series starts at t = 0 in the four panels. The left vertical axis gives the values for the Indexes, and SS counts at the right vertical scale. The end of each Schwabe cycle is marked by vertical dashed lines.
Maxima in the PDO, AMO, ONI, and MEI series were offset by 0, 12, 24 and 36 months (Fig. 1, panels a, b, c, and d respectively), with the SS series starts at t = 0 in the four panels. It has been reported that the lag times for responses of some Indexes to SS cycles (SS) are around 12–36 months (see fig. 1 of Hassan et al., 2016), and Fang et al. (2020) have reported that ENSO responds with a 2–3 years of lag time after a major volcanic eruption. From 1954 to the present time, each sunspot cycle from 19 to 24 has occurred with a period of around 11 years (Hathaway, 2015), which is slightly less than the 11.2 years reported by Dicke (1978). The highest SS activity is seen in cycle 19 with around 250 SS/month, followed by <150, and at cycle 21 around 200, before decreasing steadily over cycles 22 to 24 to just over 100 SS/month. Cycle 24 is the lowest contemporary value of SS activity that is comparable only to cycles 12–15 (around 1880–1930) and is the lowest in the last 200 years (Clette et al., 2014).

Fig. 12. Sunspots monthly counts curves per cycle. Red and blue lines represent El Niño and La Niña events. Note that Cycle 24 finished on December 2019 (National Weather Service, 2020).
The SSTA in El Niño 1 + 2 region cross-correlated with SS many times, especially during descending phases of all cycles except SS 22 with cc-ρ up 0.389 (SS 24) and main lag times from 5 to 13 months. The SS cycles (20 and 24) during cold phase PDO showed alternate cross-correlation reaching a maximum 0.389 and negative −0.314 (p < 0.05). During the ascending phase in El Niño 1 + 2 region (blue bars, Fig. 5a) the cc-ρ peaked at 0.393 (p < 0.05). In the cycles 19 and 24 the highest cc-ρ were found, −0.460 and 0.394 (p < 0.05) respectively. These coefficients coincided with the largest (over 2 years) and most intense (<−1.5C) La Niña during 1954–1955, and 2010–2012 (Fig. 12).
It must be noticed that during cycle 21 two big events El Niño (1983–1985) and La Niña (1984–1985) were registered as well as in cycles 23 and 24 with coefficients just around 0.2. The highest coefficients would mean an influence up to 21.2% and 15.5% of the SS on the SSTAs in El Niño 3.4 region. These results would suggest the cross-correlations are stronger in El Niño 3.4 region due to the less dispersing oceanographic-meteorological conditions than in El Niño 1 + 2 region. Also, these findings would suggest that during the cold phase of PDOs (see NOAA, 2016), the cc-ρ in El Niño 3.4 region tends to be higher, as the solar energy reaching the ocean surface increases as the cloudiness tends to decrease significantly during prolonged periods around or over in El Niño 3.4 region (Porch et al., 2006).
The sun cycle 19 is the most intense since the last 100 years, the contrary is the cycle 24 (NWS, 2021). In general, the ascending phase of the SS cycles takes a shorter time than descending phase, therefore the slope of the curve is steeper (Fig. 12); then the increasing change of the TSI influences in a clearer way the studied indexes. It seems that during the ascending phases, El Niño events are prone to develop as TSI increases (as well as UV radiation does, NWS, 2021), while during plunging SS phases, when the TSI tends to diminish (see Formula (1)), could lead to La Niña events, like the 2020–2022 occurrence (Ormaza-González, 2021).
Most of the La Niña events occur during the descending phase or just when approaching or leaving the valley or minimum SS counts (Fig. 12) when the TSI decreases and reaches the minimum (Scafetta et al., 2019). La Niña 2020–2022 is a good example, the lowest SS counts (<2 counts/months) occurred during extended periods when reaching the valley of the SS 24. The valley of SS 24 has had an extended period of close to 3 years, during which there have been weeks and months without sunspots, before the SS 25 started in December 2020.
The weakest sunspot cycle (SS 24) over the last 100 years (NWS, 2021) has had four La Niña events: 2007–2009, 2010–2012, 2016–2017, and 2020–2022 (Fig. 12), it is the only cycle with that number of La Niña events.
Conclusions
Over the studied period 1954–2019, sunspot numbers decreased from a monthly maximum between 225 (SS 21) to a minimum around 20–25 (SS 24). The SS 24 had 913 days without SS counts until December 2019 (Burud et al., 2021), being this cycle the weakest since 1755; and the SS 25 will probably be weaker than or like SS 24 (Ineson et al., 2014; Chowdhury et al., 2021; NASA, 2021a, NASA, 2021b). Thus, the Earth has been receiving slightly decreasing solar energy over this almost 7-decade period.
On the ocean surface the influence of sunspots could chiefly be due to UV energy fluctuation (Ineson et al., 2014) as this radiation penetrates down to 75–100 m depth in the water column (Smyth, 2011). van Loon et al. (2007) suggested that even though SS cycles produce weak changes on the Total Solar Irradiation (TSI) of about 0.07% (Gray et al., 2010), these can still produce decadal and millennial impacts on global thermohaline circulation (Bond et al., 2001; Gray et al., 2016).
The ONI Index showed to be poorly cross-correlated with cc-ρ values <0.100, only twice approached to −0.200. On the other hand, the MEI registered around ±0.200 through all cycles and predominant lag times within 12 months. The SOI showed cross-correlations with SS cycles (19–21, and) averaging a coefficient of 0.200 with lags times range of 9–34 months. The SOI temporal behaviour has also been associated with SS and it could enhance or affect the oceanographic Indexes of the equatorial Pacific (Higginson et al., 2004). [The Multivariate ENSO Index does not only consider the SST Anomaly but also sea-level pressure and other variables.]
The MEI index could have been influenced from 7.3% up to 23%. The MEI correlated in all ascending and descending phases of SS cycles. The SOI had similar cross-correlation coherence to those oceanographic indexes during ascending and descending phases. These results would provide evidence on how SS affects the studied Indexes during the ascending/descending phases of their cycles. In some cycles, the impact will be stronger and in other weaker depending on intensity and behaviour in time of the cycle.
Finally, did Schwabe cycles 19–24 influence the ENSO events, PDO, and AMO indexes in the Pacific and Atlantic Oceans? Yes, it has been found a wide range correlation coefficient from 0.100 to about 0.500 statistically significant (p < 0.05) with lag times from few months to over 2 years between the Schwabe cycles and the ocean indices chosen here. These results could be a potential source to improve predictive skills for the understanding of ENSO, PDO and AMO interannual and decadal fluctuations. Better predictive models are imperative given that El Niño or La Niña has vast impacts on lives, property, and economic activity around the globe, especially when dramatic peaks of El Niño occur. The new cycle 25 has started and could have a major oceanic swing follow suit, and the next El Niño would be in around 2023–2024 according to historical events and results presented here.

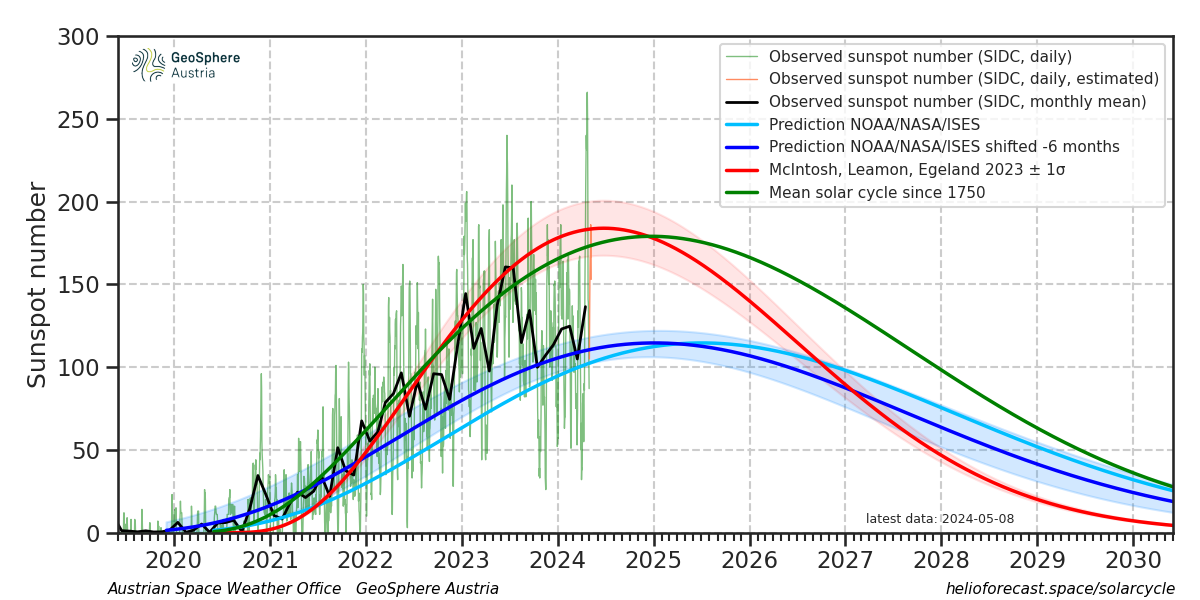
Interesting stuff. However ‘the SS 25 will probably be weaker than or like SS 24‘ is not working out that way, which has confounded many solar cycle pundits. It could have more surprises yet of course.
LikeLike
True oldbrew, that current observations show SS 25 exceeding expectations so far:
LikeLike