
The animation shows end of March Arctic ice extents on day 91 over the last 19 years (length of MASIE dataset). Of course central Arctic basins are frozen solid, and the fluctuations are visible on the marginal basins both the Atlantic side (right) and the Pacific (left). Note the higher extents in 2012, followed by lesser ice, then overcome by 2024.
After a sub-par March maximum, now in mid-April, 2025 Arctic ice has mostly closed the gap with the 19-year average.
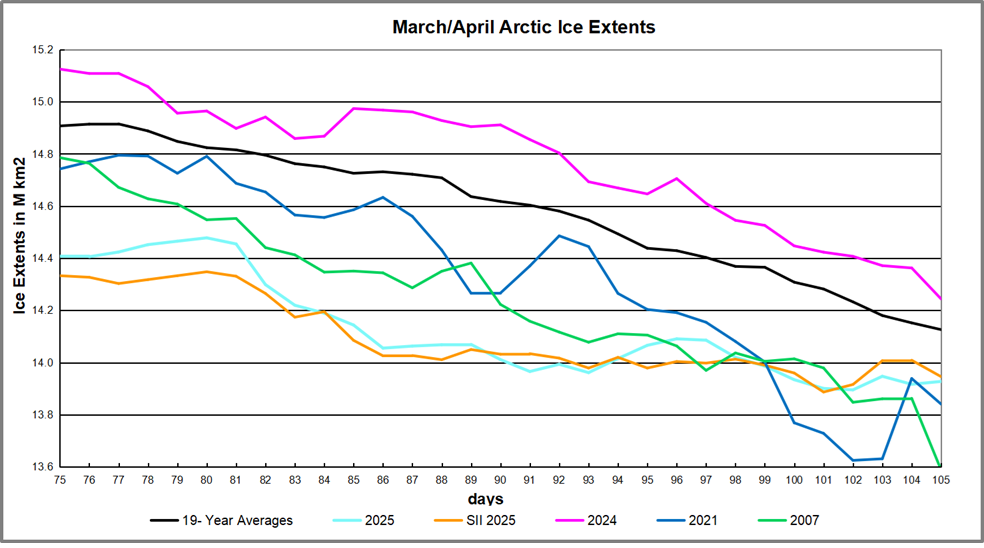
Day 75 is mid-March, typically near the highest daily extents of the year. At that time 2025 was ~500k km2 below average, or Half a Wadham in deficit. By end of March this year the gap below average reached 600k km2. However, note that over these 30 days MASIE shows an average ice extent loss of 781k km2, while 2025 lost almost no ice in April, hanging around the 14M km2 mark. Both MASIE and SII showed the same resilience pattern in April 2025, well above 2021 and especially 2007. The regional distribution of ice extents is particularly revealing.
| Region | 2025105 | Day 105 Ave. | 2025-Ave. | 2007105 | 2025-2007 |
| (0) Northern_Hemisphere | 13927695 | 14126275 | -198580 | 13588722 | 338973 |
| (1) Beaufort_Sea | 1071001 | 1069881 | 1119 | 1068692 | 2309 |
| (2) Chukchi_Sea | 965989 | 964751 | 1238 | 961638 | 4352 |
| (3) East_Siberian_Sea | 1087137 | 1085653 | 1484 | 1078666 | 8471 |
| (4) Laptev_Sea | 897845 | 893756 | 4089 | 843501 | 54344 |
| (5) Kara_Sea | 921800 | 923592 | -1792 | 890594 | 31206 |
| (6) Barents_Sea | 517245 | 621900 | -104655 | 439904 | 77341 |
| (7) Greenland_Sea | 710333 | 661040 | 49293 | 673585 | 36749 |
| (8) Baffin_Bay_Gulf_of_St._Lawrence | 1306106 | 1274576 | 31530 | 1215526 | 90580 |
| (9) Canadian_Archipelago | 854878 | 853052 | 1826 | 848812 | 6066 |
| (10) Hudson_Bay | 1248738 | 1246317 | 2422 | 1208588 | 40150 |
| (11) Central_Arctic | 3246240 | 3234033 | 12206 | 3235648.34 | 10591 |
| (12) Bering_Sea | 657229 | 646796 | 10433 | 600281.22 | 56948 |
| (13) Baltic_Sea | 13278 | 43789 | -30511 | 23534.37 | -10256 |
| (14) Sea_of_Okhotsk | 427895 | 601889 | -173994 | 491121 | -63226 |
The table shows only two significant deficits to average; Okhotsk alone is -174k km2, nearly matching the overall total of -199k km2, which is 1.4% below average. The other deficit in Barents is mostly offset by surpluses in nearly every other Arctic basin with the exception of Baltic Sea. Clearly the core Arctic ocean is solidly frozen, with a few fringe seas going to open water slightly ahead of schedule.
Why is this important? All the claims of global climate emergency depend on dangerously higher temperatures, lower sea ice, and rising sea levels. The lack of additional warming prior to 2023 El Nino is documented in a post Ocean Warms, Land Cools UAH February 2025.

The lack of acceleration in sea levels along coastlines has been discussed also. See Observed vs. Imagined Sea Levels 2023 Update
Also, a longer term perspective is informative:


