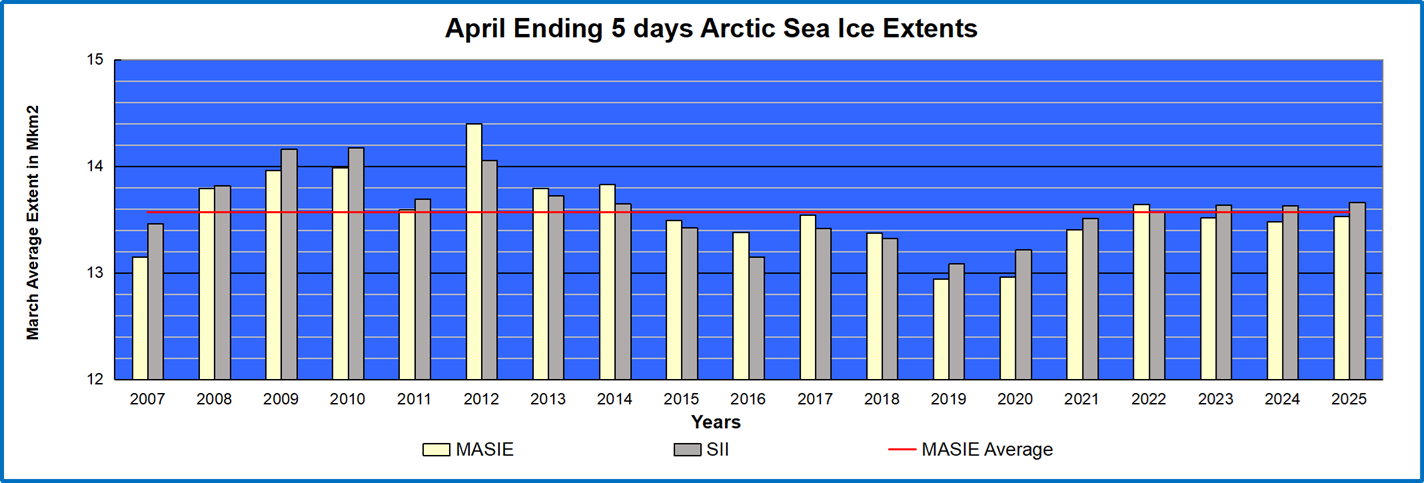
NOAA refers to the Month end Arctic ice extent by averaging the last five days extents. Thus monthly gains and losses of ice can be obtained by subtracting the previous month end ice amount. The chart above shows the April month end Arctic ice extents since 2007, comparing the two relevant datasets: Sea Ice Index (SII, based on satellite microwave sensors) and Multisensor Analyzed Sea Ice Extent (MASIE, based on multiple sources including several satellite sensors and visual analysis).
A sine wave pattern is evident starting after the low 2007 extent, rising to a peak in 2012, declining to 2019, before returning to the mean the last four years.
After a sub-par March maximum, now in April, 2025, Arctic ice has closed the gap with the 19-year average.
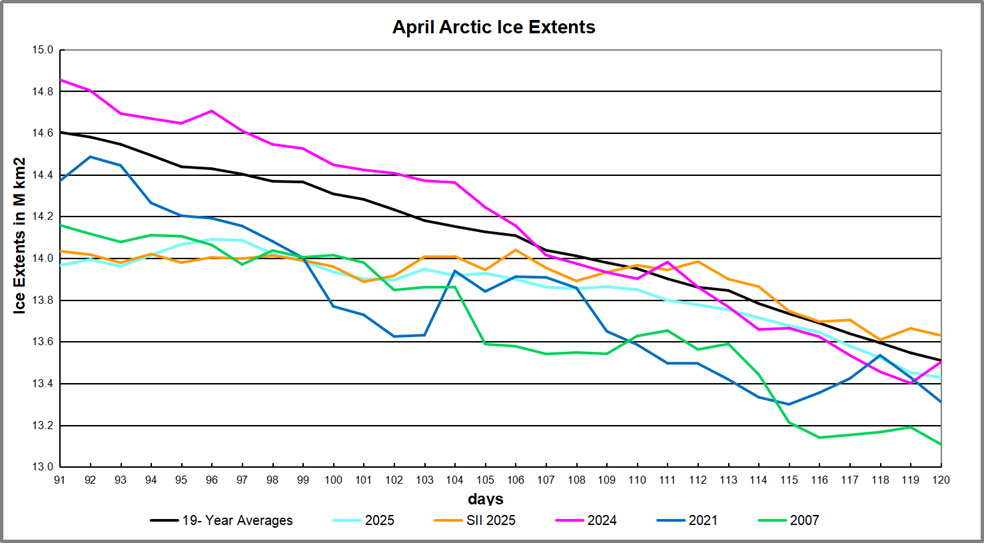
During April the average year loses 1.1M km2 of ice extent. Meanwhile 2025 lost only 0.538 M km2, about half as much. The end result is MASIE showing a slight deficit and SII a small surplus at end of April.
The regional distribution of ice extents is particularly revealing, as shown in the table below.
| Region | 2025120 | Day 120 Ave. | 2025-Ave. | 2007120 | 2025-2007 |
| (0) Northern_Hemisphere | 13428208 | 13510326 | -82118 | 13108068 | 320140 |
| (1) Beaufort_Sea | 1071001 | 1068240 | 2761 | 1059189 | 11811 |
| (2) Chukchi_Sea | 963094 | 957153 | 5942 | 949246 | 13848 |
| (3) East_Siberian_Sea | 1087137 | 1085746 | 1391 | 1080176 | 6961 |
| (4) Laptev_Sea | 893105 | 891206 | 1899 | 875661 | 17444 |
| (5) Kara_Sea | 927530 | 915007 | 12523 | 864664 | 62866 |
| (6) Barents_Sea | 563013 | 552738 | 10275 | 396544 | 166470 |
| (7) Greenland_Sea | 703059 | 661036 | 42023 | 644438 | 58621 |
| (8) Baffin_Bay_Gulf_of_St._Lawrence | 1129634 | 1194283 | -64650 | 1147115 | -17481 |
| (9) Canadian_Archipelago | 854878 | 849548 | 5330 | 838032 | 16846 |
| (10) Hudson_Bay | 1249532 | 1238910 | 10622 | 1222074 | 27458 |
| (11) Central_Arctic | 3244486 | 3231137 | 13349 | 3241034.13 | 3452 |
| (12) Bering_Sea | 441499 | 477412 | -35913 | 475489 | -33990 |
| (13) Baltic_Sea | 11180 | 21561 | -10382 | 14683.79 | -3504 |
| (14) Sea_of_Okhotsk | 287204 | 363423 | -76219 | 295743 | -8539 |
The table shows only three significant deficits to average; Okhotsk is -72k km2, and Bering adds -40k, together greater than the overall -82k km2, which is 0.6% below average. The other deficit in Baffin Bay is offset by surpluses in nearly every other Arctic basin with the exception of Baltic Sea. Clearly the core Arctic ocean is solidly frozen, with a few fringe seas going to open water slightly ahead of schedule.
Why is this important? All the claims of global climate emergency depend on dangerously higher temperatures, lower sea ice, and rising sea levels. The lack of additional warming prior to 2023 El Nino is documented in a post March 2025 UAH Yo-yo Temps.

The lack of acceleration in sea levels along coastlines has been discussed also. See Observed vs. Imagined Sea Levels 2023 Update
Also, a longer term perspective is informative:


