Update August 2, 2025
NSDIC acknowledged my query regarding the SII (Sea Ice Index) dataset, which is described below. While awaiting an explanation I have investigated further. My last download of the SII Daily Arctic Ice Extents was on July 30, meaning that the most recent data in that file was day 210, July 29. The header on that file was Sea_Ice_Index_Daily_Extent_G02135_v3. Then on August 1, the downloaded file had the heading Sea_Ice_Index_Daily_Extent_G02135_v4. So it appears that these are now the values from a new version of SII. As I wrote in my query, since March 14 all of the values for Arctic Ice Extents are lower in this new record. The graph below shows the implications for July as an example.
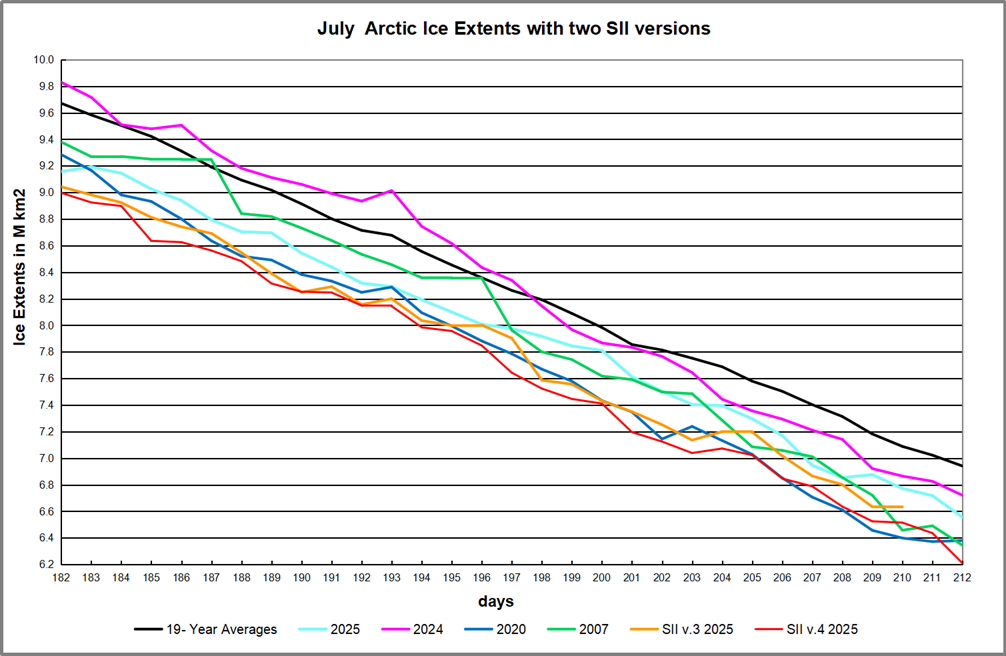
You can see how v.4 in red is lower than v.3 in orange throughout the month. It may be that v.3 values will no longer be reported in the future, though that has not been confirmed to me. It should also be noted that v.3 values for 2024 and prior years have also been altered in v.4 and I intend to look into that impact.
Note: After comparisons of monthly averages, results from the two versions appear comparable for previous years. The change started in January 2025 and will be the basis for future reporting. The logic for this is presented in this document: Sea Ice Index Version 4 Analysis
In June 2025, NSIDC was informed that access to data from the Special Sensor Microwave
Imager/Sounder (SSMIS) onboard the Defense Meteorological Satellite Program (DMSP)
satellites would end on July 31 (NSIDC, 2025). To prepare for this, we rapidly developed version
4 of the Sea Ice Index. This new version transitions from using sea ice concentration fields
derived from SSMIS data as input to using fields derived from the Advanced Microwave
Scanning Radiometer 2 (AMSR2) sensor onboard the Global Change Observation Mission – W1
(GCOM-W1) satellite.
On 29 July 2025, we learned that the Defense Department decision to terminate access to
DMSP data had been reversed and that data will continue to be available until September 2026.
We are publishing Version 4, however, for these reasons:
• The SSMIS instruments are well past their designed lifespan and a transition to
AMSR2 is inevitable. Unless the sensors fail earlier, the DoD will formally end the
program in September 2026.
• Although access of SSMIS will continue through September 2026, the Fleet
Numerical Meteorology and Oceanography Center (FNMOC), where SSMIS data
from the DMSP satellite are downloaded, made an announcement that “Support
will be on a best effort basis and should be considered data of opportunity.” This
means that SSMIS data will likely contain data gaps.
• We have developer time to make this transition now and may not in the future.
• We are confident that Version 4 data are commensurate in accuracy to those
provided by Version 3.
Overview
Before presenting the MASIE and SII results for July, a note about a strange thing in today’s Sea Ice Index report. I have sent a note to them requesting an explanation for why the values have been altered from those in the dataset just two days ago. When attempting to add into my spreadsheets the final two July days, I noticed that all the previous values were now different. Exploring further, going back to beginning of 2024 all values had changed, some showing larger extents and many showing smaller ice extents than previous recorded.
For 2024 the new values added ice extents with the average day gaining slightly (47k km2). But in 2025 so far, the average day lost (-57k km2) compared to the values two days ago. Curiously, since March 14, 2025 all days had lower values at a daily rate of -75k km2. In sum, the altered values in 2025 removed ~11M km2 of ice extents so far, and 10M km2 of that since March 14. In the report below, I excluded the altered SII values awaiting news from NSIDC.
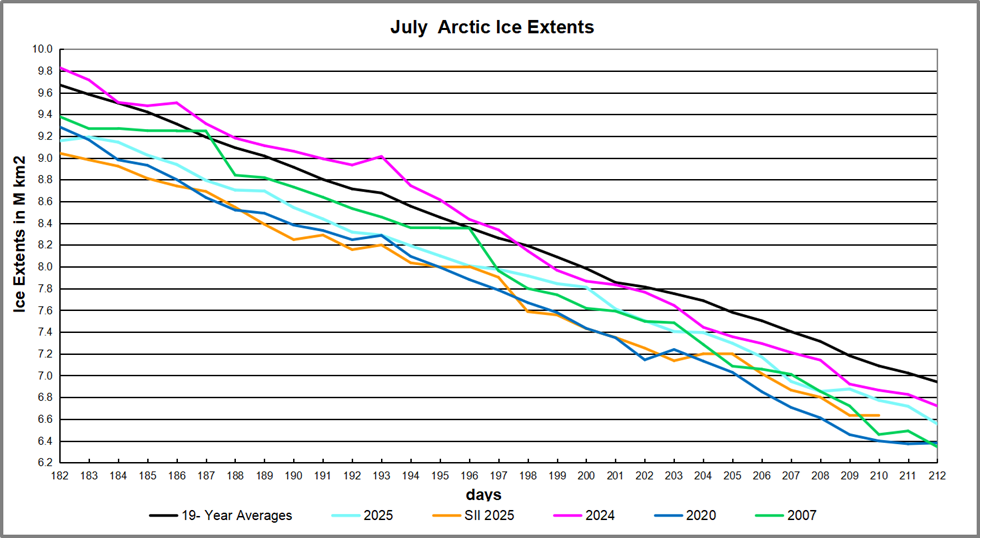
After a sub-par March maximum, by end of May 2025 Arctic ice closed the gap with the 19-year average. Then in June the gap reopened and in July the melting pace matched the average, abeit four days in advance of average. The chart shows the July Arctic ice extents on average decline from 9.7M to 6.9M km2. MASIE started July ~5M km2 in deficit to average and ended the month ~4M km2 down, continuing to melt about four days in advance of the average decline. SII matched MASIE the first half of July, then tracked slightly lower the second half.
The regional distribution of ice extents is shown in the table below. (Bering and Okhotsk seas are excluded since both are now virtually open water.)
| Region | 2025212 | Day 212 | 2025-Ave. | 2020212 | 2025-2020 |
| (0) Northern_Hemisphere | 6555733 | 6941055 | -385322 | 5880746 | 674988 |
| (1) Beaufort_Sea | 944231 | 793206 | 151025 | 875454 | 68777 |
| (2) Chukchi_Sea | 621236 | 555019 | 66217 | 533748 | 87488 |
| (3) East_Siberian_Sea | 683122 | 751512 | -68390 | 329453 | 353669 |
| (4) Laptev_Sea | 329581 | 370847 | -41266 | 61979 | 267602 |
| (5) Kara_Sea | 32436 | 166826 | -134390 | 95539 | -63103 |
| (6) Barents_Sea | 1131 | 29555 | -28424 | 23940 | -22808 |
| (7) Greenland_Sea | 228078 | 296681 | -68603 | 282403 | -54325 |
| (8) Baffin_Bay_Gulf_of_St._Lawrence | 117170 | 150751 | -33581 | 35368 | 81801 |
| (9) Canadian_Archipelago | 460908 | 547942 | -87034 | 515499 | -54592 |
| (10) Hudson_Bay | 73633 | 139798 | -66165 | 92861 | -19228 |
| (11) Central_Arctic | 3062678 | 3137162 | -74483 | 3033706.07 | 28972 |
The table shows most regions in deficit with Kara the largest, and Canadian Archipelago and Central Arctic also sizable. Hudson Bay and Greenland Sea will lose the rest of their ice in upcoming weeks. Surpluses in Beaufort and Chukchi offset about 220k km2 of losses elsewhere.

Why is this important? All the claims of global climate emergency depend on dangerously higher temperatures, lower sea ice, and rising sea levels. The lack of additional warming prior to 2023 El Nino is documented in a post NH and Tropics Lead UAH Temps Lower May 2025.

The lack of acceleration in sea levels along coastlines has been discussed also. See Observed vs. Imagined Sea Levels 2023 Update
Also, a longer term perspective is informative:


Illustration by Eleanor Lutz shows Earth’s seasonal climate changes. If played in full screen, the four corners present views from top, bottom and sides. It is a visual representation of scientific datasets measuring Arctic ice extents and NH snow cover.

One comment